The Reality of GitOps: What Actually Happens When You Connect Everything

Setting up GitOps integration isn't as clean as the architecture diagrams suggest. Here's what you'll actually encounter when wiring together Docker, Kubernetes, ArgoCD, and Prometheus.

Kubernetes Architecture

Docker: The Easy Part That Gets Complicated

Docker containers work great until you start optimizing them. Multi-stage builds will save you disk space but cost you sanity when debugging why your production image is missing dependencies that were available during the build stage.

The gotcha: Alpine-based images look appealing because they're tiny, but you'll spend hours tracking down missing `glibc` dependencies. Ubuntu images are 10x larger but actually fucking work. Choose your pain.

Version warning: Docker 20.10.17 has a known issue with BuildKit that causes random build failures on ARM64. In 2025, use Docker 27.x+ with containerd integration - it's finally stable and fixes most ARM64/Apple Silicon issues.

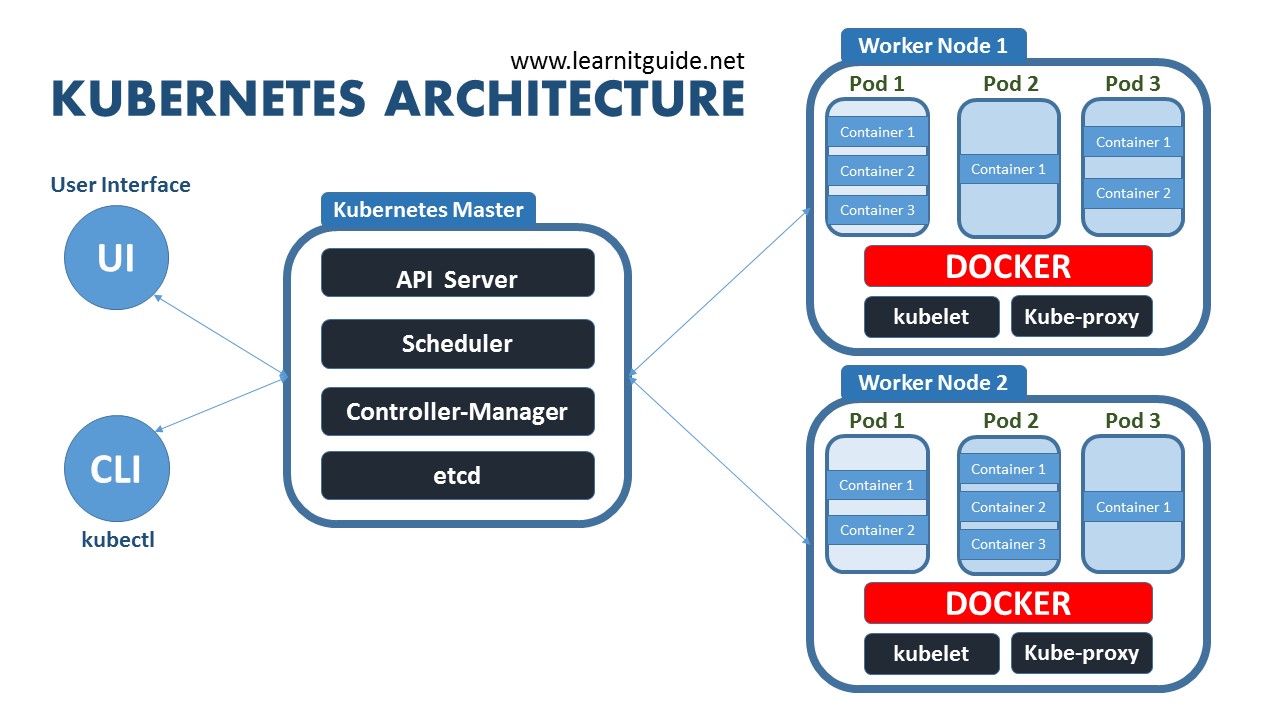
Kubernetes: Where Dreams Go to Die

Kubernetes networking is about as intuitive as assembly language. You'll spend your first week figuring out why pods can't reach each other despite being in the same namespace.

The learning curve: Expect 2-3 months before you stop googling "how to debug CrashLoopBackOff". Kubernetes 1.30+ improved error messages slightly, but the logs are still scattered across multiple components, and `kubectl describe` output reads like machine-generated poetry.

Memory management: If you don't set resource limits, one runaway pod will consume all available memory and crash your entire node. If you set limits too low, your perfectly working application will get OOMKilled during peak traffic.

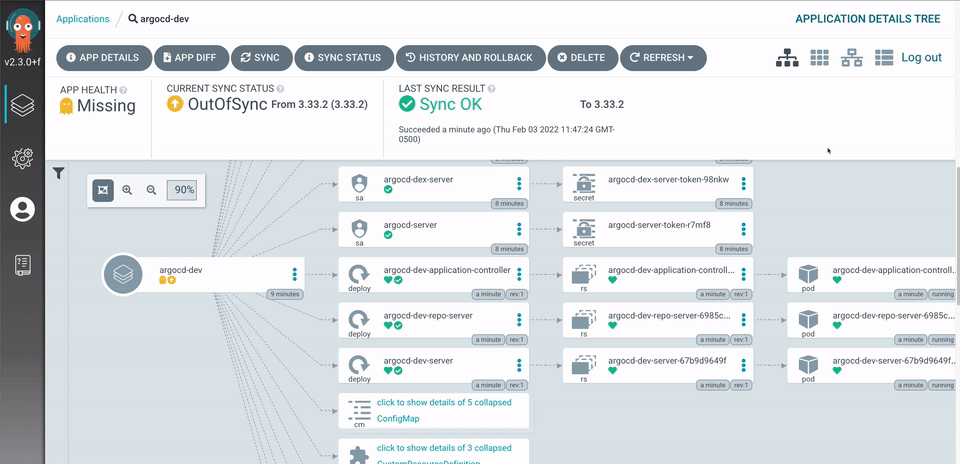
ArgoCD: Beautiful UI, Terrible Debugging

ArgoCD's interface looks professional but becomes useless the moment something breaks. The sync status will show "Healthy" while your application returns 500 errors because ArgoCD only checks if Kubernetes accepted the manifests, not if they actually work.

Sync failures: ArgoCD will randomly stop syncing and you'll spend 3 hours troubleshooting only to discover it was a Redis connection timeout. The solution is always "restart the ArgoCD pods" but the root cause is never documented.

RBAC nightmares: Getting permissions right requires a PhD in Kubernetes RBAC. Too restrictive and deployments fail silently. Too permissive and you've violated every security policy your company has.

Prometheus: Memory Eating Monster

Prometheus Architecture

Prometheus collects every metric from every pod and will happily consume all your RAM doing it. The default retention policy keeps data forever, which sounds great until you realize it's storing terabytes of mostly useless metrics.

Storage nightmare: Plan for 200GB+ storage minimum. Without proper configuration, Prometheus will fill your disk in a few weeks. Set retention to 15 days unless you have infinite money for storage.

Grafana dependency: Prometheus metrics are useless without Grafana dashboards. You'll spend days creating custom PromQL queries only to discover someone already built the exact dashboard you need and published it on grafana.com.

The Repository Structure That Actually Works

Forget the textbook patterns. Here's what works in practice:

Separate app and config repos: Your application code goes in one repo, Kubernetes manifests in another. Why? Because developers will push broken YAML if you mix them, and debugging becomes impossible.

Branch-based environments are garbage: Using git branches for dev/staging/prod sounds clever but creates merge conflicts from hell. Use directory-based environments instead:

/environments/
  /prod/
  /staging/
  /dev/

Config templates save sanity: Use Helm or Kustomize. Raw YAML files mean copying the same configuration 20 times and forgetting to update half of them when values change.

Security: The Thing Everyone Ignores

Kubernetes security is an afterthought until your cluster gets compromised. Here's the minimum you need:

Image scanning: Trivy finds vulnerabilities but produces so many false positives you'll ignore them all. Configure it to only alert on "High" and "Critical" CVEs or prepare to hate your life.

RBAC hell: Every service account needs exactly the permissions it requires and nothing more. Good luck figuring out what that is without breaking everything first.

Secret management: Don't put secrets in Git even if they're "encrypted". Use External Secrets Operator or similar tools. Your future self will thank you when you're not rotating API keys after accidentally committing them to GitHub.

This stack works once you accept that it will break in creative ways and build your debugging skills accordingly.

Step-by-Step Setup: How to Actually Implement This Shit

Here's how to wire everything together without losing your mind. This took me 6 months and two production outages to figure out.

ArgoCD Interface

Step 1: Get Docker Images Working First

Before you even think about GitOps, make sure your Docker builds aren't garbage.

The Alpine trap: Everyone uses Alpine because it's small, then spends weeks debugging missing dependencies. Here's what actually works:

## This works but is huge
FROM node:18-bullseye-slim
WORKDIR /app
COPY package*.json ./
RUN npm ci --only=production
COPY . .
CMD ["npm", "start"]

Multi-stage builds sound great until you realize debugging becomes impossible because your build environment is different from runtime. Use them for production, but keep a simple single-stage build for development.

Registry gotcha: Docker Hub rate limits will randomly break your builds. Use a paid registry or prepare for mysterious CI failures.

Step 2: Set Up Kubernetes (The Pain Begins)

Memory limits are not optional: Every container must have memory limits or one runaway process will kill your entire node. Start with:

resources:
  requests:
    memory: "64Mi"
    cpu: "50m"
  limits:
    memory: "128Mi"
    cpu: "100m"

Ingress is a shitshow: NGINX Ingress Controller works but the configuration syntax is insane. Expect to spend 2 days getting basic path routing working.

Namespaces matter: Don't put everything in `default`. Create separate namespaces for apps, monitoring, and ingress or you'll have permission nightmares later.

Step 3: Install ArgoCD (Where Things Get Interesting)

ArgoCD installation is deceptively simple until you need it to actually work in production:

## Don't use this in prod
kubectl create namespace argocd
kubectl apply -n argocd -f https://raw.githubusercontent.com/argoproj/argo-cd/stable/manifests/install.yaml

The real config you need:

## This actually works for production
server:
  extraArgs:
    - --insecure  # Use ingress for TLS termination
  config:
    url: https://argocd.yourdomain.com
    application.instanceLabelKey: argocd.argoproj.io/instance

RBAC will make you cry: ArgoCD needs service account permissions to deploy to Kubernetes. Too much access violates security policies, too little breaks deployments. Start with cluster-admin and restrict later.

Redis dependency: ArgoCD uses Redis and doesn't tell you when it breaks. When deployments randomly stop syncing, restart the Redis pod first.

Step 4: Repository Structure That Won't Drive You Insane

Separate repos for everything:

  • app-source - Your application code
  • app-manifests - Kubernetes YAML files
  • infrastructure - Monitoring, ingress, etc.

Why separate? Because developers will break YAML if you mix it with code. Trust me on this.

Directory structure that works:

app-manifests/
├── apps/
│   ├── frontend/
│   └── backend/
├── environments/
│   ├── dev/
│   ├── staging/
│   └── prod/
└── base/
    └── common-configs/

Use Helm or Kustomize: Raw YAML means copying configurations everywhere and forgetting to update them. Helm is more complex but handles dependencies better.

Step 5: Set Up Prometheus (Prepare for Memory Pain)

Prometheus Monitoring Stack

Installation using kube-prometheus-stack is straightforward but the defaults will kill your cluster:

helm install prometheus prometheus-community/kube-prometheus-stack \
  --set prometheus.prometheusSpec.retention=15d \
  --set prometheus.prometheusSpec.resources.requests.memory=8Gi \
  --set prometheus.prometheusSpec.resources.limits.memory=16Gi

Storage requirements: Prometheus with default settings will collect every metric from every pod and store it forever. Plan for 100GB+ storage minimum or your disk will fill up in weeks.

Memory consumption: Prometheus uses roughly 1-3GB RAM per million time series. A small cluster generates 500k+ series easily. Don't cheap out on memory.

Grafana dashboards: The included dashboards are decent but you'll spend days customizing them. Import dashboard 6417 for ArgoCD monitoring and save yourself hours.

Step 6: Wire Everything Together (The Integration Hell)

ArgoCD won't automatically monitor itself. You need to create ServiceMonitor resources:

apiVersion: monitoring.coreos.com/v1
kind: ServiceMonitor
metadata:
  name: argocd-metrics
  namespace: monitoring
spec:
  selector:
    matchLabels:
      app.kubernetes.io/name: argocd-metrics
  endpoints:
  - port: metrics

Common failure points:

What Will Break (And How to Fix It)

ArgoCD sync failures: When ArgoCD shows "OutOfSync" but won't sync:

  1. Check Git repository connectivity
  2. Verify RBAC permissions on target namespace
  3. Look for resource conflicts (duplicate names)
  4. Restart ArgoCD server pod (works 80% of the time)

Prometheus OOM kills: When Prometheus keeps crashing:

  1. Reduce retention period to 7 days
  2. Increase memory limits to 16GB+
  3. Use recording rules to pre-aggregate metrics
  4. Consider Prometheus federation for large clusters

Networking failures: When pods can't communicate:

  1. Check network policies (they block everything by default)
  2. Verify ingress controller is running
  3. Test DNS resolution with nslookup kubernetes.default
  4. Check if service ports match container ports

This setup will work once you accept it requires constant maintenance and debugging skills.

GitOps Implementation Approaches: Architecture Patterns Comparison

Component

Argo CD + Prometheus

Flux + Grafana

Jenkins X + Tekton

GitLab + Kubernetes

GitOps Controller

Argo CD

  • Declarative sync engine

Flux v2

  • Kubernetes-native GitOps

Jenkins X

  • Automated CI/CD

GitLab Agent

  • Integrated platform

Container Building

External CI (GitHub Actions, GitLab)

External CI + Flux Image Automation

Tekton Pipelines built-in

GitLab CI/CD integrated

Monitoring Stack

Prometheus + Grafana

Grafana + Prometheus

Jenkins X Observability

GitLab Observability

Secret Management

External Secrets Operator

SOPS + Flux

Kubernetes External Secrets

GitLab CI Variables

Multi-cluster Support

Native cluster management

Flux multi-tenancy

Multiple cluster contexts

Environment-based clusters

Learning Curve

Moderate

  • Familiar UI

Steep

  • Kubernetes-native CRDs

Complex

  • Many moving parts

Easy

  • Integrated platform

Ecosystem Maturity

High

  • CNCF graduated project

High

  • CNCF incubating

Medium

  • Jenkins X v3 rebuilding

High

  • Enterprise focused

FAQ: Real Problems and Solutions That Actually Work

Q

Why does ArgoCD randomly stop syncing and how do I fix it?

A

The Redis problem: ArgoCD uses Redis for caching and doesn't gracefully handle connection failures. When Redis hiccups, ArgoCD silently stops syncing without any useful error messages.

Q

How do I stop Prometheus from eating all my RAM?

A

Quick fix: kubectl rollout restart deployment argocd-server -n argocd

Better fix: Configure Redis with persistence and resource limits:

redis:
  resources:
    requests:
      memory: 256Mi
    limits:
      memory: 512Mi
  persistence:
    enabled: true
    size: 1Gi

The RBAC problem: ArgoCD service accounts lose permissions during cluster upgrades. Check with:

kubectl auth can-i create deployments --as=system:serviceaccount:argocd:argocd-application-controller

If it returns "no", you need to fix the ClusterRoleBinding.

Q

Why is my Docker image huge and builds take forever?

A

The default config is garbage. Prometheus with default settings will collect metrics from every pod and store them forever until your disk explodes.

Memory limiting (set these or die):

prometheus:
  prometheusSpec:
    resources:
      requests:
        memory: 8Gi
      limits:
        memory: 16Gi
    retention: 15d  # Don't keep data forever

Scrape interval tuning: Default 15s is overkill. Use 60s for most things:

global:
  scrape_interval: 60s

War story: We had Prometheus OOMKill every day until we set retention to 7 days and limited scraping to essential services only.

Q

How do I debug CrashLoopBackOff pods?

A

Alpine isn't always smaller when you need Python, Node, or other high-level languages. You spend more time installing dependencies than you save in image size.

Layer optimization matters more:

## Bad: Creates huge layers
COPY . .
RUN npm install && npm run build

## Good: Optimizes for caching
COPY package*.json ./
RUN npm ci --only=production
COPY src/ ./src/
RUN npm run build

Multi-stage builds help but make debugging impossible. Keep single-stage builds for development.

Q

How do I handle secrets without putting them in Git?

A

The error message is useless. Here's what actually helps:

  1. Check the previous crash logs: kubectl logs <pod> --previous
  2. Check events: kubectl describe pod <pod>
  3. Check resource limits: pods crash if they exceed memory limits
  4. Check startup time: pods crash if readiness probes fail too early

Common causes:

  • Missing environment variables
  • Database connection failures
  • Insufficient memory/CPU limits
  • Wrong container ports in service definitions
Q

Why does my ingress return 503 errors?

A

Never put secrets in Git, even encrypted ones. Use External Secrets Operator:

apiVersion: external-secrets.io/v1beta1
kind: ExternalSecret
metadata:
  name: app-secrets
spec:
  refreshInterval: 1h
  secretStoreRef:
    name: vault-backend
    kind: SecretStore
  target:
    name: app-secrets
  data:
  - secretKey: db-password
    remoteRef:
      key: myapp/db
      property: password

Integration pain points:

  • External Secrets Operator requires vault/AWS permissions
  • Secrets don't auto-refresh when source changes
  • ArgoCD won't show secret contents in UI (which is good)
Q

How much will this cost and how long does setup take?

A

The service is probably wrong. Check these in order:

  1. Pod is running: kubectl get pods - if CrashLoopBackOff, fix the pod first
  2. Service ports match: kubectl describe service <name> - targetPort must match container port
  3. Service selector works: kubectl get endpoints <service-name> - should show pod IPs
  4. Ingress path is correct: Most ingress controllers are picky about trailing slashes

Common mistake: Service port 80, container port 3000, but no targetPort specified.

## Fix this:
ports:
- port: 80
  targetPort: 3000  # Add this line
Q

What breaks first and how do I prepare?

A

Time reality check:

  • Basic setup (if you know what you're doing): 1-2 weeks
  • First-time setup (learning as you go): 2-3 months
  • Production-ready with monitoring: 3-6 months
  • Getting good at debugging: 6-12 months

AWS cost estimates (us-east-1, September 2025 pricing):

  • EKS cluster: $73/month (unchanged)
  • 3 t3.medium nodes: $105/month (slight increase)
  • Application Load Balancer: $27/month (price increase)
  • EBS storage (100GB gp3): $8/month (gp3 is cheaper than gp2)
  • Total: ~$215-320/month minimum

Hidden costs:

  • Your time debugging at 3am
  • Prometheus storage if you don't set retention
  • NAT gateway charges ($45/month each)
  • Data transfer fees (can be significant)
Q

How do I debug when ArgoCD shows "Healthy" but my app doesn't work?

A

Certificate expiration is the #1 cause of outages. Let's Encrypt certs expire every 90 days. cert-manager should auto-renew but sometimes doesn't.

ArgoCD authentication breaks during upgrades. Have an admin password ready:

kubectl -n argocd get secret argocd-initial-admin-secret -o jsonpath="{.data.password}" | base64 -d

Kubernetes cluster upgrades break everything:

  • Node upgrades can evict pods randomly
  • API version deprecations break deployments
  • CNI updates can cause network failures
  • Always test upgrades on staging first (seriously)

Resource exhaustion:

  • One misconfigured pod can consume all cluster memory
  • Prometheus without limits will eat all disk space
  • Too many metrics collectors will overload the Kubernetes API

Keep emergency procedures documented and practice them before you need them.

Q

Version-specific gotchas that will ruin your day

A

ArgoCD only checks if Kubernetes accepted the YAML, not if your application actually works. Here's how to debug:

  1. Check pod status: kubectl get pods -n <namespace> - pods might be running but failing internally
  2. Check service endpoints: kubectl get endpoints <service> - no endpoints means selector is wrong
  3. Check logs: kubectl logs <pod> - application might be crashing after startup
  4. Test connectivity: kubectl exec -it <pod> -- curl http://service-name:port

Common gotchas:

  • Readiness probes pass but liveness probes fail
  • Database connections work initially then timeout
  • Environment variables missing or wrong
  • Config maps not mounted properly
Q

What's the emergency rollback procedure?

A

ArgoCD 2.12+ (September 2025): Much more stable than 2.8.x but still has Redis dependency issues. The new "ApplicationSet" controller is finally reliable.

Kubernetes 1.30+ (2025): Gateway API is now stable and replaces Ingress. Start migrating:

## Old Ingress (still works)
apiVersion: networking.k8s.io/v1
kind: Ingress
## New Gateway API (recommended)
apiVersion: gateway.networking.k8s.io/v1
kind: HTTPRoute

Docker 27.x (2025): Fixed most ARM64 issues, containerd integration is solid. No more BuildKit random failures.

Prometheus 2.50+ (2025): New native histograms reduce memory usage by 50%. Upgrade path is cleaner but still requires storage migration.

Helm 3.15+ (2025): OCI registry support is finally stable. You can store charts in container registries now.

Q

Why does ArgoCD randomly stop syncing and how do I fix it?

A

When ArgoCD is working:

## Revert the Git commit
git revert <commit-hash>
git push

## Force sync in ArgoCD
argocd app sync myapp --force

When ArgoCD is broken:

## Apply previous working manifests directly
kubectl apply -f previous-working-config.yaml

## Or rollback deployment
kubectl rollout undo deployment/myapp

## Fix ArgoCD later

When everything is on fire:

## Nuclear option - delete and recreate
kubectl delete deployment myapp
kubectl apply -f last-known-good-config.yaml

Always keep a copy of your last working configuration outside of Git for emergencies.

What Happens When You Scale This Shit to Production

Once you get GitOps working for one application, you'll think "this is great, let's roll it out everywhere!" That's when the real pain begins.

Prometheus Dashboard

Multi-Cluster Reality Check

Managing multiple clusters sounds simple until you realize each cluster has its own:

The authentication nightmare: Each cluster needs separate credentials. SSO integration breaks during upgrades. You'll end up with a spreadsheet of cluster URLs, admin passwords, and "which one was production again?"

Network connectivity failures: Clusters can't talk to each other half the time. VPN connections drop. Firewall rules change. DNS resolution stops working between regions.

Cost explosion: Running ArgoCD + Prometheus on every cluster multiplies your infrastructure costs. Budget $200-500/month per cluster minimum.

The Enterprise Buzzword Reality

"Platform Engineering" means your team becomes a support desk for 50 development teams who all want different things and blame you when their deployments fail.

"Self-service" means developers will somehow find ways to break things you didn't think were possible to break, then demand you fix it immediately.

"Compliance" means you'll spend 60% of your time generating reports about deployment frequencies instead of actually improving the system.

When Monitoring Becomes the Problem

Prometheus federation is supposed to solve multi-cluster monitoring. In reality, it creates a dependency nightmare where if one cluster's Prometheus dies, your entire monitoring stack becomes unreliable.

Alert fatigue is real: You'll get 500 alerts per day about pods restarting, disks filling up, and certificates expiring. After month two, you'll ignore them all, including the one that matters.

Grafana dashboard hell: Everyone wants custom dashboards. You'll have 200 dashboards that nobody uses and 5 that actually matter but are impossible to find.

The cost problem: Monitoring costs more than the applications you're monitoring. Prometheus storage, Grafana Cloud subscriptions, and log aggregation will consume 30-40% of your infrastructure budget.

Security Theater and Actual Security

Policy as code sounds great until you realize writing OPA policies requires learning a new programming language (Rego) that makes LISP look intuitive.

Image scanning produces thousands of vulnerabilities, 90% of which are false positives or in dependencies you can't update without breaking everything.

Runtime security tools like Falco generate so many alerts that you'll either ignore them all or spend full-time investigating filesystem access patterns.

The actual security risks:

  • Developers will bypass all security policies when under deadline pressure
  • Service accounts with cluster-admin permissions because "it's easier"
  • Secrets stored in Git repositories despite all your warnings
  • SSH keys that never get rotated
  • Open ingress controllers with no authentication

Resource Management Nightmares

Kubernetes Resource Management

Cluster autoscaling works until traffic spikes hit, then nodes take 5 minutes to provision while your application returns 503 errors.

Resource requests and limits are either too low (causing OOMKills) or too high (wasting money). There's no middle ground.

Storage classes will bite you when you need to migrate data and discover your PVCs are locked to specific zones.

The Disaster Recovery Joke

Backup strategies work great until you try to restore from them and discover:

  • Velero backups are corrupted
  • Cross-region replication was never actually configured
  • Your disaster recovery cluster is three Kubernetes versions behind
  • The backup storage account credentials expired 6 months ago

Testing disaster recovery means breaking production to verify your backups work, which management will never approve.

The 2025 Reality Check

Platform engineering is now a recognized discipline, but that doesn't make it easier. The tools are more mature - ArgoCD ApplicationSets, Kubernetes Gateway API, Prometheus native histograms - but the fundamental complexity hasn't decreased.

What's actually improved:

  • Docker ARM64 support is finally stable
  • Kubernetes 1.30+ has better resource management
  • ArgoCD 2.12+ is less prone to Redis failures
  • Cloud provider managed services reduce operational burden

What's still broken:

  • YAML configuration hell (now with even more CRDs)
  • Resource limit guessing games
  • Multi-cluster authentication nightmares
  • Alert fatigue from monitoring everything

This is the reality of running GitOps at scale. It works, but requires a team of full-time engineers and a realistic understanding that everything will break in ways you never anticipated. Budget accordingly, hire people who enjoy debugging at 3am, and accept that your first production outage is a learning opportunity, not a failure.

Related Tools & Recommendations

integration
Similar content

Pulumi Kubernetes Helm GitOps Workflow: Production Integration Guide

Stop fighting with YAML hell and infrastructure drift - here's how to manage everything through Git without losing your sanity

Pulumi
/integration/pulumi-kubernetes-helm-gitops/complete-workflow-integration
100%
tool
Similar content

GitOps Overview: Principles, Benefits & Implementation Guide

Finally, a deployment method that doesn't require you to SSH into production servers at 3am to fix what some jackass manually changed

Argo CD
/tool/gitops/overview
75%
tool
Similar content

ArgoCD Production Troubleshooting: Debugging & Fixing Deployments

The real-world guide to debugging ArgoCD when your deployments are on fire and your pager won't stop buzzing

Argo CD
/tool/argocd/production-troubleshooting
61%
tool
Similar content

Debugging Istio Production Issues: The 3AM Survival Guide

When traffic disappears and your service mesh is the prime suspect

Istio
/tool/istio/debugging-production-issues
61%
tool
Similar content

ArgoCD - GitOps for Kubernetes That Actually Works

Continuous deployment tool that watches your Git repos and syncs changes to Kubernetes clusters, complete with a web UI you'll actually want to use

Argo CD
/tool/argocd/overview
59%
tool
Similar content

kubeadm - The Official Way to Bootstrap Kubernetes Clusters

Sets up Kubernetes clusters without the vendor bullshit

kubeadm
/tool/kubeadm/overview
57%
tool
Similar content

Flux Performance Troubleshooting - When GitOps Goes Wrong

Fix reconciliation failures, memory leaks, and scaling issues that break production deployments

Flux v2 (FluxCD)
/tool/flux/performance-troubleshooting
56%
integration
Similar content

gRPC Service Mesh Integration: Solve Load Balancing & Production Issues

What happens when your gRPC services meet service mesh reality

gRPC
/integration/microservices-grpc/service-mesh-integration
54%
tool
Similar content

Flux GitOps: Secure Kubernetes Deployments with CI/CD

GitOps controller that pulls from Git instead of having your build pipeline push to Kubernetes

FluxCD (Flux v2)
/tool/flux/overview
52%
integration
Similar content

Django Celery Redis Docker: Fix Broken Background Tasks & Scale Production

Master Django, Celery, Redis, and Docker for robust distributed task queues. Fix common issues, optimize Docker Compose, and deploy scalable background tasks in

Redis
/integration/redis-django-celery-docker/distributed-task-queue-architecture
50%
troubleshoot
Similar content

Debug Kubernetes AI GPU Failures: Pods Stuck Pending & OOM

Debugging workflows for when Kubernetes decides your AI workload doesn't deserve those GPUs. Based on 3am production incidents where everything was on fire.

Kubernetes
/troubleshoot/kubernetes-ai-workload-deployment-issues/ai-workload-gpu-resource-failures
50%
troubleshoot
Similar content

Fix Kubernetes Pod CrashLoopBackOff - Complete Troubleshooting Guide

Master Kubernetes CrashLoopBackOff. This complete guide explains what it means, diagnoses common causes, provides proven solutions, and offers advanced preventi

Kubernetes
/troubleshoot/kubernetes-pod-crashloopbackoff/crashloop-diagnosis-solutions
50%
tool
Similar content

containerd - The Container Runtime That Actually Just Works

The boring container runtime that Kubernetes uses instead of Docker (and you probably don't need to care about it)

containerd
/tool/containerd/overview
45%
tool
Similar content

LangChain Production Deployment Guide: What Actually Breaks

Learn how to deploy LangChain applications to production, covering common pitfalls, infrastructure, monitoring, security, API key management, and troubleshootin

LangChain
/tool/langchain/production-deployment-guide
45%
tool
Similar content

RHACS Enterprise Deployment: Securing Kubernetes at Scale

Real-world deployment guidance for when you need to secure 50+ clusters without going insane

Red Hat Advanced Cluster Security for Kubernetes
/tool/red-hat-advanced-cluster-security/enterprise-deployment
43%
troubleshoot
Similar content

Fix Docker Won't Start on Windows 11: Daemon Startup Issues

Stop the whale logo from spinning forever and actually get Docker working

Docker Desktop
/troubleshoot/docker-daemon-not-running-windows-11/daemon-startup-issues
41%
tool
Similar content

Rancher Desktop: The Free Docker Desktop Alternative That Works

Discover why Rancher Desktop is a powerful, free alternative to Docker Desktop. Learn its features, installation process, and solutions for common issues on mac

Rancher Desktop
/tool/rancher-desktop/overview
41%
tool
Similar content

Development Containers - Production Deployment Guide

Got dev containers working but now you're fucked trying to deploy to production?

Development Containers
/tool/development-containers/production-deployment
41%
tool
Similar content

KEDA - Kubernetes Event-driven Autoscaling: Overview & Deployment Guide

Explore KEDA (Kubernetes Event-driven Autoscaler), a CNCF project. Understand its purpose, why it's essential, and get practical insights into deploying KEDA ef

KEDA
/tool/keda/overview
41%
tool
Similar content

Docker Security Scanners: CI/CD Integration for Container Safety

Learn how to integrate Docker security scanners into your CI/CD pipeline to prevent container vulnerabilities. Discover best practices for effective container s

Docker Security Scanners (Category)
/tool/docker-security-scanners/overview
40%

Recommendations combine user behavior, content similarity, research intelligence, and SEO optimization