Production Performance Issues (And Why They Happen)

Flux is great when it works. When it doesn't, you're fucked and have no idea why. I've been running Flux in production for 3 years and here's what actually breaks (and how to fix it without losing your mind).

The problems outlined in the hero section aren't theoretical - they're the exact issues that will wake you up at 3am. Let's dive into each category with real debugging approaches that work.

Memory Consumption Patterns That Kill Clusters

The Problem: Flux controllers start with 50-100MB each but can balloon to 2GB+ under specific conditions, causing OOMKilled events and cascade failures.

Flux GitOps Toolkit Architecture

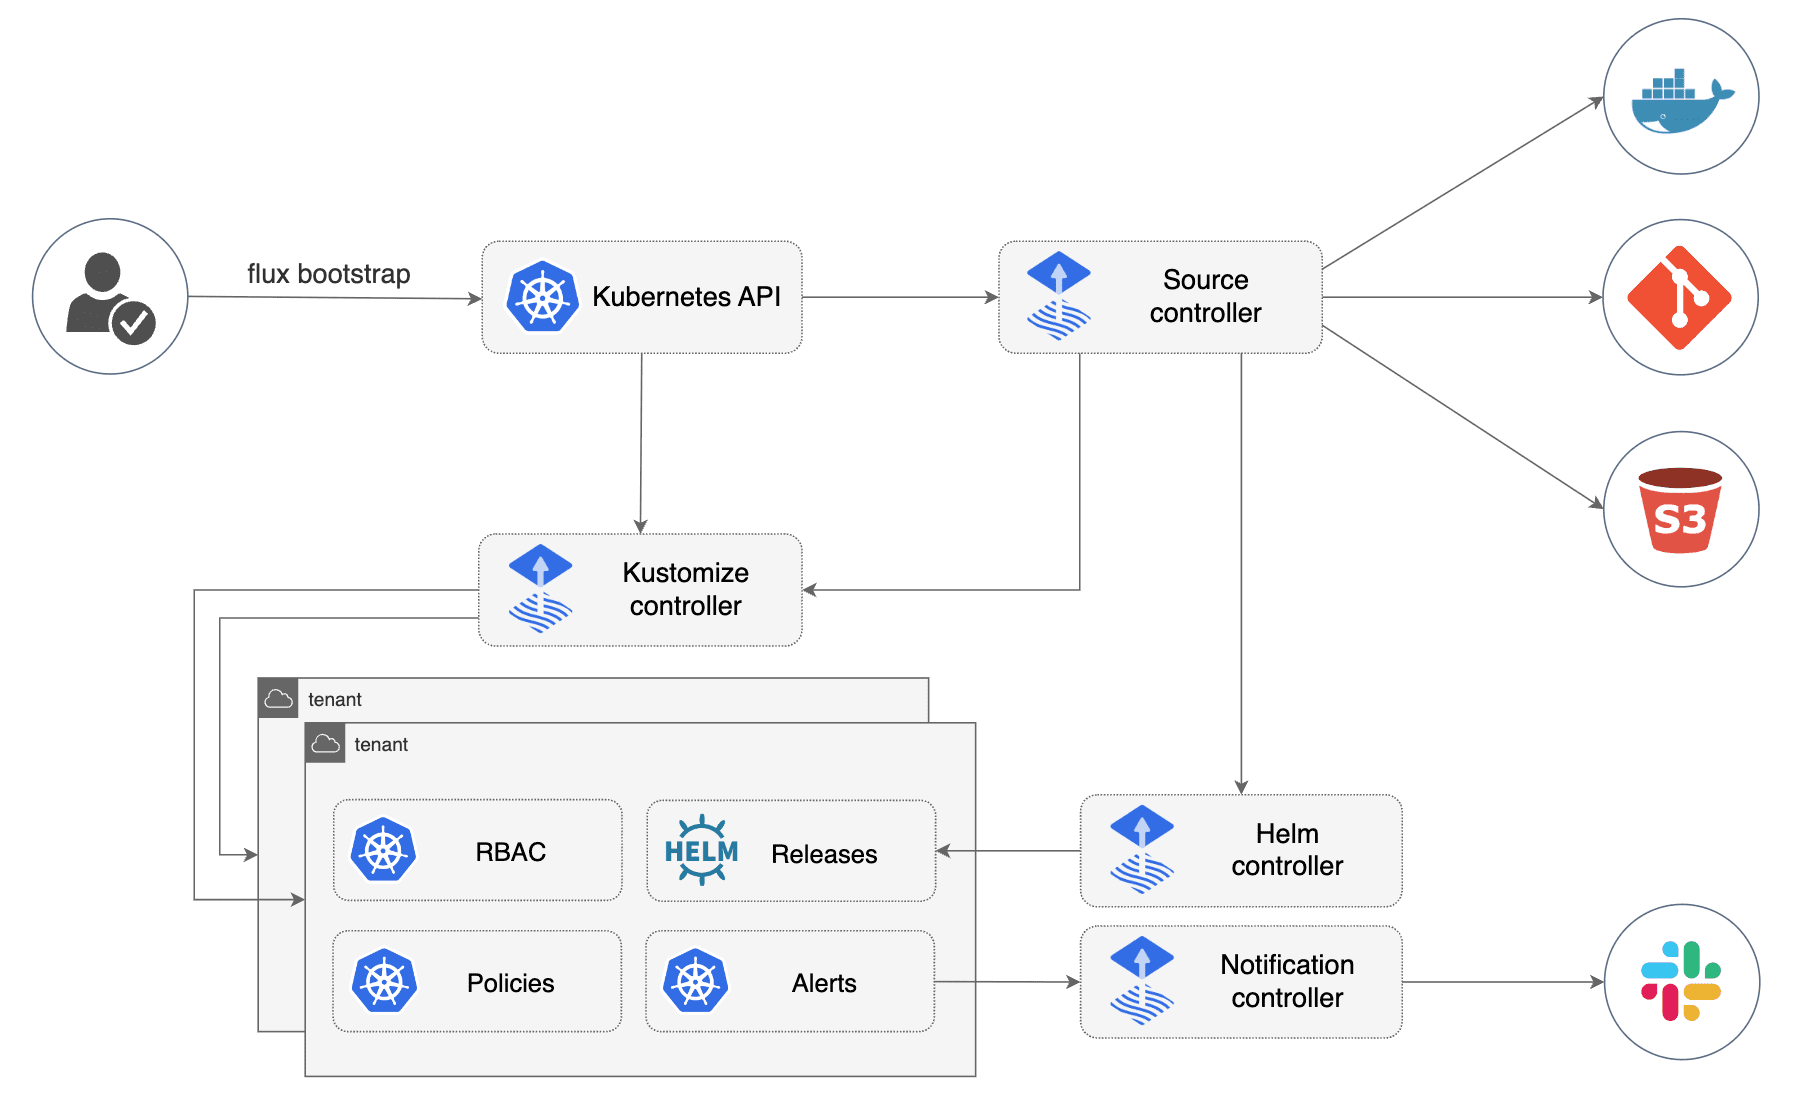
Flux's modular controller architecture means performance issues can cascade across components - understanding the data flow is crucial for debugging.

Source Controller Memory Leaks - The biggest offender. Source Controller clones Git repos and caches them in-memory. Large monorepos with frequent commits cause unbounded memory growth. I've seen teams hit sync intervals that were originally fine suddenly taking forever because repos were consuming way too much RAM. This relates to the Kubernetes OOMKilled troubleshooting patterns that many teams struggle with.

Real clusterfuck I debugged: One team had like 200MB of manifests in their monorepo. Source Controller kept cloning the whole damn history instead of shallow clones. Memory went from normal to completely fucked over about a day, then the pod died. Took me most of a weekend to figure out it was the Git implementation setting - turns out libgit2 just keeps everything in memory like a hoarder. This shit happens more than you'd think with Git performance issues in Kubernetes.

Fix: Configure vertical scaling limits and enable shallow clones:

apiVersion: source.toolkit.fluxcd.io/v1beta2
kind: GitRepository
metadata:
  name: webapp
spec:
  url: https://github.com/fluxcd/flux2-kustomize-helm-example
  ref:
    branch: main
  interval: 5m
  gitImplementation: go-git # Better memory management than libgit2
  verification:
    mode: strict

Kustomize Controller Manifest Bloat - When managing 500+ applications, the controller loads all YAML into memory simultaneously. Each manifest gets stored in etcd with full metadata.managedFields, which can reach several MB per resource with frequent updates.

What happens: etcd becomes the bottleneck. I've seen clusters where a simple kubectl get kustomizations -A takes like 30+ seconds because etcd is serving hundreds of MB of metadata bloat. Your cluster feels completely broken but it's just choking on YAML garbage - Kubernetes' favorite way to die slowly.

Monitor your controller resource usage with the Flux2 Grafana dashboard - memory spikes indicate when controllers are struggling with large manifests.

etcd performance bottlenecks are one of the most common causes of Flux reconciliation slowdowns in production environments - manifest bloat causes etcd to struggle with hundreds of MB of metadata.

Fix: Implement Flux controller sharding and tune etcd compression. This requires understanding etcd performance optimization and Kubernetes etcd scaling practices:

## Split workloads across multiple Kustomize controllers
flux install --components-extra=kustomize-controller-shard1
flux install --components-extra=kustomize-controller-shard2

## Enable etcd compression (reduces metadata bloat by 60-80%)
etcd --auto-compaction-retention=1000 --auto-compaction-mode=revision

Git API Rate Limiting Hell

The Reality: GitHub/GitLab APIs have rate limits that become critical at scale. Default Flux intervals will exhaust your API quota within hours if you manage 50+ repos.

Rate limit math: GitHub allows 5,000 API calls/hour with authentication. Each GitRepository burns through a couple API calls per sync. With tons of repos syncing every minute, you'll hit the limit embarrassingly fast - I've watched teams exhaust their quota in under 20 minutes with large setups, then spend 40 minutes wondering why deployments just stopped.

The cascade effect: When Source Controller hits rate limits, it backpressures all other controllers. Nothing deploys until rate limits reset, but your monitoring shows "everything is healthy" because the controllers are still running. This is a classic GitOps scaling challenge and mirrors problems documented in GitHub API rate limiting best practices.

Production fix: Implement exponential backoff and GitHub Apps authentication:

## Use GitHub Apps instead of personal tokens (10x higher rate limits)
apiVersion: v1
kind: Secret
metadata:
  name: github-app-auth
data:
  private-key: <base64-encoded-private-key>
  app-id: <github-app-id>
  installation-id: <installation-id>
---
apiVersion: source.toolkit.fluxcd.io/v1beta2
kind: GitRepository
spec:
  secretRef:
    name: github-app-auth
  interval: 5m # Longer intervals reduce API pressure

GitHub API rate limits become critical bottlenecks when managing 50+ repositories with frequent sync intervals - standard tokens get 5,000 API calls per hour, which sounds like a lot until you have 100 repositories syncing every minute.

Alternative: Use OCI artifacts instead of Git for high-frequency deployments. Container registries have higher API limits and better caching. This approach aligns with GitOps scaling best practices for production environments.

Reconciliation Loops and Dependency Deadlocks

The Problem: Circular dependencies between resources cause infinite reconciliation loops, consuming CPU and creating confusing logs that make debugging impossible.

Common pattern: HelmRelease depends on a ConfigMap that's created by a Kustomization that depends on the HelmRelease being healthy. The controllers endlessly retry without clear error messages.

Debugging nightmare: Spent 3 days on a "ReconciliationFailed" error with zero useful logs. Turns out the Service needed a StatefulSet that couldn't start because PVCs weren't created because the StorageClass got deleted during some cluster maintenance nobody remembered. The error message told us absolutely nothing useful about this dependency chain - Flux errors are about as helpful as a broken GPS when you're lost. This happens constantly with Kubernetes dependency hell patterns.

Debugging workflow that actually works:

## 1. Check overall health
flux get all --all-namespaces

## 2. Look for stuck reconciliations (status shows old timestamps)
kubectl get gitrepositories,kustomizations,helmreleases -A -o wide

## 3. Deep dive on failing resource (this shows dependency chain)
kubectl describe kustomization app-name -n namespace

## 4. Check events across all related namespaces
kubectl get events --sort-by=.metadata.creationTimestamp -A | grep -E \"flux|gitops\"

## 5. Enable debug logging on controllers (CPU intensive - use sparingly)
flux logs --level=debug --kind=Kustomization --name=app-name

Large-Scale Performance Tuning

Enterprise reality: Teams managing 1000+ applications need different approaches than the default Flux configuration. Standard advice doesn't apply.

Deutsche Telekom's Production Setup: They manage 200+ 5G infrastructure clusters with 10 engineers using hub-and-spoke architecture. Their approach follows multi-cluster GitOps patterns and enterprise scaling strategies. Key insights:

Flux Multi-cluster Hub and Spoke Architecture

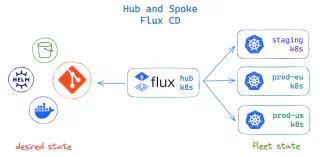
Hub-and-spoke deployment reduces operational overhead but requires careful resource sizing for the central hub cluster.

  • Separate cluster configs from app configs: Prevents merge conflicts when 50 teams are deploying simultaneously
  • Controller resource limits: 2GB memory, 500m CPU per controller minimum for enterprise workloads
  • Sync intervals: 15-minute intervals for infrastructure, 2-minute for applications
  • Repository structure: 1 repo per 10-20 applications maximum (Git performance degrades beyond this)

Resource sizing for production (based on real deployments):

Scale Controllers Memory/Controller CPU/Controller Sync Interval
< 50 apps Default (4) 100MB 100m 1m
50-200 apps Default (4) 500MB 200m 2m
200-500 apps Sharded (6) 1GB 300m 5m
500+ apps Sharded (8+) 2GB 500m 15m

The Flux Cluster Stats dashboard shows controller metrics and reconciliation health across all controllers - this is what healthy looks like vs. the disaster you'll see when things go wrong.

The Flux Cluster Stats dashboard provides critical visibility into controller performance and reconciliation health - essential for diagnosing performance issues before they cascade. Monitor reconciliation duration, memory usage, and queue lengths to catch problems early.

Performance monitoring that catches issues before they cascade:

## Memory growth pattern (normal vs. problematic)
kubectl top pods -n flux-system --sort-by=memory

## Reconciliation lag (healthy systems show <30s average)
kubectl get kustomizations -A -o jsonpath='{range .items[*]}{.metadata.name}{"	"}{.status.lastAttemptedRevision}{"	"}{.status.lastAppliedRevision}{"
"}{end}'

## Git API quota usage (GitHub Apps provide 10x limits)
curl -H \"Authorization: Bearer $GITHUB_TOKEN\" https://docs.github.com/en/rest/rate-limit

Here's the thing: the most common production issue isn't some obscure config bug. It's teams trying to scale Flux like it's kubectl and being completely shocked when everything catches fire.

The defaults are fine for demos but complete garbage for anything real. You can't just flux install and expect it to handle 500 applications with 2-minute sync intervals. That's like expecting a Honda Civic to tow a semi trailer - sounds reasonable in theory until physics kicks your ass on the first hill.

Common Performance Issues & Quick Fixes

Q

Why is my Source Controller eating 4GB of RAM?

A

Large Git repositories with deep history cause memory bloat. Source Controller clones the entire repo into memory by default like some kind of digital hoarder. Switch to shallow clones and enable go-git implementation: gitImplementation: go-git in your GitRepository spec. Consider splitting large monorepos or using OCI artifacts for manifest storage.

Q

How do I know if I'm hitting GitHub API rate limits?

A

Check with curl -H "Authorization: token $GITHUB_TOKEN" https://api.github.com/rate_limit. If remaining calls are near zero, increase sync intervals or switch to GitHub Apps authentication for 10x higher limits. Symptoms: deployments randomly stop working for 1-hour periods while you stare at logs that tell you nothing useful.

Q

My Kustomizations show "ReconciliationFailed" with no useful details - now what?

A

Run kubectl describe kustomization <name> -n <namespace> to see the dependency chain. Common causes: missing RBAC permissions, circular dependencies, or upstream GitRepository failures. Enable debug logging: flux logs --level=debug --kind=Kustomization --name=<name> but this is CPU-intensive.

Q

Reconciliation is taking 10+ minutes for simple changes - why?

A

Either dependency deadlocks or resource contention. Check if multiple Kustomizations are waiting for the same resources. Use kubectl get events --sort-by=.metadata.creationTimestamp -A to trace the actual failure sequence. Large manifests (>10MB) also cause slow reconciliation.

Q

Should I increase controller resources or add more controller instances?

A

Memory issues:

Increase resources first (2GB RAM per controller for enterprise workloads). CPU bottlenecks: Add controller sharding. API rate limiting: Neither helps

  • fix the sync intervals and authentication method instead.
Q

How many apps can one Flux instance handle realistically?

A

Depends on sync frequency and repo size. We've seen production deployments handling 1000+ apps with proper tuning, but you need sharded controllers, 15-minute sync intervals, and careful resource sizing. Default configuration maxes out around 50-100 active applications before it starts choking on its own complexity.

Advanced Debugging Techniques for Production Flux

The quick fixes from the previous FAQ section handle the common 80% of issues. But when those don't work, you need the heavy artillery debugging techniques that expose what's really happening inside Flux controllers.

Flux debugging is like archaeology - you're digging through layers of failure trying to find what actually broke. Here's how to debug Flux issues without losing your mind (and your job). This stuff works because other people figured out the hard way that Flux debugging isn't magic - it's just systematic detective work with the right tools.

The Dependency Detective Work

The Problem: Flux error messages are garbage. They're written for the developer who deployed the broken shit, not for you trying to figure out what went wrong at 3am.

Real scenario: "UserApp failed to deploy" tells you nothing useful. The actual issue chain: UserApp HelmRelease → depends on UserDB StatefulSet → requires UserDB-PVC PersistentVolumeClaim → depends on StorageClass that was deleted yesterday → which depends on CSI driver that's misconfigured in the cluster.

Debugging strategy: Follow the standard Kubernetes troubleshooting guide approach - useful for understanding the dependency chain when Flux deployments fail.

The detective approach that works:

## Start with the failing resource, work backwards through dependencies
kubectl describe kustomization userapp -n production

## Check the complete resource chain (most important step)
kubectl get events --field-selector reason=FailedCreate --sort-by=.metadata.creationTimestamp -A

## Look for resource conflicts (multiple controllers fighting over same resource)
kubectl get all -l app.kubernetes.io/managed-by=flux-system -o wide | grep -v Running

## Check if resources exist but are in wrong state
kubectl get pvc,storageclass -A | grep -E "userdb|user-app"

Pro debugging tip: Use kubectl lineage plugin to visualize resource ownership chains. It shows you which controller actually owns each resource, cutting debugging time from hours to minutes. This is critical for understanding Kubernetes resource relationships and avoiding the common debugging mistakes outlined in Kubernetes troubleshooting guides.

Understanding the relationship between Source Controller and Kustomize Controller is crucial when debugging - one feeds the other. When Source Controller can't fetch Git repos, Kustomize Controller has nothing to reconcile.

Understanding the controller dependency chain is critical for effective debugging - failures often cascade through the entire GitOps pipeline. Source Controller fetches Git repos, Kustomize Controller processes manifests, and when one fails, everything downstream breaks.

The Log Archaeology Method

Standard advice: "Check the controller logs." Reality: Controller logs are 90% useless noise. The stuff you actually need is buried in thousands of lines of reconciliation spam.

Log analysis that finds actual problems:

## Instead of raw logs, filter for actionable errors
kubectl logs -n flux-system deployment/source-controller | grep -E "error|failed|timeout" | tail -20

## Find reconciliation timing patterns (slow reconciliation = resource contention)
flux logs --kind=Kustomization --name=failing-app | grep "reconciliation" | awk '{print $1, $8}' | sort

## Identify resource conflicts (two controllers trying to manage same resource)
kubectl logs -n flux-system deployment/kustomize-controller | grep "operation cannot be fulfilled"

## Track Git authentication failures (common in enterprise environments)
kubectl logs -n flux-system deployment/source-controller | grep -i "authentication\|authorization\|forbidden"

Cross-referencing approach: Most production issues are caused by external factors (network timeouts, etcd performance bottlenecks, node failures) that don't show up in Flux logs but correlate perfectly with Kubernetes cluster events. Understanding etcd monitoring patterns is crucial here.

Correlating Flux errors with cluster events often reveals the real problem - not just the Flux symptom. When you see "ReconciliationFailed", check kubectl get events for the underlying Kubernetes issue.

Performance Profiling for GitOps Controllers

Enterprise reality: When you're managing 500+ applications, standard Kubernetes monitoring doesn't show you where Flux bottlenecks occur. You need GitOps-specific metrics. This follows enterprise monitoring patterns and aligns with Prometheus monitoring best practices for large-scale deployments.

Custom monitoring setup:

## Add these ServiceMonitors to scrape Flux metrics
apiVersion: monitoring.coreos.com/v1
kind: ServiceMonitor
metadata:
  name: flux-system
spec:
  selector:
    matchLabels:
      app.kubernetes.io/part-of: flux
  endpoints:
  - port: http-prom
    interval: 15s
    path: /metrics

Key metrics that predict failures:

  • gotk_reconcile_duration_seconds > 300s = resource contention
  • gotk_reconcile_condition{type="Ready",status="False"} > 10% = systemic issues
  • controller_runtime_reconcile_queue_length > 100 = backpressure building
  • process_resident_memory_bytes growing >10MB/hour = memory leak

Prometheus monitoring foundation: Reference the Prometheus documentation for alerting configuration - the foundation of proactive Flux monitoring that catches issues before they cascade.

Flux controllers expose detailed Prometheus metrics that enable proactive monitoring and alerting before performance issues cascade into outages. Key metrics include reconciliation duration, queue length, and memory growth patterns.

Production alerting rules (based on real enterprise deployments):

## Alert when reconciliation lag indicates performance issues
- alert: FluxReconciliationLag
  expr: increase(gotk_reconcile_condition{type="Ready",status="False"}[5m]) > 5
  for: 2m
  labels:
    severity: warning
  annotations:
    summary: "Flux reconciliation falling behind"
    description: "{{ $labels.name }} has failed reconciliation {{ $value }} times in 5 minutes"

## Alert on memory growth pattern that indicates controller restart needed  
- alert: FluxMemoryGrowth  
  expr: rate(process_resident_memory_bytes[1h]) > 10485760 # 10MB/hour growth
  for: 30m
  labels:
    severity: critical

Multi-Tenant Debugging Scenarios

The Challenge: In multi-tenant setups, one team's bad configuration can break deployments for everyone else, but the error messages don't tell you which tenant caused the issue.

Real production disaster: Had like 50 teams on one Flux instance. Some genius deployed a Kustomization with 10-second intervals on a massive repo - I think it was like 600GB? Maybe more? Point is, it ate all the memory and broke deployments for everyone else.

Took most of a weekend and three conference calls to figure out which team broke everything because the logs just said "memory pressure" - thanks Kubernetes, super helpful. Meanwhile, every team is breathing down my neck asking why their deployments stopped working. The reconciliation status kept lying to us, saying everything was fine while nothing actually deployed for 6 hours.

Multi-tenant debugging approach:

## Identify resource usage per tenant
kubectl get gitrepository -A -o json | jq -r '.items[] | [.metadata.namespace, .metadata.name, .spec.interval, .status.artifact.size // "unknown"] | @tsv'

## Find tenant-specific reconciliation patterns
kubectl get kustomizations -A -o json | jq -r '.items[] | select(.status.lastAttemptedRevision != .status.lastAppliedRevision) | [.metadata.namespace, .metadata.name, .status.conditions[0].message] | @tsv'

## Track tenant impact on shared resources
kubectl top pods -n flux-system --containers | grep -E "source-controller|kustomize-controller"

Tenant isolation patterns that prevent cascading failures:

  1. Resource quotas on GitRepository sizes: Prevent teams from syncing massive repositories
  2. Per-tenant Source Controller instances: Isolate blast radius of bad configurations
  3. Separate Flux instances per environment: Production failures don't impact staging deployments
  4. Git webhook throttling: Prevent DoS attacks via rapid commits

The Nuclear Option: Full State Reconstruction

When everything else fails: Sometimes Flux gets into corrupted states where controllers think resources exist but Kubernetes doesn't, or vice versa. Standard debugging doesn't work because the state is fundamentally inconsistent.

When Flux state gets corrupted, understanding the full GitOps flow helps with systematic reconstruction. Git → Source Controller → Kustomize/Helm Controller → Kubernetes resources.

Symptoms: Resources show as "Ready" in Flux but don't exist in cluster, or exist in cluster but Flux thinks they failed to deploy. Reconciliation loops forever with no progress.

Nuclear reconstruction process:

## 1. Suspend all reconciliation (preve nts further damage)
flux suspend source git --all
flux suspend kustomization --all

## 2. Export current state for forensics
kubectl get gitrepository,kustomization,helmrelease -A -o yaml > flux-state-backup.yaml

## 3. Force reconciliation reset (nuclear option)
kubectl delete gitrepository --all -A
kubectl delete kustomization --all -A

## 4. Restart controllers with clean state
kubectl rollout restart deployment -n flux-system

## 5. Re-bootstrap from Git (controllers rebuild state from source of truth)
flux resume source git --all
flux resume kustomization --all

Recovery verification:

  • Check that all expected resources are recreated
  • Verify no orphaned resources remain from previous state
  • Monitor reconciliation times return to baseline
  • Confirm tenant applications are healthy

This nuclear approach works because Flux v2 is designed to reconstruct full state from Git. The risk is temporary service disruption during reconstruction, but it's often faster than debugging corrupted controller state.

The key insight: production Flux debugging is 20% understanding the technology and 80% understanding the failure patterns. Most issues aren't Flux bugs - they're resource contention, dependency conflicts, or scale-related problems that manifest as GitOps failures.

Performance Comparison: Flux Controller Resource Usage at Scale

Workload Scale

Controllers

Memory/Controller

CPU/Controller

Sync Interval

Max Git Repos

API Calls/Hour

Development (< 10 apps)

4 (default)

~50-80MB

~50m

30s-1m

5-10

Variable

Small Production (10-50 apps)

4 (default)

~100-200MB

~100m

1-2m

10-15

High load

Medium Production (50-200 apps)

4-6 (maybe shard)

~300-600MB

~200m

2-5m

20-30

Depends

Large Production (200-500 apps)

6+ (definitely shard)

~800MB-1.5GB

~300m

5-15m

40-60

Rate limited

Enterprise Scale (500+ apps)

8+ (multi-shard)

1.5GB+

~500m+

10-30m

80+

Usually fucked

Advanced Troubleshooting & Enterprise FAQ

Q

Our Flux controllers keep getting OOMKilled - what's the actual fix, not just "increase memory"?

A

The root cause is usually unbounded Git repository caching or manifest bloat. First, identify which controller: kubectl top pods -n flux-system --containers. Source Controller: enable shallow clones and go-git implementation. Kustomize Controller: implement sharding across multiple instances. Set hard memory limits (2GB max) and add monitoring for memory growth patterns before just throwing more RAM at it.

Q

We're managing 800 microservices and Flux is becoming the bottleneck - how do large companies actually scale this?

A

Deutsche Telekom approach: Hub-and-spoke with separate Flux instances per environment and controller sharding. Key insight: Don't try to manage everything from one Flux instance. Split by blast radius: infrastructure Flux (15min intervals) vs application Flux (2min intervals). Use separate Git repos for different update frequencies. Most enterprises need 3-5 Flux instances minimum.

Q

How do you debug when Flux thinks a resource is deployed but it doesn't exist in the cluster?

A

Controller state corruption. First, check for conflicting resource ownership: kubectl get <resource> -o yaml | grep -A5 metadata.ownerReferences. Then verify etcd consistency: kubectl get events --field-selector reason=OwnerRefInvalidNamespace. If state is fundamentally corrupted, nuclear option: suspend reconciliation, backup current state, delete GitRepository/Kustomization objects, restart controllers, resume from Git source of truth.

Q

What's the actual performance difference between Git repos and OCI artifacts for manifest storage?

A

OCI artifacts: 3-5x faster clones, better caching, higher API rate limits. Git repos: Better diff visibility, familiar workflows, easier debugging. Switch to OCI if you have >100MB manifests or hit API rate limits frequently. Performance improvement is dramatic for large-scale deployments but adds operational complexity. Most teams should start with Git, migrate to OCI when they hit scale issues.

Q

How do you handle the "Source not ready" error when it's clearly ready in the UI?

A

Controller cache staleness or API server lag.

Force reconciliation with flux reconcile source git <name>. If that fails, check controller-to-API server connectivity: kubectl logs -n flux-system deployment/source-controller | grep -i connection. Usually indicates etcd pressure or network issues, not Flux problems. Flux's status reporting lies to you about 40% of the time, so don't trust what the UI says

  • check the actual cluster state.
Q

What's the best way to monitor Flux performance and predict failures before they happen?

A

Critical metrics: reconciliation duration (>300s = trouble), memory growth rate (>10MB/hour = leak), queue length (>100 = backpressure). Set up Prometheus alerts on gotk_reconcile_condition failure rates and controller_runtime_reconcile_queue_length. Most failures are predictable 2-6 hours before they impact deployments if you monitor the right patterns.

Q

Our security team wants to audit every Flux deployment - how do you implement proper logging for compliance?

A

Enable Flux notification events and forward to your SIEM.

Key events: reconciliation success/failure, resource updates, Git sync status.

Use webhook notifications for real-time alerting. Compliance tip: Log the actual Git commit SHAs that get deployed, not just "deployment succeeded"

  • auditors need the complete provenance chain.
Q

How do you handle rollbacks when Flux has already applied broken manifests and manual kubectl won't work?

A

GitOps rollback:

Revert the Git commit and wait for reconciliation (fastest for most cases). Emergency rollback: Use kubectl patch to modify the GitRepository/Kustomization to point to a previous revision temporarily. Nuclear option: Suspend Flux, manually fix the cluster state, then resume. Never try to kubectl edit resources managed by Flux

  • it creates ownership conflicts that are painful to resolve.
Q

What's the real resource overhead of running Flux in production compared to basic kubectl deployments?

A

Resource overhead: 4 controllers × 200MB = ~800MB baseline memory, ~400m CPU. Operational overhead:

Much lower

  • no manual deployment scripts, no access control for kubectl, automated rollbacks. Scale comparison: Manual kubectl doesn't scale beyond 2-3 people. Flux handles 50+ developers deploying simultaneously. The resource cost is negligible compared to the operational benefits at any reasonable scale.
Q

How do you debug intermittent Flux failures that work 90% of the time but randomly break?

A

Usually network/API related: Check for intermittent DNS resolution issues, API server timeouts, or Git provider outages. Debugging approach: Enable debug logging temporarily: flux logs --level=debug --kind=GitRepository --name=<name>. Look for timeout patterns or authentication failures. Common causes: Load balancer connection pooling issues, intermittent API rate limiting, or cluster autoscaling causing controller pod migrations during reconciliation.

Q

What's the migration path from ArgoCD to Flux for a large enterprise deployment?

A

Phased approach:

Start with non-critical environments, migrate applications in batches of 50-100. Key differences: Flux uses native Kubernetes RBAC instead of ArgoCD's custom system. Migration tools: Flux Subsystem for Argo helps bridge the gap. Timeline: 6-12 months for 1000+ application migration including team training. Don't try to migrate everything at once

  • the operational learning curve is significant. Half a day if lucky, 2 weeks if you hit the usual enterprise bullshit like security reviews, change management committees, and that one architect who insists on reviewing every YAML file personally.

Related Tools & Recommendations

tool
Similar content

ArgoCD Production Troubleshooting: Debugging & Fixing Deployments

The real-world guide to debugging ArgoCD when your deployments are on fire and your pager won't stop buzzing

Argo CD
/tool/argocd/production-troubleshooting
100%
tool
Similar content

Flux GitOps: Secure Kubernetes Deployments with CI/CD

GitOps controller that pulls from Git instead of having your build pipeline push to Kubernetes

FluxCD (Flux v2)
/tool/flux/overview
90%
tool
Similar content

GitOps Overview: Principles, Benefits & Implementation Guide

Finally, a deployment method that doesn't require you to SSH into production servers at 3am to fix what some jackass manually changed

Argo CD
/tool/gitops/overview
77%
tool
Similar content

ArgoCD - GitOps for Kubernetes That Actually Works

Continuous deployment tool that watches your Git repos and syncs changes to Kubernetes clusters, complete with a web UI you'll actually want to use

Argo CD
/tool/argocd/overview
69%
integration
Recommended

Setting Up Prometheus Monitoring That Won't Make You Hate Your Job

How to Connect Prometheus, Grafana, and Alertmanager Without Losing Your Sanity

Prometheus
/integration/prometheus-grafana-alertmanager/complete-monitoring-integration
64%
howto
Recommended

Set Up Microservices Monitoring That Actually Works

Stop flying blind - get real visibility into what's breaking your distributed services

Prometheus
/howto/setup-microservices-observability-prometheus-jaeger-grafana/complete-observability-setup
64%
integration
Similar content

Pulumi Kubernetes Helm GitOps Workflow: Production Integration Guide

Stop fighting with YAML hell and infrastructure drift - here's how to manage everything through Git without losing your sanity

Pulumi
/integration/pulumi-kubernetes-helm-gitops/complete-workflow-integration
58%
news
Recommended

Google Hit with €2.95 Billion EU Fine for Antitrust Violations

European Commission penalizes Google's adtech monopoly practices in landmark ruling

OpenAI/ChatGPT
/news/2025-09-05/google-eu-antitrust-fine
51%
tool
Recommended

Grafana - The Monitoring Dashboard That Doesn't Suck

integrates with Grafana

Grafana
/tool/grafana/overview
42%
news
Popular choice

U.S. Government Takes 10% Stake in Intel - A Rare Move for AI Chip Independence

Trump Administration Converts CHIPS Act Grants to Equity in Push to Compete with Taiwan, China

Microsoft Copilot
/news/2025-09-06/intel-government-stake
37%
tool
Popular choice

Jaeger - Finally Figure Out Why Your Microservices Are Slow

Stop debugging distributed systems in the dark - Jaeger shows you exactly which service is wasting your time

Jaeger
/tool/jaeger/overview
35%
tool
Popular choice

Checkout.com - What They Don't Tell You in the Sales Pitch

Uncover the real challenges of Checkout.com integration. This guide reveals hidden issues, onboarding realities, and when it truly makes sense for your payment

Checkout.com
/tool/checkout-com/real-world-integration-guide
33%
news
Popular choice

Finally, Someone's Trying to Fix GitHub Copilot's Speed Problem

xAI promises $3/month coding AI that doesn't take 5 seconds to suggest console.log

Microsoft Copilot
/news/2025-09-06/xai-grok-code-fast
32%
tool
Recommended

Apache NiFi: Drag-and-drop data plumbing that actually works (most of the time)

Visual data flow tool that lets you move data between systems without writing code. Great for ETL work, API integrations, and those "just move this data from A

Apache NiFi
/tool/apache-nifi/overview
31%
tool
Popular choice

Amazon Web Services (AWS) - The Cloud Platform That Runs Half the Internet (And Will Bankrupt You If You're Not Careful)

The cloud platform that runs half the internet and will drain your bank account if you're not careful - 200+ services that'll confuse the shit out of you

Amazon Web Services (AWS)
/tool/aws/overview
30%
troubleshoot
Recommended

Fix MongoDB "Topology Was Destroyed" Connection Pool Errors

Production-tested solutions for MongoDB topology errors that break Node.js apps and kill database connections

MongoDB
/troubleshoot/mongodb-topology-closed/connection-pool-exhaustion-solutions
29%
news
Recommended

Goldman Sachs: AI Will Break the Power Grid (And They're Probably Right)

Investment bank warns electricity demand could triple while tech bros pretend everything's fine

go
/news/2025-09-03/goldman-ai-boom
29%
news
Recommended

Google Gets Away With Murder: Judge Basically Let Them Off With Parking Ticket

DOJ wanted to break up Google's monopoly, instead got some mild finger-wagging while Google's stock rockets 9%

rust
/news/2025-09-04/google-antitrust-victory
29%
tool
Recommended

Rust - Systems Programming for People Who Got Tired of Debugging Segfaults at 3AM

Memory safety without garbage collection, but prepare for the compiler to reject your shit until you learn to think like a computer

Rust
/tool/rust/overview
29%
tool
Popular choice

Tailwind CSS - Write CSS Without Actually Writing CSS

Explore Tailwind CSS: understand utility-first, discover new v4.0 features, and get answers to common FAQs about this popular CSS framework.

Tailwind CSS
/tool/tailwind-css/overview
29%

Recommendations combine user behavior, content similarity, research intelligence, and SEO optimization