The Universal Istio Debugging Workflow (Copy This)

When shit breaks in production, you don't have time to read documentation. Here's the exact 5-step process I use to debug any Istio issue, whether it's traffic routing, security policies, or resource problems.

Step 1: Verify Istio Health (30 seconds)

First, check if the control plane is actually working:

## Quick health check - should show all components ready
istioctl proxy-status

## If any proxy shows NOT READY, you found your problem
kubectl get pods -n istio-system

If `istioctl proxy-status` shows sidecars as STALE or NOT READY, the control plane can't reach those proxies. This is usually networking or resource exhaustion.

Red flag: If istiod pods are crashlooping or show high memory usage (>4GB), your cluster is too big for your control plane resources. Scale up or you'll keep having problems.

Step 2: Check Your Configuration (90 seconds)

Most Istio problems are configuration fuckups. Run the analyzer on the specific namespace where you're seeing issues:

## Analyze configuration - shows YAML errors before they kill traffic
istioctl analyze -n production

## Check specific resources that commonly break
kubectl get virtualservices,destinationrules,peerauthentications -n production

The analyzer catches obvious errors like:

Pro tip: If you see `IST0101` or `IST0102` errors, fix those immediately - they mean your traffic routing is broken.

Step 3: Trace the Traffic Path (2 minutes)
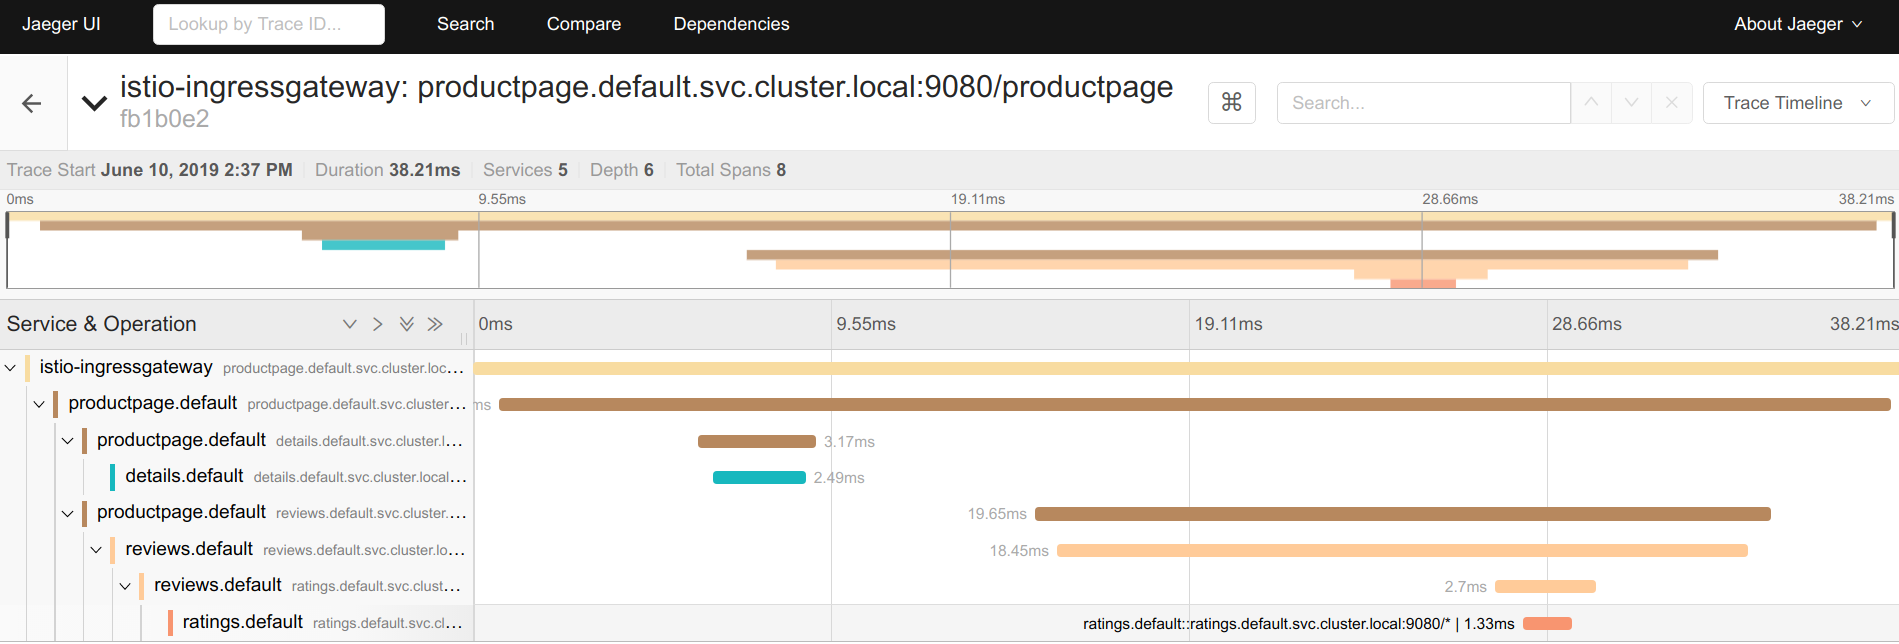
Istio Debugging Flow

Now verify that traffic is actually reaching the sidecars and following your routing rules:

## Pick a pod that's having issues
POD_NAME=$(kubectl get pods -l app=your-broken-service -o jsonpath='{.items[0].metadata.name}')

## Check if Envoy is receiving the right config
istioctl proxy-config cluster $POD_NAME | grep your-target-service
istioctl proxy-config routes $POD_NAME --name 8080

If `proxy-config cluster` doesn't show your target service, the sidecar doesn't know it exists. If `proxy-config routes` shows no routes or wrong routes, your VirtualService is broken.

Common gotcha: Routes are case-sensitive and exact-match by default. api/v1/users won't match api/v1/Users or /api/v1/users/.

Step 4: Check Sidecar Logs (1 minute)

When configuration looks correct but traffic still fails, check what Envoy is actually doing:

## Get sidecar logs - look for errors, not info messages
kubectl logs $POD_NAME -c istio-proxy --tail=50

## Enable debug logging if you need more detail (warning: verbose)
istioctl proxy-config log $POD_NAME --level debug

Key log patterns to watch for:

  • upstream connect error: Can't reach target service (networking issue)
  • no healthy upstream: Circuit breaker tripped or all endpoints down
  • stream closed: Usually a certificate or mTLS problem
  • no route matched: VirtualService routing rules don't match the request

Step 5: Test mTLS and Certificates (30 seconds)

Certificate issues are silent killers - traffic works until certs expire, then everything breaks:

## Check certificate validity
istioctl authn tls-check $POD_NAME your-target-service.production.svc.cluster.local

## If certificates are broken, check root CA status
kubectl get configmap istio-ca-root-cert -n istio-system -o yaml

tls-check should show OK for both client and server certificates. If you see PERMISSIVE when you expect STRICT, your mTLS policies aren't working.

Emergency fix: If certificates are expired and you can't rotate them quickly, temporarily switch to PERMISSIVE mode:

apiVersion: security.istio.io/v1beta1
kind: PeerAuthentication
metadata:
  name: emergency-permissive
  namespace: production
spec:
  mtls:
    mode: PERMISSIVE

When This Workflow Doesn't Work

If following these 5 steps doesn't identify the problem, you're dealing with one of the nasty edge cases:

  • Ambient mode issues: Different debugging tools and failure modes
  • Multi-cluster problems: Cross-cluster certificate or DNS issues
  • Resource exhaustion: Out of file descriptors, memory, or CPU
  • Network policy conflicts: CNI or firewall rules blocking sidecar traffic
  • Version incompatibilities: Mixed Istio versions or k8s API changes

These require specialized debugging techniques covered in the advanced troubleshooting section below.

"What The Hell Just Happened" Debugging FAQ

Q

My traffic completely disappeared after a config change

A

This happens when you typo YAML and Envoy can't parse your routing rules. Run istioctl analyze -n your-namespace immediately.

Most common causes:

  • Wrong service name in VirtualService (case-sensitive)
  • Indentation errors in YAML (spaces vs tabs)
  • Missing DestinationRule for the service you're routing to
  • Conflicting route rules (first one wins, rest are ignored)

Quick fix: Roll back your last change while you debug. Traffic > perfect config.

Q

Sidecars are using 2GB+ RAM and getting OOMKilled

A

Memory usage explodes when Istio pushes massive configurations to sidecars. This happens in large clusters or when you have poorly designed routing rules.

Immediate fixes:

## Check how much config each sidecar is getting
istioctl proxy-status | grep -E "(STALE|NOT READY)"

## Reduce config scope with Sidecar resources
kubectl apply -f - <<EOF
apiVersion: networking.istio.io/v1beta1
kind: Sidecar
metadata:
  name: default
  namespace: production
spec:
  egress:
  - hosts:
    - "./*"
    - "istio-system/*"
EOF

Long-term fix: Use Sidecar resources to limit configuration scope. A sidecar that only needs to talk to 5 services shouldn't get config for 500 services.

Q

Everything worked, then certificates expired and traffic died

A

Certificate rotation failed, probably because istiod couldn't reach some sidecars or the root CA had issues.

Emergency restore (gets traffic flowing in 60 seconds):

## Switch to permissive mTLS temporarily
kubectl apply -f - <<EOF
apiVersion: security.istio.io/v1beta1
kind: PeerAuthentication
metadata:
  name: emergency-permissive
  namespace: istio-system
spec:
  mtls:
    mode: PERMISSIVE
EOF

## Force certificate regeneration
kubectl delete secret cacerts -n istio-system
kubectl rollout restart deployment/istiod -n istio-system

Wait 2-3 minutes for certs to propagate, then switch back to STRICT mode.

Q

Requests randomly get 503 errors but services are healthy

A

Classic Envoy circuit breaker problem. The upstream service is fine, but Envoy thinks it's broken and stops sending traffic.

## Check circuit breaker status
istioctl proxy-config cluster $POD_NAME --fqdn your-service.namespace.svc.cluster.local -o json | grep -A5 -B5 "outlier_detection|circuit_breakers"

## Look for high outlier detection counts
kubectl logs $POD_NAME -c istio-proxy | grep "upstream_rq_retry|upstream_rq_pending_failure_eject"

Quick fix: Disable circuit breaking temporarily:

apiVersion: networking.istio.io/v1beta1
kind: DestinationRule
metadata:
  name: disable-circuit-breaker
spec:
  host: your-broken-service
  trafficPolicy:
    outlierDetection:
      consecutive5xxErrors: 50
      interval: 30s
      baseEjectionTime: 30s
Q

Ambient mode broke and I can't figure out why

A

Ambient mode debugging is different because there are no sidecar logs to check. The ztunnel handles L4 traffic, waypoint proxies handle L7.

## Check ztunnel status on the node where your pod is running
kubectl get pods -n istio-system -l app=ztunnel -o wide

## Check waypoint proxy if you're using L7 features
kubectl get pods -n your-namespace -l gateway.istio.io/managed=istio.io-waypoint

## Debug ztunnel logs on the specific node
NODE=$(kubectl get pod $YOUR_POD -o jsonpath='{.spec.nodeName}')
kubectl logs -n istio-system -l app=ztunnel --field-selector spec.nodeName=$NODE

Nuclear option: Switch back to sidecar mode if ambient is broken:

kubectl label namespace your-namespace istio.io/dataplane-mode=sidecar
kubectl rollout restart deployment -n your-namespace
Q

Multi-cluster traffic works sporadically

A

DNS resolution is probably broken between clusters, or certificates aren't syncing properly.

## Test cross-cluster DNS from inside a pod
kubectl exec -it $POD_NAME -c istio-proxy -- nslookup your-service.remote-cluster.local

## Check endpoint discovery between clusters
istioctl proxy-config endpoints $POD_NAME | grep remote-cluster

## Verify cross-cluster certificates
istioctl authn tls-check $POD_NAME your-service.remote-cluster.local

If DNS fails, your network setup is wrong. If endpoints are empty, service discovery isn't working. If TLS check fails, certificate distribution is broken between clusters.

Emergency workaround: Add ServiceEntry to manually register remote services:

apiVersion: networking.istio.io/v1beta1
kind: ServiceEntry
metadata:
  name: remote-service-manual
spec:
  hosts:
  - your-service.remote-cluster.local
  ports:
  - number: 80
    name: http
    protocol: HTTP
  location: MESH_EXTERNAL
  resolution: DNS
  endpoints:
  - address: 10.1.2.3  # Remote service IP

Advanced Debugging: When Basic Tools Aren't Enough

The 5-step workflow catches 80% of Istio problems. But when you're dealing with performance issues, resource exhaustion, or subtle configuration conflicts, you need heavier artillery. These techniques have saved my ass multiple times during 3AM production incidents.

Performance Debugging: When Latency Goes to Hell

Service mesh adds latency - that's inevitable. But when you're seeing 5+ second response times for simple API calls, something's wrong with your Istio configuration.

Step 1: Measure the actual overhead

## Get detailed timing from Envoy access logs
kubectl logs $POD_NAME -c istio-proxy | grep -E \"(response_time|duration)\" | tail -20

## Enable detailed access logging if not already on
istioctl install --set values.telemetry.v2.prometheus.service_monitor.enabled=true --set meshConfig.accessLogFile=/dev/stdout

Step 2: Identify the bottleneck

## Check if control plane is overwhelmed
kubectl top pods -n istio-system

## Look for config distribution delays
kubectl logs -n istio-system deployment/istiod | grep -E \"(push|ads.*slow)\"

If istiod is using >8GB RAM or >4 CPU cores, you're hitting control plane limits. Config pushes take forever with thousands of sidecars, and that directly impacts latency.

Real production fix: I've seen clusters where enabling pilot.env.EXTERNAL_ISTIOD and running istiod on dedicated nodes cut request latency by 60%. The control plane was CPU-bound and couldn't keep up with configuration updates.

Memory Profiling: Finding the Configuration Bloat

Sidecar memory usage is directly related to the amount of configuration Istio pushes. Here's how to identify what's bloating your sidecars:

## Get configuration size per sidecar
istioctl proxy-config cluster $POD_NAME -o json | jq '. | length'
istioctl proxy-config listeners $POD_NAME -o json | jq '. | length' 

## Check for configuration duplicates (common in large clusters)
istioctl proxy-config routes $POD_NAME -o json | jq '.[] | .virtualHosts | length'

Memory leak detection: Istio 1.20+ fixed most memory leaks, but some still exist:

## Monitor sidecar memory over time
kubectl top pod $POD_NAME --containers | grep istio-proxy

## Look for gradual increases over hours/days
kubectl get --raw \"/api/v1/nodes/$NODE_NAME/proxy/stats/prometheus\" | grep envoy_server_memory_allocated

If memory usage increases linearly over time (not in response to traffic), you have a leak. The fix is usually updating to the latest Istio version or enabling periodic sidecar restarts.

Certificate and Security Debugging Hell

mTLS certificate issues are the hardest to debug because they're often intermittent. Certificates work fine, then suddenly expire or become untrusted.

Deep certificate inspection:

## Get actual certificate details from Envoy
istioctl proxy-config secret $POD_NAME -o json | jq '.dynamicActiveSecrets[0].secret.tlsCertificate'

## Check certificate chain and expiry
kubectl exec $POD_NAME -c istio-proxy -- openssl s_client -connect your-service:443 -servername your-service -showcerts

Root cause analysis for mTLS failures:

## Check if certificate distribution is working
kubectl get secrets -n istio-system | grep cacerts

## Verify Pilot certificate settings
kubectl get configmap istio -n istio-system -o yaml | grep -A10 \"trustDomain\\|meshID\"

## Look for certificate rotation events
kubectl get events --field-selector involvedObject.kind=Secret | grep cacerts

Production war story: Lost a weekend to a bug where certificates worked fine within the cluster but failed for cross-cluster communication. The root CA was different between clusters, but istioctl didn't show it clearly. Fixed by manually comparing trustDomain settings and regenerating the root CA.

Network-Level Debugging: When Envoy Isn't the Problem

Sometimes the issue isn't Istio configuration - it's the underlying Kubernetes networking or CNI plugin interfering with sidecar traffic.

Packet-level debugging:

## Capture traffic between app and sidecar
kubectl exec $POD_NAME -c istio-proxy -- tcpdump -i lo -w /tmp/capture.pcap

## Check iptables rules (sidecar traffic interception)
kubectl exec $POD_NAME -c istio-proxy -- iptables -L -n -v | grep -E \"(15001|15006)\"

## Verify port binding and conflicts
kubectl exec $POD_NAME -c istio-proxy -- netstat -tulpn | grep LISTEN

Debugging init container failures: The istio-init container sets up traffic interception. If it fails, your sidecar won't see any traffic:

## Check init container logs
kubectl logs $POD_NAME -c istio-init

## Verify iptables rules were applied correctly
kubectl exec $POD_NAME -c istio-proxy -- iptables-save | grep -E \"(ISTIO|15001)\"

Red flag: If you see Failed to execute iptables-restore in init container logs, you have a permission or kernel module problem. The sidecar will start but won't intercept traffic.

Ambient Mode Advanced Debugging

Ambient mode introduces new failure points. Traffic flows through ztunnel (L4) and optionally waypoint proxies (L7), creating different debugging patterns.

Ztunnel debugging workflow:

## Find which ztunnel handles your pod
NODE=$(kubectl get pod $YOUR_POD -o jsonpath='{.spec.nodeName}')
ZTUNNEL_POD=$(kubectl get pods -n istio-system -l app=ztunnel --field-selector spec.nodeName=$NODE -o jsonpath='{.items[0].metadata.name}')

## Check ztunnel traffic interception
kubectl exec -n istio-system $ZTUNNEL_POD -- ss -tulpn | grep :15001

## Debug L4 policies and routing
kubectl logs -n istio-system $ZTUNNEL_POD | grep -E \"(policy|route)\" | tail -20

Waypoint proxy issues: If you're using L7 features (VirtualService, AuthorizationPolicy), traffic goes through waypoint proxies:

## Check waypoint proxy health
kubectl get pods -n your-namespace -l gateway.istio.io/managed=istio.io-waypoint

## Debug L7 routing in waypoint
WAYPOINT_POD=$(kubectl get pods -n your-namespace -l gateway.istio.io/managed=istio.io-waypoint -o jsonpath='{.items[0].metadata.name}')
istioctl proxy-config routes $WAYPOINT_POD

Common ambient gotcha: Traffic works fine for L4 (TCP connections) but breaks when you add L7 policies. This usually means the waypoint proxy isn't getting the right configuration or has resource limits.

Resource Exhaustion Patterns

Large Istio deployments hit resource limits in predictable ways. Here's how to identify and fix them before they kill your cluster:

Control plane resource patterns:

  • Memory: Grows linearly with service count (roughly 200MB per 1000 services)
  • CPU: Spikes during configuration pushes (can hit 100% during rolling deployments)
  • Network: High during startup and configuration changes

Data plane resource patterns:

  • Memory: Base 50MB + 1KB per route + 10KB per cluster
  • CPU: Usually low unless doing heavy L7 processing or mTLS
  • File descriptors: One per upstream connection (can hit kernel limits)
## Check for resource limit hits
kubectl describe pod $POD_NAME | grep -A5 -B5 \"Limits\\|OOMKilled\"

## Monitor file descriptor usage
kubectl exec $POD_NAME -c istio-proxy -- cat /proc/1/limits | grep \"Max open files\"
kubectl exec $POD_NAME -c istio-proxy -- lsof | wc -l

Production scaling fix: Above 1000 services, you need dedicated control plane nodes and careful resource tuning. I've seen clusters where splitting istiod across multiple replicas with workload-specific configurations solved memory and CPU issues that plagued the deployment for months.

Error Messages That Make You Want to Quit

Q

"UNAVAILABLE: upstream connect error or disconnect/reset before headers"

A

This is Envoy's way of saying "I can't reach the service you want." Usually means:

  1. Target service doesn't exist: Check kubectl get svc your-service
  2. Service has no healthy endpoints: Check kubectl get endpoints your-service
  3. Network policy blocking traffic: Check CNI or security policies
  4. Port mismatch: Your app listens on 3000, service targets port 8080

Debug commands:

## Verify service and endpoints
kubectl get svc,endpoints your-broken-service -o wide

## Test connectivity from sidecar (replace with your actual service name and port)
kubectl exec $POD_NAME -c istio-proxy -- curl -v http://\$SERVICE_NAME:8080/health

## Check if DNS resolution works
kubectl exec $POD_NAME -c istio-proxy -- nslookup your-service
Q

"PERMISSION_DENIED: RBAC: access denied"

A

AuthorizationPolicy is blocking your request. Istio's security policies are extremely picky about HTTP methods, paths, and headers.

## Check which policies apply to your service
kubectl get authorizationpolicies -A | grep -E "(your-service|default)"

## Enable RBAC debug logging (warning: verbose)
istioctl proxy-config log $POD_NAME --level "rbac:debug"

## Check actual request details vs policy
kubectl logs $POD_NAME -c istio-proxy | grep -E "(rbac|authz)" | tail -10

Quick fix: Add a temporary allow-all policy while you debug:

apiVersion: security.istio.io/v1beta1
kind: AuthorizationPolicy
metadata:
  name: debug-allow-all
  namespace: your-namespace
spec:
  selector:
    matchLabels:
      app: your-broken-service
  action: ALLOW
  rules:
  - {}
Q

"failed to fetch key from Kubernetes secret"

A

Certificate or JWT token validation failed. Usually happens during authentication setup or certificate rotation.

## Check if the secret exists and has correct format
kubectl get secret your-jwt-secret -o yaml

## Verify secret is mounted correctly in the pod
kubectl exec $POD_NAME -- ls -la /var/run/secrets/

## Check RequestAuthentication configuration
kubectl get requestauthentications -A -o yaml | grep -A10 -B5 "your-service"

Common cause: Secret created in wrong namespace or with wrong key names. JWKs secrets need jwks key, not token or key.

Q

"stream closed: TLS error"

A

mTLS negotiation failed. Either certificates are wrong, or there's a TLS mode mismatch between client and server.

## Check TLS configuration on both sides
istioctl authn tls-check $CLIENT_POD $TARGET_SERVICE

## Verify certificate validity
istioctl proxy-config secret $POD_NAME | grep -E "(ROOTCA|default)"

## Look for TLS handshake errors
kubectl logs $POD_NAME -c istio-proxy | grep -E "(tls|ssl|certificate)" | tail -10

Emergency fix: If certificates are broken beyond repair, switch to permissive mode temporarily:

apiVersion: security.istio.io/v1beta1
kind: PeerAuthentication
metadata:
  name: emergency-permissive
spec:
  mtls:
    mode: PERMISSIVE
Q

"Listener failed to bind to port 15001: Address already in use"

A

Something else is using Istio's traffic interception ports. Usually happens with:

  • Multiple service meshes (Linkerd + Istio)
  • CNI plugins that use the same ports
  • Previous sidecar containers that didn't clean up
## Check what's using port 15001
kubectl exec $POD_NAME -c istio-proxy -- netstat -tulpn | grep 15001

## Check if multiple sidecars are injected
kubectl get pod $POD_NAME -o yaml | grep -E "(istio-proxy|linkerd-proxy|consul-connect)"

## Look for port conflicts in sidecar config
istioctl proxy-config listeners $POD_NAME | grep -E "(15001|15006)"

Fix: Usually means you have multiple service meshes or a broken sidecar injection. Check your injection labels and policies.

Q

"no healthy upstream"

A

Circuit breaker tripped because Envoy thinks all upstream instances are failing. Could be real failures or overly aggressive circuit breaker settings.

## Check circuit breaker configuration
istioctl proxy-config cluster $POD_NAME --fqdn your-service.namespace.svc.cluster.local -o json | jq '.outlierDetection'

## Look for ejected upstream instances
kubectl exec $POD_NAME -c istio-proxy -- curl -s localhost:15000/clusters | grep your-service

## Check actual service health
kubectl get endpoints your-service -o yaml

Immediate fix: Reset circuit breaker by restarting the client sidecar:

kubectl delete pod $CLIENT_POD
Q

"JWT verification fails"

A

RequestAuthentication policy is rejecting tokens. Could be expired JWTs, wrong issuer, or invalid signatures.

## Check JWT configuration
kubectl get requestauthentications -A -o yaml | grep -A20 your-service

## Decode the JWT token (if you have it)
echo $JWT_TOKEN | cut -d'.' -f2 | base64 -d | jq '.'

## Check issuer and audience validation
kubectl logs $POD_NAME -c istio-proxy | grep -E "(jwt|token)" | tail -5

Debug tip: JWT errors are often silent in Envoy logs. Enable access logging to see the actual HTTP response codes:

istioctl install --set meshConfig.accessLogFile=/dev/stdout
Q

"gRPC config stream closed: 14, UNAVAILABLE: connection error"

A

Control plane connectivity issues. Sidecar can't reach istiod to get configuration updates.

## Check if istiod is reachable from the sidecar (replace with actual pod name)
kubectl exec $POD_NAME -c istio-proxy -- curl -v http://\$ISTIOD_SERVICE:15010/ready

## Verify control plane health
kubectl get pods -n istio-system | grep istiod

## Check for network policies blocking control plane traffic
kubectl logs $POD_NAME -c istio-proxy | grep -E "(ads|discovery)" | tail -10

Critical fix: If sidecars can't reach istiod, they'll keep running with stale config but won't get updates. Your traffic keeps working until you try to change something.

Q

"outlier detection: ejected"

A

Outlier detection decided your service is unhealthy and stopped sending traffic to it. Usually triggered by 5xx errors or slow response times.

## Check outlier detection settings
kubectl get destinationrule -A -o yaml | grep -A10 -B5 outlierDetection

## See which instances are ejected
kubectl exec $POD_NAME -c istio-proxy -- curl -s localhost:15000/clusters | grep "health_flags::failed_outlier_check"

## Check actual service metrics
kubectl logs your-service-pod | grep -E "(error|500|timeout)" | tail -10

Quick reset: Restart the service pods to clear the ejection state, then fix the underlying service issues.

Essential Debugging Resources (Bookmark These)

Related Tools & Recommendations

integration
Similar content

Istio to Linkerd Migration Guide: Escape Istio Hell Safely

Stop feeding the Istio monster - here's how to escape to Linkerd without destroying everything

Istio
/integration/istio-linkerd/migration-strategy
100%
integration
Similar content

gRPC Service Mesh Integration: Solve Load Balancing & Production Issues

What happens when your gRPC services meet service mesh reality

gRPC
/integration/microservices-grpc/service-mesh-integration
94%
tool
Similar content

Istio Service Mesh: Real-World Complexity, Benefits & Deployment

The most complex way to connect microservices, but it actually works (eventually)

Istio
/tool/istio/overview
93%
tool
Similar content

Debug Kubernetes Issues: The 3AM Production Survival Guide

When your pods are crashing, services aren't accessible, and your pager won't stop buzzing - here's how to actually fix it

Kubernetes
/tool/kubernetes/debugging-kubernetes-issues
88%
tool
Similar content

Service Mesh Troubleshooting Guide: Debugging & Fixing Errors

Production Debugging That Actually Works

/tool/servicemesh/troubleshooting-guide
85%
tool
Similar content

Grok Code Fast 1: Emergency Production Debugging Guide

Learn how to use Grok Code Fast 1 for emergency production debugging. This guide covers strategies, playbooks, and advanced patterns to resolve critical issues

XAI Coding Agent
/tool/xai-coding-agent/production-debugging-guide
68%
tool
Similar content

Debugging Windsurf: Fix Crashes, Memory Leaks & Errors

Practical guide for debugging crashes, memory leaks, and context confusion when Cascade stops working

Windsurf
/tool/windsurf/debugging-production-issues
65%
tool
Similar content

Trivy & Docker Security Scanner Failures: Debugging CI/CD Integration Issues

Troubleshoot common Docker security scanner failures like Trivy database timeouts or 'resource temporarily unavailable' errors in CI/CD. Learn to debug and fix

Docker Security Scanners (Category)
/tool/docker-security-scanners/troubleshooting-failures
61%
tool
Similar content

OpenAI Browser: Optimize Performance for Production Automation

Making This Thing Actually Usable in Production

OpenAI Browser
/tool/openai-browser/performance-optimization-guide
61%
tool
Recommended

Google Kubernetes Engine (GKE) - Google's Managed Kubernetes (That Actually Works Most of the Time)

Google runs your Kubernetes clusters so you don't wake up to etcd corruption at 3am. Costs way more than DIY but beats losing your weekend to cluster disasters.

Google Kubernetes Engine (GKE)
/tool/google-kubernetes-engine/overview
59%
integration
Recommended

Setting Up Prometheus Monitoring That Won't Make You Hate Your Job

How to Connect Prometheus, Grafana, and Alertmanager Without Losing Your Sanity

Prometheus
/integration/prometheus-grafana-alertmanager/complete-monitoring-integration
57%
tool
Similar content

Neon Production Troubleshooting Guide: Fix Database Errors

When your serverless PostgreSQL breaks at 2AM - fixes that actually work

Neon
/tool/neon/production-troubleshooting
56%
tool
Similar content

Helm Troubleshooting Guide: Fix Deployments & Debug Errors

The commands, tools, and nuclear options for when your Helm deployment is fucked and you need to debug template errors at 3am.

Helm
/tool/helm/troubleshooting-guide
56%
tool
Similar content

Arbitrum Production Debugging: Fix Gas & WASM Errors in Live Dapps

Real debugging for developers who've been burned by production failures

Arbitrum SDK
/tool/arbitrum-development-tools/production-debugging-guide
53%
tool
Similar content

React Production Debugging: Fix App Crashes & White Screens

Five ways React apps crash in production that'll make you question your life choices.

React
/tool/react/debugging-production-issues
51%
tool
Similar content

Django Troubleshooting Guide: Fix Production Errors & Debug

Stop Django apps from breaking and learn how to debug when they do

Django
/tool/django/troubleshooting-guide
51%
troubleshoot
Similar content

Fix Kubernetes CrashLoopBackOff Exit Code 1 Application Errors

Troubleshoot and fix Kubernetes CrashLoopBackOff with Exit Code 1 errors. Learn why your app works locally but fails in Kubernetes and discover effective debugg

Kubernetes
/troubleshoot/kubernetes-crashloopbackoff-exit-code-1/exit-code-1-application-errors
51%
tool
Similar content

Node.js Memory Leaks & Debugging: Stop App Crashes

Learn to identify and debug Node.js memory leaks, prevent 'heap out of memory' errors, and keep your applications stable. Explore common patterns, tools, and re

Node.js
/tool/node.js/debugging-memory-leaks
48%
tool
Similar content

TaxBit Enterprise Production Troubleshooting: Debug & Fix Issues

Real errors, working fixes, and why your monitoring needs to catch these before 3AM calls

TaxBit Enterprise
/tool/taxbit-enterprise/production-troubleshooting
48%
tool
Similar content

Cursor Background Agents & Bugbot Troubleshooting Guide

Troubleshoot common issues with Cursor Background Agents and Bugbot. Solve 'context too large' errors, fix GitHub integration problems, and optimize configurati

Cursor
/tool/cursor/agents-troubleshooting
48%

Recommendations combine user behavior, content similarity, research intelligence, and SEO optimization