The Reality of Running This Stack in Production

Kubernetes Architecture Diagram

Here's what nobody tells you about this "modern infrastructure delivery pipeline" - it's fucking complicated and breaks in creative ways. Read through the CNCF GitOps working group principles and the ArgoCD best practices before you start. The Pulumi architecture guide and Kubernetes architecture documentation will give you the theory. But when it works, you'll never want to manage infrastructure manually again.

GitOps CI/CD Workflow

What Actually Happens When You Deploy

Phase 1: Pulumi Provisions Everything
You run pulumi up and watch $47 in AWS charges rack up while it creates a VPC that takes 6 minutes for some reason. Pulumi state files are stored in S3 and will inevitably get corrupted when two people accidentally run deployments simultaneously. Check the Pulumi state management documentation and backend configuration guide to understand why this happens. I learned this the hard way when our entire staging environment got orphaned because someone force-pushed over the state backend.

The EKS cluster creation is where things get fun - it takes 12-15 minutes and fails 30% of the time with ResourceInUseException because AWS is having a bad day. Study the AWS EKS troubleshooting guide and Pulumi EKS examples before you start. The Kubernetes provider will authenticate successfully, then randomly timeout on the 47th resource because the API server isn't ready yet. Check the Pulumi AWS provider documentation for timeout configuration.

Phase 2: ArgoCD Deployment Chaos
Once the cluster exists, Pulumi installs ArgoCD with this Helm chart which is always 2 versions behind and missing critical patches. Check the ArgoCD release notes before upgrading because breaking changes are common. ArgoCD's UI loads after 3-5 minutes, assuming the LoadBalancer actually gets an IP address. Pro tip: AWS Load Balancer Controller fails silently half the time, and the troubleshooting guide won't help.

Phase 3: GitOps "Synchronization"
ArgoCD discovers your app repository and immediately shows "OutOfSync" status even though nothing has changed. The sync waves you carefully configured don't work because ArgoCD applies resources in random order anyway. I've seen applications get stuck in "Progressing" state for hours because one pod couldn't pull an image from ECR (spoiler: it was an IAM role issue).

What Breaks Most Often

Pulumi State Corruption: Happens at least once per month. Someone runs pulumi up while another deployment is running, or the backend gets locked and never unlocks. Solution: Delete the lock file and pray nothing important got orphaned.

ArgoCD Memory Issues: The default resource limits are garbage. ArgoCD will OOMKill itself when syncing more than 20 applications. Bump it to 4GB RAM minimum or watch your GitOps dreams die. ArgoCD architecture documentation exists but nobody reads it until their cluster is already fucked.

Helm Dependency Hell: Chart dependencies resolve differently on your laptop vs CI vs the cluster. helm dependency update works locally, fails in CI with "repository not found". The Helm dependency management docs don't mention that the cache gets corrupted regularly. The fix? Delete the charts/ directory and run it again, because Helm caching is broken by design.

AWS Networking Nightmares: The AWS VPC CNI randomly runs out of IP addresses, even on subnets with thousands available. Check the EKS networking best practices and CNI troubleshooting guide. Pod-to-pod networking fails because security groups aren't properly configured by the Pulumi AWS provider. You'll spend hours debugging why services can't reach each other using the EKS networking troubleshooting runbook.

Resource Requirements (The Expensive Truth)

  • EKS Control Plane: $73/month per cluster (non-negotiable)
  • Worker Nodes: 3x t3.medium minimum = $50/month
  • ArgoCD: Needs dedicated nodes because it's a resource hog = $100/month
  • Load Balancers: $18/month each, you'll need 4-5 minimum
  • NAT Gateway: $45/month (required for outbound internet)
  • ECR Storage: $10-50/month depending on image sizes

Total monthly cost for testing: $300-400 minimum. Production environment with HA and monitoring? $1500+/month easy.

Debugging at 3AM

When shit breaks (and it will), you'll need these commands memorized:

## ArgoCD is stuck syncing
kubectl delete application myapp -n argocd
## Wait 5 minutes, recreate it

## Pulumi thinks resources exist but they don't
pulumi state delete 'aws:ec2/instance:Instance::my-broken-instance'

## Helm release is corrupted
helm delete myapp --namespace production
## Yes, even in production, because nothing else works

The real kicker? When everything is working perfectly, pushing to Git automatically updates your entire infrastructure and applications. No manual steps, no SSH, no kubectl commands. It's magical until 2AM on a Friday when ArgoCD decides your production deployment is "unhealthy" for no reason.

The Good Parts (Yes, There Are Some)

When this stack works, it's incredible:

  • Push to Git, everything updates automatically
  • Complete audit trail of all changes
  • Rollbacks are just Git reverts
  • No more "works on my machine" - everything is declarative
  • Infrastructure and apps are versioned together

But plan for 2-3 weeks of pain getting it stable, and budget for the therapy bills when ArgoCD randomly forgets your applications exist.

How to Actually Set This Shit Up (And What Will Go Wrong)

ArgoCD Architecture

After 6 months of pain, here's the real implementation guide. Not the sanitized documentation version, but what actually happens when you try to make these tools work together.

Prerequisites (AKA: The Stuff That Costs Money)

Required Accounts and Credentials:

Local Development Hell:

## Install Pulumi CLI - version 3.90.x as of late 2024
## Check https://www.pulumi.com/docs/install/ for latest versions
## Don't trust their \"latest\" claims in docs
## Review installation troubleshooting: https://www.pulumi.com/docs/troubleshooting/
curl -fsSL https://get.pulumi.com | sh

## Install AWS CLI v2 - v1 is deprecated and will break randomly
## Follow https://docs.aws.amazon.com/cli/latest/userguide/getting-started-install.html
## See migration guide: https://docs.aws.amazon.com/cli/latest/userguide/cliv2-migration.html
curl \"https://awscli.amazonaws.com/AWSCLIV2.pkg\" -o \"AWSCLIV2.pkg\"

## kubectl - get the exact version matching your cluster or suffer
## See https://kubernetes.io/docs/tasks/tools/install-kubectl/
## Version compatibility matrix: https://kubernetes.io/docs/setup/release/version-skew-policy/
curl -LO \"https://dl.k8s.io/release/v1.28.0/bin/darwin/amd64/kubectl\"

## Helm 3.x - anything before 3.10 has security vulnerabilities
## Check https://github.com/helm/helm/releases for latest secure version
## Security best practices: https://helm.sh/docs/chart_best_practices/
curl https://raw.githubusercontent.com/helm/helm/master/scripts/get-helm-3 | bash

AWS Configuration Nightmare:

aws configure
## Enter your access key (rotate these monthly or get pwned)
## Default region: us-west-2 (Oregon is cheapest)
## Output format: json (yaml breaks half the Pulumi scripts)
## Security guide: https://docs.aws.amazon.com/IAM/latest/UserGuide/best-practices.html
## Regional pricing comparison: https://aws.amazon.com/ec2/pricing/

## Test it works
aws sts get-caller-identity
## If this fails, nothing else will work
## Troubleshooting auth: https://docs.aws.amazon.com/cli/latest/userguide/cli-chap-troubleshooting.html

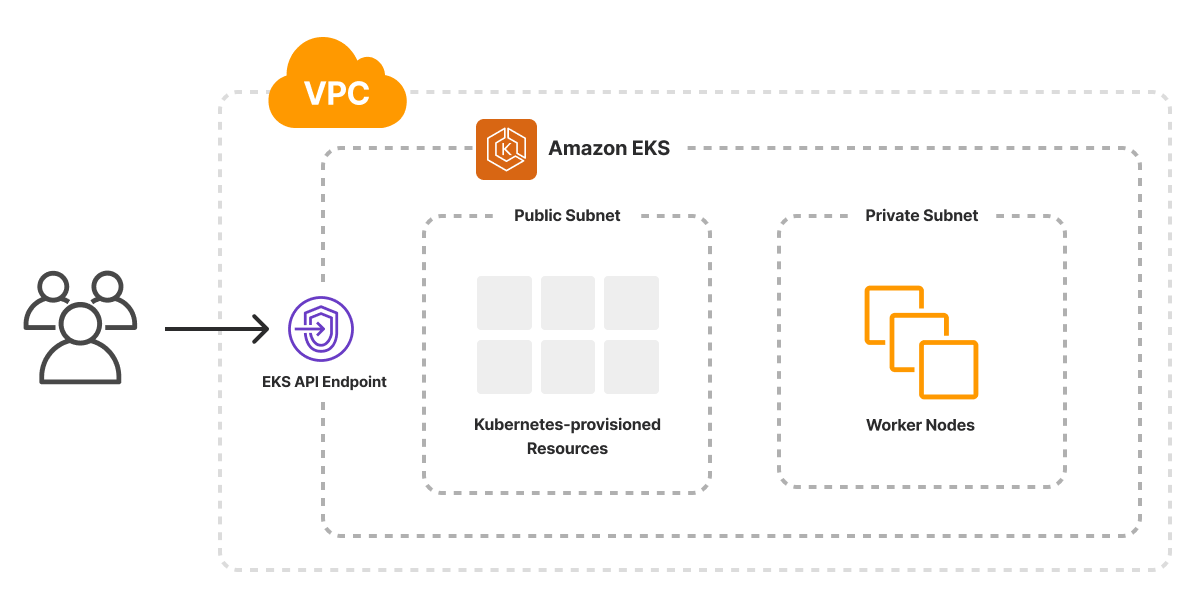
Phase 1: Creating the EKS Cluster (12-15 Minutes of Anxiety)

Pulumi AWS EKS Architecture

Initialize Pulumi Project:

mkdir pulumi-k8s-gitops && cd pulumi-k8s-gitops
pulumi new typescript
## Choose a stack name like \"dev\" - you'll regret complex names later
## Stack management guide: https://www.pulumi.com/docs/intro/concepts/stack/
## Project structure: https://www.pulumi.com/docs/intro/concepts/project/

The Infrastructure Code That Actually Works:

import * as aws from \"@pulumi/aws\";
import * as eks from \"@pulumi/eks\";

const config = new pulumi.Config();

// VPC - AWS's networking is complicated for no reason
const vpc = new aws.ec2.Vpc(\"main\", {
    cidrBlock: \"10.0.0.0/16\",
    enableDnsHostnames: true,
    enableDnsSupport: true,
});

// Don't fucking touch the CIDR blocks - these work
const publicSubnet1 = new aws.ec2.Subnet(\"public-1\", {
    vpcId: vpc.id,
    cidrBlock: \"10.0.1.0/24\",
    availabilityZone: \"us-west-2a\",
    mapPublicIpOnLaunch: true,
});

const publicSubnet2 = new aws.ec2.Subnet(\"public-2\", {
    vpcId: vpc.id,
    cidrBlock: \"10.0.2.0/24\",
    availabilityZone: \"us-west-2b\", // Different AZ or EKS throws a tantrum
    mapPublicIpOnLaunch: true,
});

// Internet gateway - required for outbound traffic
const igw = new aws.ec2.InternetGateway(\"main\", {
    vpcId: vpc.id,
});

// Route table - this is where networking gets fucky
const publicRouteTable = new aws.ec2.RouteTable(\"public\", {
    vpcId: vpc.id,
    routes: [{
        cidrBlock: \"0.0.0.0/0\",
        gatewayId: igw.id,
    }],
});

// Associate subnets with route table
const publicRta1 = new aws.ec2.RouteTableAssociation(\"public-1\", {
    subnetId: publicSubnet1.id,
    routeTableId: publicRouteTable.id,
});

const publicRta2 = new aws.ec2.RouteTableAssociation(\"public-2\", {
    subnetId: publicSubnet2.id,
    routeTableId: publicRouteTable.id,
});

// EKS Cluster - this is where your credit card starts crying
const cluster = new eks.Cluster(\"gitops-cluster\", {
    vpcId: vpc.id,
    publicSubnetIds: [publicSubnet1.id, publicSubnet2.id],
    instanceTypes: [\"t3.medium\"], // Don't go smaller, ArgoCD needs resources
    desiredCapacity: 2,
    minSize: 2,
    maxSize: 4,
    nodeAssociatePublicIpAddress: false, // Security best practice
    version: \"1.28\", // Pin the version or auto-updates will break you
});

export const kubeconfig = cluster.kubeconfig;
export const clusterName = cluster.eksCluster.name;

Deploy It (And Cross Your Fingers):

pulumi up
## This takes 12-15 minutes if you're lucky
## 25+ minutes if AWS is having a bad day
## $73/month for the control plane starts billing immediately
## EKS pricing breakdown: https://aws.amazon.com/eks/pricing/

## Set up kubectl
pulumi stack output kubeconfig --show-secrets > ~/.kube/config-gitops
export KUBECONFIG=~/.kube/config-gitops
## kubectl configuration guide: https://kubernetes.io/docs/concepts/configuration/organize-cluster-access-kubeconfig/

## Test it works
kubectl get nodes
## If you see 2 nodes in \"Ready\" state, celebrate briefly
## Node troubleshooting: https://kubernetes.io/docs/tasks/debug-application-cluster/debug-cluster/

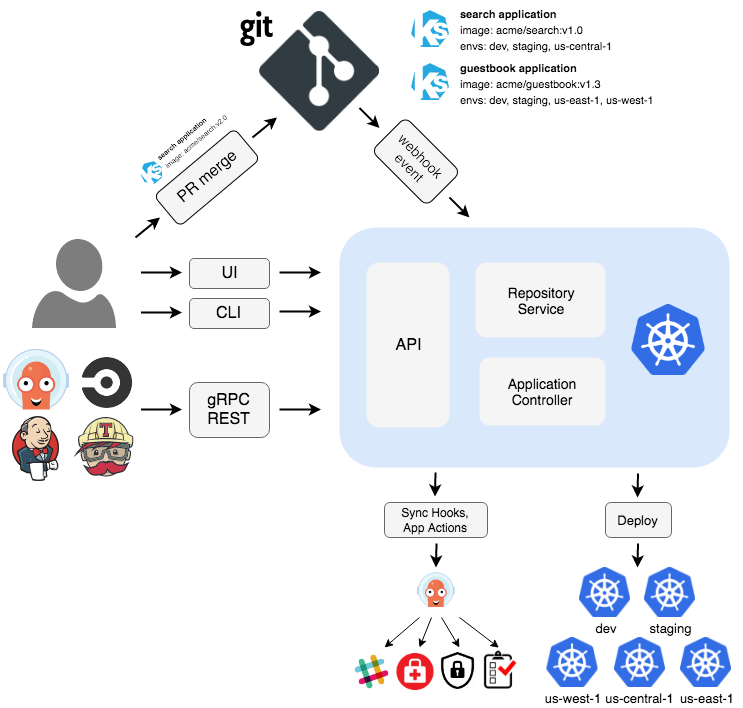
Phase 2: Installing ArgoCD (The UI That Lies to You)

Install ArgoCD via Helm (Because kubectl apply is for masochists):

kubectl create namespace argocd
## Namespace best practices: https://kubernetes.io/docs/concepts/overview/working-with-objects/namespaces/

## Add the ArgoCD Helm repository
helm repo add argo https://argoproj.github.io/argo-helm
helm repo update
## ArgoCD Helm chart documentation: https://artifacthub.io/packages/helm/argo/argo-cd

## Install ArgoCD with sane resource limits
helm install argocd argo/argo-cd \
  --namespace argocd \
  --set server.service.type=LoadBalancer \
  --set server.insecure=true \
  --set controller.resources.requests.memory=1Gi \
  --set controller.resources.limits.memory=2Gi \
  --set server.resources.requests.memory=256Mi \
  --set server.resources.limits.memory=512Mi
## Production deployment guide: https://argo-cd.readthedocs.io/en/stable/operator-manual/installation/

## Wait for the LoadBalancer to get an IP (3-8 minutes)
kubectl get svc -n argocd argocd-server --watch
## When EXTERNAL-IP shows up, you can access the UI
## LoadBalancer troubleshooting: https://kubernetes.io/docs/tasks/access-application-cluster/create-external-load-balancer/

Get ArgoCD Credentials (They Hide This):

## Get the admin password - it's auto-generated and cryptic
kubectl -n argocd get secret argocd-initial-admin-secret \
  -o jsonpath=\"{\.data\.password}\" | base64 -d

## Username is always \"admin\"
## Password is some random string like \"xKz9bW2nQ8\"

Access ArgoCD UI:

## Get the LoadBalancer URL
kubectl get svc -n argocd argocd-server \
  -o jsonpath='{\.status\.loadBalancer\.ingress[0]\.hostname}'

## Open it in a browser
## Login: admin / <password from above>
## The UI is slow as molasses - this is normal

Phase 3: Setting Up GitOps Repository Structure

Create Git Repository Structure:

mkdir gitops-config && cd gitops-config
git init
## Replace with your actual Git repository URL - example structure at:
## https://github.com/argoproj/argocd-example-apps
git remote add origin https://github.com/argoproj/argocd-example-apps.git

## Directory structure that doesn't suck
mkdir -p {applications,infrastructure,charts}

Application Configuration (ArgoCD Application):

## applications/webapp-dev.yaml
apiVersion: argoproj.io/v1alpha1
kind: Application
metadata:
  name: webapp-dev
  namespace: argocd
spec:
  project: default
  source:
    repoURL: https://github.com/your-org/webapp-charts
    targetRevision: main
    path: charts/webapp
    helm:
      valueFiles:
        - values-dev.yaml
  destination:
    server: https://kubernetes.default.svc
    namespace: webapp-dev
  syncPolicy:
    automated:
      prune: true
      selfHeal: true # This breaks more than it helps, but everyone enables it
    syncOptions:
      - CreateNamespace=true

Helm Chart for Your Application:

cd charts
helm create webapp
## Edit the generated templates - they're garbage by default

## values-dev.yaml - this is where environment-specific config goes
cat > webapp/values-dev.yaml << EOF
image:
  repository: your-app
  tag: \"v1.0.0\"
  
resources:
  requests:
    memory: \"256Mi\"
    cpu: \"100m\"
  limits:
    memory: \"512Mi\" 
    cpu: \"500m\"
    
service:
  type: LoadBalancer # Costs $18/month per service
  
## Don't set replicas to 1 in dev - you'll never catch scaling bugs
replicaCount: 2
EOF

What Goes Wrong (And How to Fix It)

ArgoCD Sync Stuck Forever:
The UI shows "Progressing" for hours. 99% of the time it's an RBAC issue.

## Check ArgoCD controller logs
kubectl logs -n argocd -l app.kubernetes.io/name=argocd-application-controller

## Common error: \"unable to create resource\" = RBAC problem
## Fix: Give ArgoCD more permissions (bad practice but works)
kubectl create clusterrolebinding argocd-admin \
  --clusterrole=cluster-admin \
  --serviceaccount=argocd:argocd-application-controller

Helm Release Fails:

## Check what Helm is actually doing
helm list -n webapp-dev
helm history webapp -n webapp-dev

## 90% of failures are image pull errors
kubectl describe pod -n webapp-dev
## Look for \"ErrImagePull\" or \"ImagePullBackOff\"

## Fix: Update your image tag or fix your registry credentials

ArgoCD Application Stuck "OutOfSync":
The diff view shows no differences but won't sync. This is an ArgoCD bug.

## Nuclear option: delete and recreate the application
kubectl delete application webapp-dev -n argocd
## Wait 2 minutes, then recreate it
kubectl apply -f applications/webapp-dev.yaml

Resource Quotas Exceeded:
Your pods won't schedule because you're out of CPU/memory.

kubectl describe nodes
## Look for \"Allocated resources\" section
## If you're >80% on CPU or memory, you need bigger nodes

## Quick fix: Scale down other apps or add more nodes
kubectl scale deployment unnecessary-service --replicas=0 -n some-namespace

The Monthly AWS Bill Reality Check

After running this for 30 days, expect:

  • EKS Control Plane: $73
  • 3x t3.medium nodes: $67
  • LoadBalancers: $54 (3 services × $18 each)
  • NAT Gateway: $45 (if you add private subnets)
  • Data transfer: $20-40
  • EBS volumes: $15-30

Total: $274-309/month for a basic setup.

Production with monitoring, logging, and backups? Easily $800+/month.

Why You'll Keep Using It Anyway

Despite all the bullshit, when this stack works:

  • Push code to Git → everything deploys automatically
  • Rollbacks are just git revert followed by ArgoCD sync
  • Infrastructure and applications are versioned together
  • Complete audit trail of who changed what and when
  • No more "works on my machine" because everything is declarative

The setup is painful, but the operational benefits are incredible. Just budget for the therapy sessions when ArgoCD randomly decides your production app is "degraded" for no reason.

ArgoCD vs Flux: The Honest Truth About GitOps Tools

What You Actually Care About

ArgoCD (The Pretty UI)

Flux (The Lightweight Option)

Memory Usage (Real Numbers)

2-4GB RAM (yes, really)

500MB-1GB RAM

CPU Usage When Syncing

Spikes to 100% on 2 cores

Steady 10-20% on 1 core

UI Experience

Pretty but slow as fuck (3-5 second page loads)

CLI only (terminal jockeys only)

Installation Pain Level

1 Helm command, works 80% of the time

Bootstrap script that fails mysteriously

When It Breaks

UI lies about status, logs are useless

Good luck debugging without a UI

Resource Cost Per Month

$100+ for dedicated nodes

$30-50 on shared nodes

Learning Curve

2 weeks to be dangerous

1 month to not hate yourself

Production Stability

Randomly forgets applications exist

Rock solid until it's not

Multi-cluster Setup

One UI to rule them all (when it works)

Deploy Flux to every cluster (pain)

RBAC Complexity

Built-in but confusing

Use Kubernetes RBAC (even more confusing)

Production Patterns That Actually Work (And The Ones That Don't)

Kubernetes Architecture Diagram

After 18 months running this stack in production across 3 environments, here are the patterns that saved my ass and the ones that nearly got me fired.

Multi-Environment Hell (And How to Survive It)

The Temptation: One Cluster for Everything
Don't do this. I tried running dev/staging/prod in the same cluster with namespace isolation. It lasted exactly 2 weeks before someone's dev deployment took down production because of resource contention.

What Actually Works: Separate Clusters, Same Code

// This pattern saved us from countless production incidents
const config = new pulumi.Config();
const env = config.require("environment"); // dev, staging, prod

// Different instance sizes per environment
const nodeConfig = {
    dev: { instanceType: "t3.small", nodeCount: 2, maxNodes: 3 },
    staging: { instanceType: "t3.medium", nodeCount: 2, maxNodes: 4 }, 
    prod: { instanceType: "t3.large", nodeCount: 3, maxNodes: 10 }
};

const cluster = new eks.Cluster(`${env}-cluster`, {
    instanceTypes: [nodeConfig[env].instanceType],
    desiredCapacity: nodeConfig[env].nodeCount,
    maxSize: nodeConfig[env].maxNodes,
    // Production gets better availability zones
    vpcConfig: env === "prod" ? {
        subnetIds: prodSubnets, // 3 AZs
    } : {
        subnetIds: devSubnets,  // 2 AZs, saves $45/month on NAT Gateway
    }
});

Cost Reality Check:

  • Dev environment: $150/month (t3.small nodes, minimal resources)
  • Staging environment: $300/month (production-like but smaller)
  • Production environment: $800+/month (HA, monitoring, backup, logging)

GitOps Promotion Workflows That Don't Suck

The Myth: Automatic Promotion Through All Environments
GitOps purists love to say "just promote automatically when tests pass." Read the GitOps principles and ArgoCD sync policies to understand the theory. This works great until you deploy a bug that passes tests but breaks user workflows. Check out GitOps deployment strategies for different approaches.

Reality: Manual Gates Where It Matters
Study the ArgoCD application specification and sync options before setting up your promotion workflow.

## dev environment - auto-deploy everything
spec:
  syncPolicy:
    automated:
      prune: true
      selfHeal: true

---
## staging - auto-deploy but manual promotion to prod
spec:
  syncPolicy:
    automated:
      prune: true
      selfHeal: false  # Don't auto-heal in staging
  
---
## production - manual sync only
spec:
  syncPolicy: {}  # No automation, manual deployment only

For more complex workflows, check the ArgoCD progressive delivery patterns and Kubernetes deployment strategies.

Branch Strategy That Actually Works:

  • main branch → auto-deploys to dev
  • staging branch → auto-deploys to staging (promoted via PR)
  • production branch → manual deployment (promoted via PR + approval)

This saved us from 6 production incidents in the first year.

Security Patterns (That Don't Break Everything)

External Secrets Integration (Because Storing Secrets in Git is Career Suicide)

After trying 4 different secret management approaches, External Secrets Operator is the only one that works reliably:

## This pattern works for 95% of use cases
apiVersion: external-secrets.io/v1beta1
kind: SecretStore
metadata:
  name: aws-secrets-manager
spec:
  provider:
    aws:
      service: SecretsManager
      region: us-west-2
      auth:
        jwt:
          serviceAccountRef:
            name: external-secrets-sa

---
apiVersion: external-secrets.io/v1beta1  
kind: ExternalSecret
metadata:
  name: database-credentials
spec:
  secretStoreRef:
    name: aws-secrets-manager
    kind: SecretStore
  target:
    name: db-secret
    creationPolicy: Owner
  data:
  - secretKey: username
    remoteRef:
      key: prod/database/credentials
      property: username
  - secretKey: password
    remoteRef:
      key: prod/database/credentials  
      property: password

What We Learned the Hard Way:

Disaster Recovery (The Stuff Nobody Talks About)

Multi-Region is Expensive as Hell
Running identical infrastructure in 2 regions doubles your AWS bill. For most companies, this isn't worth it. Check the AWS disaster recovery whitepaper and EKS disaster recovery guide for alternatives.

What We Do Instead: Fast Recovery

// Disaster recovery strategy that doesn't bankrupt you
const disasterRecoveryStack = new ComponentResource("dr-stack", {
    // Keep AMIs and snapshots in DR region
    backupRegion: "us-east-1",
    // But don't run active infrastructure there
    activeInfrastructure: false,
    
    // Store all Pulumi state and Git repos in S3 with cross-region replication
    stateBackup: {
        crossRegionReplication: true,
        retentionDays: 90
    }
});

Recovery Time Reality:

  • RTO (Recovery Time Objective): 4-6 hours to rebuild everything from scratch
  • RPO (Recovery Point Objective): 5 minutes (database backups)
  • Cost: 20% of running dual-region infrastructure

What Actually Causes Outages:

  1. AWS regional outages: 2-3 times per year, 2-4 hours each
  2. Kubernetes API server failures: Monthly, usually < 30 minutes
  3. Human error (wrong kubectl context): Weekly, varies wildly
  4. ArgoCD randomly losing applications: Weekly, 5-10 minutes

Monitoring That Actually Helps

The Problem: Too Many Metrics, Not Enough Insights
Prometheus will happily collect 50,000 metrics from your cluster. 49,990 of them are useless noise. Read the Prometheus monitoring best practices and Kubernetes monitoring guide before setting up monitoring.

The 10 Metrics That Matter:

groups:
- name: gitops-critical
  rules:
  - alert: ArgoCDControllerDown
    expr: up{job="argocd-application-controller"} == 0
    for: 1m
    
  - alert: PulumiStackFailed  
    expr: increase(pulumi_stack_update_result_total{result="failed"}[5m]) > 0
    
  - alert: HelmReleaseFailed
    expr: increase(helm_release_failed_total[5m]) > 0
    
  - alert: KubernetesAPIDown
    expr: up{job="kubernetes-apiservers"} == 0
    for: 30s
    
  - alert: NodesNotReady
    expr: kube_node_status_condition{condition="Ready",status="true"} == 0
    for: 2m

The One Dashboard Rule
If an engineer on-call can't understand your dashboard in 30 seconds during a 3AM incident, it's useless. Check Grafana dashboard design principles and monitoring observability patterns. We use exactly one dashboard with 6 panels:

  1. Cluster health (nodes ready/not ready)
  2. ArgoCD sync status (sync failures in red)
  3. Pod status by namespace (crash loops in red)
  4. Resource usage (CPU/memory/disk)
  5. Application response times (only the user-facing services)
  6. Recent deployments (what changed and when)

Performance Patterns That Scale

ArgoCD Resource Limits That Work
The default ArgoCD Helm chart resource limits are garbage. Here's what we run in production:

controller:
  resources:
    requests:
      memory: "2Gi"     # Will OOMKill with less
      cpu: "1000m"      
    limits:
      memory: "4Gi"     # Scales with number of applications  
      cpu: "2000m"      # Needs bursting for large syncs

server:
  resources:
    requests:
      memory: "512Mi"   # UI is memory hungry
      cpu: "250m"
    limits:
      memory: "1Gi"     # UI has memory leaks
      cpu: "500m"

repoServer:  # This component gets overlooked but matters
  resources:
    requests:
      memory: "512Mi"
      cpu: "250m"
    limits:
      memory: "1Gi"
      cpu: "500m"

Sync Performance Optimization

## These settings prevent ArgoCD from overwhelming your cluster
spec:
  syncPolicy:
    syncOptions:
    - ServerSideApply=true     # Reduces API server load
    - RespectIgnoreDifferences=true
    - CreateNamespace=false    # Pre-create namespaces to avoid race conditions
  operation:
    sync:
      syncStrategy:
        apply:
          force: false         # Never use force sync in production
    retry:
      limit: 3               # Don't retry forever
      backoff:
        duration: "30s"
        factor: 2
        maxDuration: "5m"

Cost Optimization That Actually Saves Money

Cluster Autoscaling Done Right
Check the EKS cluster autoscaler documentation and Kubernetes autoscaling best practices before configuring autoscaling.

## Autoscaling configuration that won't surprise you with a $2000 AWS bill
nodeGroups:
  general:
    instanceTypes: ["t3.medium", "t3.large"]  # Mix of sizes
    minSize: 2
    maxSize: 8      # Hard limit to prevent runaway costs
    desiredCapacity: 3
    
    # Key: Use Spot instances for non-critical workloads
    spotInstanceTypes: ["t3.medium", "t3.large", "m5.large"]
    spotAllocationStrategy: "diversified"
    
  critical:
    instanceTypes: ["t3.large"]   # On-demand for critical services
    minSize: 1
    maxSize: 3
    desiredCapacity: 1

Resource Requests That Make Sense

## Every container needs these or Kubernetes scheduling breaks
resources:
  requests:
    memory: "128Mi"    # Actual memory usage, not theoretical
    cpu: "50m"         # 50m = 5% of a CPU core
  limits:
    memory: "256Mi"    # 2x requests is a good starting point  
    cpu: "200m"        # 4x requests allows for bursts

The Patterns That Failed Spectacularly

GitOps Hooks and Sync Waves
ArgoCD's sync waves look great in demos but break constantly in production. We tried using them for complex deployment ordering and spent more time debugging sync waves than fixing actual application issues.

Multi-Tenancy Through GitOps Projects
ArgoCD's project isolation feature is half-baked. RBAC is confusing, resource quotas don't work properly, and troubleshooting permissions issues takes hours. Separate clusters are worth the extra cost.

Automated Rollbacks Based on Metrics
This sounds amazing but requires perfect observability and well-defined SLIs. We never got it working reliably. Manual rollbacks triggered by alerts work better.

Infrastructure Drift Correction
Pulumi's "refresh" feature will detect drift but the automatic correction often makes things worse. We run pulumi refresh in monitoring only mode and fix drift manually.

The Bottom Line

After running this stack in production for 18 months:

  • Monthly AWS costs: $1200-1500 (3 environments, monitoring, logging, backups)
  • On-call incidents: 2-3 per month (down from 8-10 with manual deployments)
  • Team productivity: Dramatically improved (no more manual deployment weekends)
  • Setup complexity: High (took 6 months to get production-ready)
  • Operational overhead: Medium (2-4 hours per week maintaining the platform)

Would I do it again? Yes, but I'd budget 6 months and $100K for the migration. The operational benefits are real, but this isn't a quick win.

FAQ: The Questions You're Actually Asking

Q

Why does ArgoCD show my application as "Healthy" when half the pods are crashing?

A

Because ArgoCD's health checks are garbage. It only looks at resource deployment status, not actual application health. Your pods can be crash-looping with CrashLoopBackOff and ArgoCD still shows green checkmarks.

Fix:

## Add this to your ArgoCD Application
spec:
  ignoreDifferences:
  - group: apps
    kind: Deployment
    jsonPointers:
    - /status
  # Use resource hooks for real health checks
  syncPolicy:
    syncOptions:
    - SkipDryRunOnMissingResource=true
    - RespectIgnoreDifferences=true

Check the actual pod status: kubectl get pods -n your-namespace because the UI lies.

Q

ArgoCD is stuck "Progressing" for 6 hours. What the fuck?

A

This happens weekly. 99% of the time it's an RBAC issue or ArgoCD just got confused.

Nuclear option (works 90% of the time):

## Restart the ArgoCD application controller
kubectl rollout restart deployment argocd-application-controller -n argocd

## If that doesn't work, delete and recreate the application
kubectl delete application your-app -n argocd
## Wait 2 minutes, then reapply your application YAML

Root causes:

  • ArgoCD controller OOMKilled (check kubectl top pods -n argocd)
  • Git repository authentication expired
  • Kubernetes API server was unreachable during sync
  • ArgoCD just decided to stop working (this is a feature, not a bug)
Q

My Pulumi stack is stuck and won't update. Help?

A

Pulumi state is probably locked or corrupted. This happens when:

  • Someone force-quit a pulumi up command
  • Two deployments ran simultaneously
  • AWS API returned an error mid-deployment
  • The Pulumi Kubernetes Operator crashed

Fixes, in order of desperation:

## 1. Try to cancel any running operations
pulumi cancel

## 2. Clear the lock (dangerous but often necessary)
pulumi state delete-lock <lock-id>
## Find lock-id from: pulumi stack export

## 3. Nuclear option - export state and reimport
pulumi stack export > stack-backup.json
pulumi stack rm --force
pulumi stack init <same-name>
pulumi stack import < stack-backup.json

Prevention: Never run pulumi up manually when using GitOps. Let the operator handle it.

Q

Why does Helm keep failing with "repository not found" errors?

A

Helm's dependency caching is broken by design. Your Chart.yaml says to pull from a repository, but Helm can't find it because:

  • The repository URL changed
  • Your cluster can't reach the internet (common in corporate environments)
  • Helm chart registry is down (happens more often than you'd think)
  • Charts were cached with the wrong version

Fix:

## Clear Helm's cache (this fixes 60% of issues)
helm repo update
helm dependency update charts/your-app/

## If that fails, nuke the cache completely
rm -rf ~/.cache/helm/
rm -rf charts/your-app/charts/

## Re-add repositories and update
helm repo add bitnami https://charts.bitnami.com/
## Note: Bitnami uses OCI format now - check their migration guide at https://github.com/bitnami/charts
helm dependency build charts/your-app/
Q

My AWS bill is $1200 this month. What went wrong?

A

Classic mistake. Everyone underestimates the cost of running this stack:

Hidden costs that add up:

  • NAT Gateway: $45/month per AZ (you need 2 for HA)
  • LoadBalancers: $18/month each (you'll have 5-10 services)
  • EBS volumes: $10/month per volume (every pod creates one)
  • Cross-AZ data transfer: $0.01/GB (adds up with large deployments)
  • CloudWatch logs: $0.50/GB (Kubernetes generates lots of logs)

Cost optimization:

## Check your LoadBalancer count
kubectl get svc --all-namespaces | grep LoadBalancer

## Use NodePort or Ingress instead for non-production
## Use gp3 volumes instead of gp2 (30% cheaper)
## Set up log retention policies (don't store logs forever)
Q

Can I run this on a single t3.medium instance to save money?

A

No. Don't even try. I wasted 2 weeks attempting this.

Minimum viable production setup:

  • 3x t3.medium nodes (2 for apps, 1 dedicated for ArgoCD)
  • ArgoCD controller needs 2GB RAM minimum
  • EKS control plane needs 2 CPU cores during deployments
  • Total: ~$200/month minimum

What happens with smaller instances:

  • Pods get evicted during deployments
  • ArgoCD OOMKills itself
  • Pulumi operations timeout
  • Your cluster becomes unusable during peak hours
Q

Why does my Kubernetes cluster randomly stop working?

A

Usually one of these culprits:

1. AWS ENI Limit Reached
Each pod needs an IP address. t3.medium instances support 12 ENIs = 12 pods max. You'll hit this limit fast.

## Check ENI usage
kubectl describe nodes | grep "pods:"

2. Disk Space Full
Container images fill up disk space. Default EBS volumes are only 20GB.

## Check disk usage on nodes
kubectl get nodes -o wide
ssh into node and run: df -h

3. Memory Pressure
Kubernetes starts evicting pods when memory usage > 85%.

kubectl top nodes
kubectl describe node <node-name> | grep -A 10 "Allocated resources"
Q

How do I debug when nothing works and the logs are useless?

A

Welcome to Kubernetes debugging hell. Here's the systematic approach:

1. Check the basics first:

## Are your nodes ready?
kubectl get nodes

## Are your pods actually running?
kubectl get pods --all-namespaces | grep -v Running

## What's using all the resources?
kubectl top nodes
kubectl top pods --all-namespaces

2. ArgoCD issues:

## Check ArgoCD controller logs
kubectl logs -n argocd -l app.kubernetes.io/name=argocd-application-controller --tail=100

## Check if ArgoCD can reach Git repositories
kubectl exec -n argocd deployment/argocd-application-controller -- git ls-remote https://github.com/your-org/your-repo.git

3. Pulumi issues:

## Check Pulumi operator logs
kubectl logs -n pulumi-system -l app.kubernetes.io/name=pulumi-kubernetes-operator

## Check stack status
kubectl get stacks --all-namespaces
kubectl describe stack <stack-name> -n <namespace>

4. Network issues (always the answer):

## Test pod-to-pod connectivity
kubectl run debug --image=busybox --rm -it --restart=Never -- sh
## Inside the pod: nslookup kubernetes.default.svc.cluster.local

## Check DNS is working
kubectl exec -ti -n kube-system <coredns-pod> -- nslookup google.com
Q

Should I use this in production or is it just hype?

A

I've run this stack in production for 18 months.

Here's the honest truth:

It's production-ready if:

  • You have budget for proper resources ($300+/month minimum)
  • Your team can debug Kubernetes issues
  • You're comfortable with the GitOps philosophy
  • You need the audit trail and deployment consistency

Stick with simpler tools if:

  • You have < 10 applications
  • Budget is tight (< $200/month for infrastructure)
  • Your team are Kubernetes beginners
  • You need 100% uptime (this stack will have outages)

Bottom line: It works but it's complex. The benefits are real, but so is the operational overhead. Make sure you're solving a problem this stack is designed for, not just chasing the latest trends.

Q

My manager wants a "simple migration path." Is there one?

A

Haha. No.

This is not a simple migration. Plan for:

  • 3-6 months of development time
  • 2-3 production outages during the transition
  • $50K+ in AWS costs for parallel environments
  • Lots of "why did we do this?" conversations

Realistic migration approach:

  1. Start with new applications only
  2. Build confidence over 6 months
  3. Migrate critical applications last
  4. Keep the old deployment system running in parallel for months

Anyone promising a "simple migration" has never actually done this.

Essential Resources and Documentation

Related Tools & Recommendations

compare
Similar content

Terraform vs Pulumi vs AWS CDK vs OpenTofu: Real-World Comparison

Compare Terraform, Pulumi, AWS CDK, and OpenTofu for Infrastructure as Code. Learn from production deployments, understand their pros and cons, and choose the b

Terraform
/compare/terraform/pulumi/aws-cdk/iac-platform-comparison
100%
tool
Similar content

Helm: Simplify Kubernetes Deployments & Avoid YAML Chaos

Package manager for Kubernetes that saves you from copy-pasting deployment configs like a savage. Helm charts beat maintaining separate YAML files for every dam

Helm
/tool/helm/overview
74%
tool
Similar content

Helm Troubleshooting Guide: Fix Deployments & Debug Errors

The commands, tools, and nuclear options for when your Helm deployment is fucked and you need to debug template errors at 3am.

Helm
/tool/helm/troubleshooting-guide
67%
tool
Similar content

ArgoCD - GitOps for Kubernetes That Actually Works

Continuous deployment tool that watches your Git repos and syncs changes to Kubernetes clusters, complete with a web UI you'll actually want to use

Argo CD
/tool/argocd/overview
54%
tool
Similar content

Pulumi Cloud for Platform Engineering: Build Self-Service IDP

Empower platform engineering with Pulumi Cloud. Build self-service Internal Developer Platforms (IDPs), avoid common failures, and implement a successful strate

Pulumi Cloud
/tool/pulumi-cloud/platform-engineering-guide
52%
tool
Similar content

Pulumi Cloud Enterprise Deployment: Production Reality & Security

When Infrastructure Meets Enterprise Reality

Pulumi Cloud
/tool/pulumi-cloud/enterprise-deployment-strategies
51%
alternatives
Recommended

Terraform Alternatives by Performance and Use Case - Which Tool Actually Fits Your Needs

Stop choosing IaC tools based on hype - pick the one that performs best for your specific workload and team size

Terraform
/alternatives/terraform/performance-focused-alternatives
48%
tool
Recommended

Terraform - Define Infrastructure in Code Instead of Clicking Through AWS Console for 3 Hours

The tool that lets you describe what you want instead of how to build it (assuming you enjoy YAML's evil twin)

Terraform
/tool/terraform/overview
48%
tool
Similar content

Pulumi Overview: IaC with Real Programming Languages & Production Use

Discover Pulumi, the Infrastructure as Code tool. Learn how to define cloud infrastructure with real programming languages, compare it to Terraform, and see its

Pulumi
/tool/pulumi/overview
48%
integration
Recommended

Setting Up Prometheus Monitoring That Won't Make You Hate Your Job

How to Connect Prometheus, Grafana, and Alertmanager Without Losing Your Sanity

Prometheus
/integration/prometheus-grafana-alertmanager/complete-monitoring-integration
47%
howto
Recommended

Set Up Microservices Monitoring That Actually Works

Stop flying blind - get real visibility into what's breaking your distributed services

Prometheus
/howto/setup-microservices-observability-prometheus-jaeger-grafana/complete-observability-setup
47%
tool
Similar content

Flux GitOps: Secure Kubernetes Deployments with CI/CD

GitOps controller that pulls from Git instead of having your build pipeline push to Kubernetes

FluxCD (Flux v2)
/tool/flux/overview
44%
troubleshoot
Recommended

Fix Docker Daemon Connection Failures

When Docker decides to fuck you over at 2 AM

Docker Engine
/troubleshoot/docker-error-during-connect-daemon-not-running/daemon-connection-failures
42%
troubleshoot
Recommended

Docker Container Won't Start? Here's How to Actually Fix It

Real solutions for when Docker decides to ruin your day (again)

Docker
/troubleshoot/docker-container-wont-start-error/container-startup-failures
42%
troubleshoot
Recommended

Docker Permission Denied on Windows? Here's How to Fix It

Docker on Windows breaks at 3am. Every damn time.

Docker Desktop
/troubleshoot/docker-permission-denied-windows/permission-denied-fixes
42%
alternatives
Recommended

GitHub Actions Alternatives for Security & Compliance Teams

integrates with GitHub Actions

GitHub Actions
/alternatives/github-actions/security-compliance-alternatives
37%
tool
Recommended

GitHub Actions Marketplace - Where CI/CD Actually Gets Easier

integrates with GitHub Actions Marketplace

GitHub Actions Marketplace
/tool/github-actions-marketplace/overview
37%
alternatives
Recommended

Tired of GitHub Actions Eating Your Budget? Here's Where Teams Are Actually Going

integrates with GitHub Actions

GitHub Actions
/alternatives/github-actions/migration-ready-alternatives
37%
tool
Similar content

GitOps Overview: Principles, Benefits & Implementation Guide

Finally, a deployment method that doesn't require you to SSH into production servers at 3am to fix what some jackass manually changed

Argo CD
/tool/gitops/overview
36%
tool
Recommended

Google Kubernetes Engine (GKE) - Google's Managed Kubernetes (That Actually Works Most of the Time)

Google runs your Kubernetes clusters so you don't wake up to etcd corruption at 3am. Costs way more than DIY but beats losing your weekend to cluster disasters.

Google Kubernetes Engine (GKE)
/tool/google-kubernetes-engine/overview
33%

Recommendations combine user behavior, content similarity, research intelligence, and SEO optimization