The 3AM Debug Guide - Fix It Fast

Q

ArgoCD repo server keeps running out of memory and crashing

A

Your repo server container probably hit the default 500MB memory limit while trying to process some massive Helm chart or a monorepo with hundreds of YAML files. First, check kubectl top pod to confirm memory usage. Then bump the memory limit in your ArgoCD server deployment:

spec:
  template:
    spec:
      containers:
      - name: repo-server
        resources:
          limits:
            memory: 2Gi  # Up from default 500Mi

The real fix: split your monorepos or use ApplicationSets to manage large applications. I've seen repo servers consume 8GB+ RAM from monorepos with thousands of microservice manifests.

Q

Applications stuck syncing for hours with no error messages

A

Check the argocd-application-controller logs first: kubectl logs -n argocd deployment/argocd-application-controller. 90% of the time it's hitting GitHub API rate limits because you have too many apps polling the same repo every 3 minutes.

Quick fix: increase the polling interval to 10+ minutes in the Application spec:

spec:
  source:
    repoURL: https://github.com/company/app-configs
    path: prod/
    targetRevision: HEAD
    # Add this to reduce polling frequency
    argocd.argoproj.io/refresh: 10m

Better fix: set up webhook-based sync so ArgoCD only syncs when you actually push changes.

Q

The sync button works but auto-sync completely ignores changes

A

You probably have a resource that's perpetually out-of-sync causing the sync loop to fail. Find it with: argocd app diff app-name or check the "Last Sync Result" in the UI. Common culprits:

  • ConfigMaps with generated data that changes every sync
  • Resources managed by operators that ArgoCD shouldn't touch
  • Finalizer issues preventing resource deletion

Add the argocd.argoproj.io/compare-options: IgnoreExtraneous annotation to resources that operators modify, or exclude them entirely with:

metadata:
  annotations:
    argocd.argoproj.io/sync-options: Prune=false
Q

Redis is consuming ridiculous amounts of memory (like 4GB+)

A

ArgoCD uses Redis to cache Git repo data and application state. If you have hundreds of applications or large Git repos, Redis memory usage explodes. Check with kubectl exec -it redis-pod -- redis-cli info memory.

Emergency fix: restart Redis. You'll lose the cache but everything will work:

kubectl delete pod -n argocd -l app.kubernetes.io/name=argocd-redis

Permanent fix: enable Redis memory optimization in your ArgoCD config:

apiVersion: v1
kind: ConfigMap
metadata:
  name: argocd-cmd-params-cm
data:
  redis.compress: "gzip"  # Compress cached data
  repo.server.ttl: "5m"   # Reduce cache TTL
Q

ArgoCD web UI shows "FAILED TO LOAD DATA" for everything

A

Either your argocd-server pod crashed, or you have RBAC issues. Check server logs: kubectl logs -n argocd deployment/argocd-server. If it's RBAC, you'll see "forbidden" errors.

Most common cause: you modified ArgoCD's ClusterRole permissions and broke something. The nuclear option that works 99% of the time:

kubectl delete clusterrole argocd-application-controller
kubectl delete clusterrolebinding argocd-application-controller
## ArgoCD will recreate these with correct permissions
kubectl rollout restart deployment/argocd-application-controller -n argocd
Q

Sync hooks keep failing with "Job has reached the specified backoff limit"

A

Your pre-sync or post-sync hooks are failing repeatedly. Check the hook Job logs:

kubectl get jobs -n your-namespace | grep -E 'pre-sync|post-sync'
kubectl logs job/failing-hook-job -n your-namespace

Quick fix for hook timeouts: increase the activeDeadlineSeconds:

apiVersion: batch/v1
kind: Job
metadata:
  annotations:
    argocd.argoproj.io/hook: PreSync
    argocd.argoproj.io/hook-delete-policy: BeforeHookCreation
spec:
  activeDeadlineSeconds: 600  # 10 minutes instead of default
Q

ArgoCD randomly shows apps as "OutOfSync" even though nothing changed

A

This is usually drift detection being overly sensitive to timestamps, resource versions, or operator-managed fields. Check the diff in the UI - if it's just metadata changes, add ignore differences:

spec:
  ignoreDifferences:
  - group: apps
    kind: Deployment
    jsonPointers:
    - /metadata/resourceVersion
    - /metadata/generation
    - /status

For operator-managed resources (Istio, cert-manager, etc.), this is common. You need to tell ArgoCD which fields to ignore.

Q

Applications are healthy but traffic isn't working

A

ArgoCD health checks only verify Kubernetes resources exist, not that your app actually works. A Deployment shows "Healthy" when pods are running, even if they're serving 500 errors.

Immediate debugging:

## Check if pods are actually ready
kubectl get pods -n your-namespace
## Check service endpoints
kubectl describe svc your-service -n your-namespace  
## Check ingress rules
kubectl describe ingress your-ingress -n your-namespace

Long-term fix: integrate with Argo Rollouts for actual application health monitoring, or set up custom health checks for critical services.

Q

ArgoCD deleted resources I needed - how do I prevent this?

A

You enabled the "Prune" option which removes Kubernetes resources that exist in the cluster but aren't defined in Git. This is dangerous with operators and external resources.

Immediate recovery: check if you can restore from Git history or Kubernetes events. For future prevention:

metadata:
  annotations:
    argocd.argoproj.io/sync-options: Prune=false  # Never delete this resource

Better: use sync policies that require manual confirmation for destructive operations.

Q

The ArgoCD CLI just hangs on every command

A

Usually means the CLI can't authenticate with the ArgoCD server. Check your context:

argocd context  # Shows current context
argocd login argocd.your-domain.com --sso  # Re-authenticate

If you're running ArgoCD in a different namespace than argocd, specify it:

argocd app list --server argocd-server.your-namespace.svc.cluster.local:443
Q

Multi-cluster sync fails with "connection refused" errors

A

Your ArgoCD instance can't reach the target cluster. Check cluster credentials:

argocd cluster list  # Show registered clusters
kubectl get secret -n argocd | grep cluster  # Check cluster secrets

Most common issues:

  • Cluster API endpoint changed (EKS clusters update URLs)
  • Service account token expired
  • Network policies blocking traffic
  • Wrong RBAC permissions on target cluster

Re-register the cluster to fix authentication:

argocd cluster add my-cluster-name --kubeconfig ~/.kube/config

Production War Stories - What Actually Breaks (And How to Fix It)

I've been running ArgoCD in production for over 3 years across 50+ clusters. Here's the shit that actually goes wrong when you scale beyond the demo.

The Memory Leak That Cost Us a Weekend

Our ArgoCD repo server started consuming 12GB of memory during peak deployment hours. The Kubernetes cluster kept killing it, causing sync failures across all applications. The root cause? We had a monorepo with 300+ microservices, each with complex Helm charts that included 50+ templates.

The repo server was caching rendered manifests for every application, every environment, every branch we'd ever deployed. That's thousands of YAML files being held in memory simultaneously. When the cache hit 12GB, the kernel OOMKilled the pod.

The fix that actually worked:

apiVersion: v1
kind: ConfigMap
metadata:
  name: argocd-cmd-params-cm
  namespace: argocd
data:
  reposerver.max.combined.directory.manifests.size: \"200Mi\"
  repository.cache.expiration.duration: \"5m\"
  repo.server.parallelism.limit: \"2\"  # Don't render everything at once

We also split the monorepo into smaller repositories organized by team ownership. Instead of one repo with 300 services, we have 15 repos with ~20 services each. ArgoCD performance improved dramatically.

The Great Prune Disaster of 2024

Someone enabled auto-sync with prune on our production ArgoCD applications without understanding what prune does. ArgoCD deleted every Kubernetes resource that wasn't explicitly defined in our Git repositories. This included:

  • External secrets created by the External Secrets Operator
  • Service mesh sidecars injected by Istio
  • Monitoring agents deployed by Datadog
  • Certificate resources managed by cert-manager
  • Persistent volumes that contained customer data

The incident lasted 4 hours and required manual restoration from backups. We lost customer data that couldn't be recovered from Git.

The prevention strategy we implemented:

## Default sync policy for all apps
spec:
  syncPolicy:
    automated:
      prune: false    # NEVER enable this globally
      selfHeal: true  # Auto-fix drift, but don't delete
    syncOptions:
    - CreateNamespace=true
    - PrunePropagationPolicy=foreground
    - PruneLast=true  # If prune is enabled, do it last

We also added this to our ArgoCD RBAC policy to prevent accidental prune enabling:

p, ops-team, applications, *, default/*, allow
p, ops-team, applications, sync, default/*, deny
p, admin-only, applications, *, default/*, allow
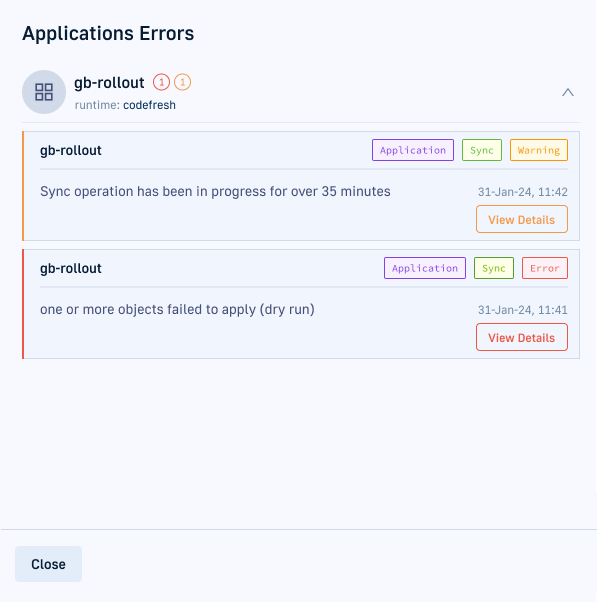
ArgoCD Application Sync Warning

The GitHub API Rate Limit Hell

With 200+ applications polling GitHub every 3 minutes, we hit GitHub's API rate limits constantly. ArgoCD would stop syncing randomly, deployments would fail, and the logs were full of "API rate limit exceeded" errors.

The math is brutal: 200 apps × 20 polls/hour × 24 hours = 96,000 API requests per day. GitHub's rate limit is 60 requests/minute for basic authentication.

Our multi-pronged solution:

  1. Webhook-based sync for critical applications:
apiVersion: v1
kind: Service
metadata:
  name: argocd-webhook
spec:
  ports:
  - port: 80
    targetPort: 8080
  selector:
    app.kubernetes.io/name: argocd-server
  1. Increased polling intervals for non-critical apps:
spec:
  source:
    repoURL: https://github.com/company/configs
    path: staging/
    targetRevision: HEAD
  syncPolicy:
    syncOptions:
    - Replace=true
    # Reduce polling frequency to 15 minutes
    argocd.argoproj.io/refresh: 15m
  1. Multiple GitHub tokens with load balancing:
apiVersion: v1
kind: Secret
metadata:
  name: github-repo-1
data:
  password: <token-1-base64>
---
apiVersion: v1
kind: Secret
metadata:
  name: github-repo-2  
data:
  password: <token-2-base64>

We went from 400+ rate limit errors per day to zero.

The Sync Wave Nightmare

We had a complex application with database migrations that needed to run before the API deployment. Simple enough - use sync waves to ensure the migration Job runs first:

## Migration job - wave 0 (runs first)
apiVersion: batch/v1
kind: Job  
metadata:
  annotations:
    argocd.argoproj.io/sync-wave: \"0\"
    argocd.argoproj.io/hook: PreSync
---
## API deployment - wave 1 (runs after)
apiVersion: apps/v1
kind: Deployment
metadata:
  annotations:
    argocd.argoproj.io/sync-wave: \"1\"

This worked in testing but failed in production because:

  • The migration job took 15 minutes to complete
  • ArgoCD's default sync timeout is 5 minutes
  • The job appeared to hang, so ArgoCD marked the sync as failed
  • But the migration was still running in the background
  • The next sync attempt created a second migration job
  • Now we have two migrations running simultaneously against the same database

The fix required multiple changes:

## Increase sync timeout globally
apiVersion: v1
kind: ConfigMap
metadata:
  name: argocd-cmd-params-cm
data:
  timeout.hard.reconciliation: \"20m\"  # Up from 5m default
---
## Job with proper cleanup and timeout
apiVersion: batch/v1
kind: Job
metadata:
  annotations:
    argocd.argoproj.io/sync-wave: \"0\"
    argocd.argoproj.io/hook: PreSync
    argocd.argoproj.io/hook-delete-policy: BeforeHookCreation
spec:
  activeDeadlineSeconds: 1200  # 20 minutes max
  backoffLimit: 0  # Don't retry failed migrations

The Multi-Cluster Authentication Nightmare

We had ArgoCD managing 15 different Kubernetes clusters across AWS, GCP, and on-premises. Authentication worked fine initially, but after 6 months, random clusters would become "Connection Refused" and stop syncing.

The problem: EKS and GKE clusters update their API endpoints periodically. The cluster certificates ArgoCD cached became invalid. Service account tokens expired. Network policies changed.

Our detection and remediation strategy:

  1. Health monitoring for all registered clusters:
#!/bin/bash
## Check cluster connectivity every 5 minutes
for cluster in $(argocd cluster list -o name); do
  if ! argocd cluster get \"$cluster\" &>/dev/null; then
    echo \"ALERT: Cluster $cluster is unreachable\"
    # Auto-remediation: re-register the cluster
    argocd cluster add \"$cluster\" --kubeconfig /etc/kubeconfig/\"$cluster\"
  fi
done
  1. Automated token refresh for service accounts:
## CronJob to refresh cluster service account tokens
apiVersion: batch/v1
kind: CronJob
metadata:
  name: cluster-token-refresh
spec:
  schedule: \"0 2 * * 0\"  # Weekly at 2 AM
  jobTemplate:
    spec:
      template:
        spec:
          serviceAccountName: cluster-admin
          containers:
          - name: token-refresh
            image: argoproj/argocd:v2.8.4
            command: [\"/usr/local/bin/refresh-cluster-tokens.sh\"]
  1. Circuit breaker pattern to isolate failing clusters:
## Separate ArgoCD instance for critical production clusters
apiVersion: argoproj.io/v1alpha1
kind: AppProject
metadata:
  name: production-only
spec:
  destinations:
  - namespace: '*'
    server: https://prod-cluster-1.example.com
  - namespace: '*' 
    server: https://prod-cluster-2.example.com
  # Isolate from dev/staging cluster failures

ArgoCD Application Management

The Resource Hooks That Never Finished

We used resource hooks for database schema migrations and cache warming. The hooks would start successfully but never complete, leaving applications stuck in "Progressing" status forever.

The issue: failed hooks don't fail loudly. They just sit there consuming resources while ArgoCD waits indefinitely. After investigating dozens of stuck deployments, we found:

  • Database migration scripts that hung on locks
  • Network timeouts that weren't handled
  • Resource quotas preventing Job pod creation
  • RBAC issues preventing hook execution
  • Insufficient memory limits causing OOMKilled pods

Our hook reliability improvements:

apiVersion: batch/v1
kind: Job
metadata:
  annotations:
    argocd.argoproj.io/hook: PreSync
    argocd.argoproj.io/hook-delete-policy: HookSucceeded,BeforeHookCreation
    argocd.argoproj.io/sync-wave: \"-1\"
spec:
  activeDeadlineSeconds: 300    # 5 minute timeout
  backoffLimit: 2               # Retry twice max
  completions: 1                # Single run
  parallelism: 1                # No concurrent execution
  template:
    metadata:
      annotations:
        # Prevent Istio sidecar injection that can cause hooks to hang
        sidecar.istio.io/inject: \"false\"
    spec:
      restartPolicy: Never
      containers:
      - name: migration
        image: migrate/migrate:4
        resources:
          limits:
            memory: 512Mi       # Prevent OOMKill
            cpu: 500m
          requests:
            memory: 256Mi
            cpu: 100m
        # Always include health checks
        livenessProbe:
          exec:
            command: [\"/bin/sh\", \"-c\", \"ps aux | grep migrate\"]
          initialDelaySeconds: 30
          periodSeconds: 60

We also added comprehensive logging to track hook execution:

## Monitor hook status across all applications  
kubectl get jobs -A -l app.kubernetes.io/managed-by=argocd --watch

## Debug specific hook failures
kubectl logs job/pre-sync-migration-123 -n production --previous

The key insight: hooks need the same reliability patterns as regular applications - timeouts, resource limits, health checks, and proper error handling.

Performance Tuning That Actually Matters

After scaling to 500+ applications across multiple clusters, ArgoCD's default settings become a bottleneck. Here's what we tuned and why:

Repository Server Scaling:

## More repo server replicas for parallel Git operations
apiVersion: apps/v1
kind: Deployment
metadata:
  name: argocd-repo-server
spec:
  replicas: 5  # Up from default 1
  template:
    spec:
      containers:
      - name: repo-server
        resources:
          limits:
            memory: 2Gi    # Up from 256Mi default
            cpu: 1000m     # Up from 250m default
          requests:
            memory: 1Gi
            cpu: 500m
        env:
        # Increase Git operation timeout
        - name: ARGOCD_EXEC_TIMEOUT
          value: \"300\"  # 5 minutes for large repos

Application Controller Tuning:

apiVersion: v1
kind: ConfigMap
metadata:
  name: argocd-cmd-params-cm
data:
  # Increase application processing parallelism
  application.controller.parallelism.limit: \"50\"  # Up from 10
  # Reduce sync frequency for non-critical apps
  timeout.reconciliation: \"300s\"  # 5 minutes
  # Enable gzip compression for large manifests
  reposerver.parallelism.limit: \"4\"

Redis Configuration for Scale:

## Redis with persistence and memory optimization
apiVersion: apps/v1
kind: StatefulSet
metadata:
  name: argocd-redis
spec:
  template:
    spec:
      containers:
      - name: redis
        image: redis:7-alpine
        resources:
          limits:
            memory: 4Gi     # Large cache for 500+ apps
          requests:
            memory: 2Gi
        # Redis config optimized for ArgoCD workload
        args:
        - redis-server
        - --maxmemory
        - 3gb
        - --maxmemory-policy
        - allkeys-lru       # Evict least recently used keys
        - --save
        - 900 1             # Persist to disk every 15 minutes

These changes reduced average sync times from 45 seconds to 12 seconds across our application portfolio.

The Lessons From Production

After years of ArgoCD incidents, here's what actually prevents problems:

  1. Start with conservative settings - Auto-sync disabled, prune disabled, manual approval required
  2. Monitor resource consumption - Memory, CPU, and API rate limits are the first things to break
  3. Test everything in staging first - But assume production will break differently anyway
  4. Have rollback plans - Git reverts are your friend, but practice them before you need them
  5. Don't trust health checks - ArgoCD "Healthy" doesn't mean your app works
  6. Separate critical from non-critical apps - Use different ArgoCD instances or strict RBAC
  7. Automate common fixes - Script the solutions to problems you see repeatedly

The reality: ArgoCD is incredibly powerful when it works, but debugging it at scale requires deep Kubernetes knowledge and patience. Plan for things to break in ways you didn't expect.
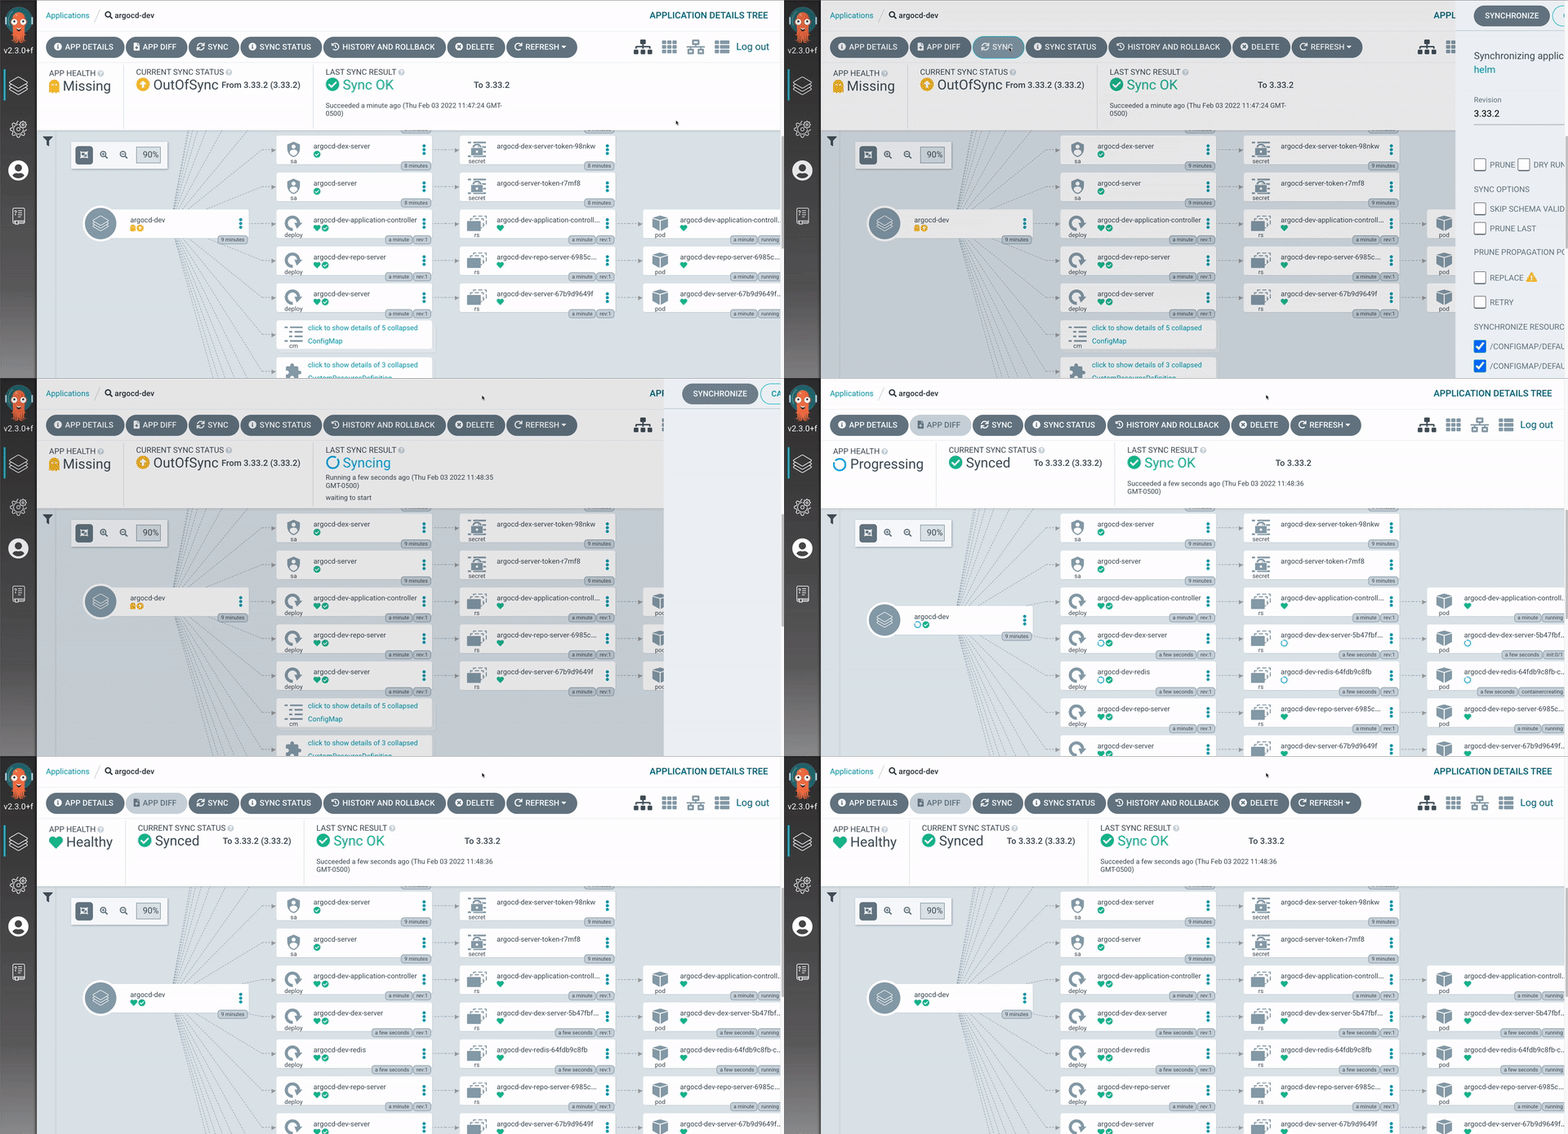
Common ArgoCD Issues - Problem vs Solution Matrix

Problem Symptoms

Root Cause

Quick Fix

Long-term Solution

Time to Fix

Repo server OOMKilled

Large monorepos + complex Helm charts

Increase memory limit to 2-4GB

Split monorepos, optimize Helm templates

15 minutes / 2 weeks

UI loads slowly (>10 seconds)

200+ applications rendering in browser

Enable application list paging

Use CLI for bulk operations, split ArgoCD instances

5 minutes / 1 day

Redis consuming 4GB+ memory

Too many cached Git repos and manifests

Restart Redis pod

Configure cache compression and TTL limits

2 minutes / 30 minutes

Sync operations timeout

Default 5-minute timeout too short

Increase timeout to 20+ minutes

Optimize resource hooks and dependencies

5 minutes / 1 day

API server crashes frequently

High load from CLI/UI requests

Scale API server replicas

Implement rate limiting and connection pooling

10 minutes / 4 hours

Monitoring and Alerting - Don't Let ArgoCD Fail Silently

ArgoCD fails in subtle ways. Your applications might be "Healthy" while serving 500 errors. Sync operations might succeed while critical resources are silently ignored. The default ArgoCD installation gives you minimal observability into what's actually happening.

After dealing with too many 3 AM outages that could have been prevented, here's the monitoring setup that actually catches problems before they become disasters.

The Metrics That Actually Matter

ArgoCD exposes Prometheus metrics, but most of them are useless noise. Focus on these key indicators that predict real problems:

Application Health Trends:

## Alert when apps consistently fail health checks
- alert: ArgoCD_Application_Health_Degraded
  expr: |
    (
      argocd_app_health_status{health_status!="Healthy"} == 1
    ) * on(name, namespace) group_left(repo) (
      argocd_app_info
    )
  for: 10m
  annotations:
    summary: "ArgoCD application {{ $labels.name }} unhealthy"
    description: "Application {{ $labels.name }} in {{ $labels.namespace }} has been unhealthy for 10+ minutes"

Sync Operation Failures:

## Track applications that fail to sync repeatedly
- alert: ArgoCD_Sync_Failures_High
  expr: |
    increase(argocd_app_sync_total{phase="Failed"}[30m]) > 3
  annotations:
    summary: "ArgoCD sync failures increasing"
    description: "Application {{ $labels.name }} failed to sync {{ $value }} times in 30 minutes"

Resource Consumption Alerts:

## ArgoCD components hitting memory/CPU limits
- alert: ArgoCD_High_Memory_Usage
  expr: |
    container_memory_working_set_bytes{pod=~"argocd-.*"} /
    container_spec_memory_limit_bytes{pod=~"argocd-.*"} > 0.8
  for: 15m
  annotations:
    summary: "ArgoCD component {{ $labels.pod }} high memory usage"

ArgoCD Monitoring Dashboard

Custom Health Checks for Real Application Monitoring

ArgoCD's built-in health checks only verify Kubernetes resources exist, not that your application works. Here's how to implement actual application health monitoring:

HTTP Endpoint Health Check:

apiVersion: v1
kind: ConfigMap
metadata:
  name: argocd-cm
  namespace: argocd
data:
  resource.customizations.health.apps_Deployment: |
    hs = {}
    if obj.status ~= nil then
      if obj.status.readyReplicas ~= nil and obj.status.readyReplicas > 0 then
        -- Custom logic: check if endpoint responds
        local http = require("socket.http")
        local body, code = http.request("http://" .. obj.metadata.name .. ".svc.cluster.local/health")
        if code == 200 then
          hs.status = "Healthy"
        else
          hs.status = "Degraded"
          hs.message = "Health endpoint returned " .. code
        end
      else
        hs.status = "Progressing"
      end
    end
    return hs

Database Connection Health:

## Custom health check for applications that need database connectivity
resource.customizations.health.batch_Job: |
  hs = {}
  if obj.status ~= nil then
    if obj.status.succeeded ~= nil and obj.status.succeeded > 0 then
      hs.status = "Healthy"
    elseif obj.status.failed ~= nil and obj.status.failed > 0 then
      hs.status = "Degraded" 
      hs.message = "Job failed"
    else
      hs.status = "Progressing"
    end
  end
  return hs

Notification Strategies That Don't Spam

The default ArgoCD notifications are either too noisy or too quiet. Here's a notification strategy that actually helps:

Tiered Alert Severity:

apiVersion: v1
kind: ConfigMap  
metadata:
  name: argocd-notifications-cm
  namespace: argocd
data:
  # Critical: affects production user traffic
  template.app-critical: |
    message: |
      🚨 CRITICAL: Production app {{ .app.metadata.name }} is DOWN
      - Status: {{ .app.status.health.status }}
      - Repo: {{ .app.spec.source.repoURL }}
      - Last sync: {{ .app.status.operationState.finishedAt }}
      
  # Warning: internal services or development environments  
  template.app-warning: |
    message: |
      ⚠️ WARNING: App {{ .app.metadata.name }} needs attention
      - Status: {{ .app.status.health.status }}
      - Sync: {{ .app.status.sync.status }}

  # Info: successful deployments, FYI only
  template.app-info: |
    message: |
      ✅ {{ .app.metadata.name }} deployed successfully
      - Version: {{ .app.status.operationState.syncResult.revision }}

Smart Routing Rules:

## Route notifications based on application criticality and time
subscriptions: |
  - recipients:
    - slack:production-alerts
    triggers:
    - on-health-degraded  
    - on-sync-failed
    when: app.metadata.labels['criticality'] == 'high'
    
  - recipients:
    - slack:dev-deployments
    triggers:
    - on-deployed
    when: app.metadata.labels['env'] == 'development' and time.Now().Hour() >= 9 and time.Now().Hour() <= 17

Git Integration for Deployment Tracking

One of GitOps's biggest advantages is deployment auditability, but only if you track it properly. Here's how to connect ArgoCD events back to Git commits and pull requests:

Commit-Level Deployment Status:

## Webhook to update Git commit status when deployments complete
apiVersion: v1
kind: ConfigMap
metadata:
  name: argocd-notifications-cm
data:
  service.github: |
    appID: 12345
    installationID: 67890
    privateKey: |
      -----BEGIN PRIVATE KEY-----
      <your-github-app-private-key>
      -----END PRIVATE KEY-----

  template.github-commit-status: |
    webhook:
      github:
        method: POST
        path: /repos/{{.app.spec.source.repoURL | call .repo.FullNameByRepoURL}}/statuses/{{.app.status.operationState.syncResult.revision}}
        body: |
          {
            "state": "{{if eq .app.status.health.status "Healthy"}}success{{else}}failure{{end}}",
            "description": "ArgoCD deployment {{.app.status.health.status}}",
            "context": "continuous-delivery/argocd"
          }

Pull Request Comments with Deployment Status:

## Comment on PRs when they're deployed to different environments
template.github-pr-comment: |
  webhook:
    github:
      method: POST  
      path: /repos/{{.app.spec.source.repoURL | call .repo.FullNameByRepoURL}}/issues/{{.app.metadata.annotations["argocd.argoproj.io/pr-number"]}}/comments
      body: |
        {
          "body": "🚀 **Deployed to {{ .app.metadata.labels.env }}**

- **Revision:** {{ .app.status.operationState.syncResult.revision }}
- **Status:** {{ .app.status.health.status }}
- **ArgoCD:** View application in ArgoCD dashboard"
        }

Log Aggregation and Structured Debugging

When ArgoCD breaks, you need to correlate logs across multiple components. Here's how to structure logging for effective debugging:

Centralized ArgoCD Logging:

## Filebeat configuration to collect ArgoCD logs
apiVersion: v1
kind: ConfigMap
metadata:
  name: filebeat-argocd-config
data:
  filebeat.yml: |
    filebeat.autodiscover:
      providers:
        - type: kubernetes
          node: ${NODE_NAME}
          hints.enabled: true
          templates:
            - condition:
                contains:
                  kubernetes.labels.app.kubernetes.io/name: argocd-server
              config:
                - type: container
                  paths:
                    - /var/log/containers/*${data.kubernetes.container.id}.log
                  fields:
                    component: argocd-server
                    log_type: application
            - condition:
                contains:
                  kubernetes.labels.app.kubernetes.io/name: argocd-application-controller
              config:
                - type: container
                  fields:
                    component: application-controller

Structured Log Analysis Queries:

## Find all sync failures for specific applications
curl -XGET "elasticsearch:9200/argocd-*/_search" -H 'Content-Type: application/json' -d'
{
  "query": {
    "bool": {
      "must": [
        {"match": {"component": "application-controller"}},
        {"match": {"message": "sync failed"}},
        {"range": {"@timestamp": {"gte": "now-1h"}}}
      ]
    }
  },
  "aggs": {
    "by_application": {
      "terms": {"field": "app_name.keyword"}
    }
  }
}' | jq '.aggregations.by_application.buckets'

## Track memory usage patterns leading to OOMKills  
curl -XGET "elasticsearch:9200/argocd-*/_search" -d'
{
  "query": {
    "bool": {
      "must": [
        {"match": {"component": "repo-server"}},
        {"match": {"message": "out of memory"}}
      ]
    }
  }
}'

Performance Baselines and Capacity Planning

ArgoCD performance degrades gradually as you add applications and clusters. Establish baselines early to predict when you'll hit limits:

Key Performance Metrics to Track:

  • Average sync duration by application size
  • Repository server memory usage vs. repo complexity
  • API server response times under different load
  • Redis memory usage growth rate
  • Git operation timeouts by repository size
## Grafana dashboard queries for ArgoCD performance baselines
## Average sync time by application
- title: "Sync Duration Trends"
  expr: |
    histogram_quantile(0.95, 
      rate(argocd_app_sync_bucket[5m])
    ) by (name)

## Memory usage correlation with application count
- title: "Memory vs App Count Correlation"  
  expr: |
    container_memory_working_set_bytes{pod=~"argocd-repo-server.*"} and on() (
      count(argocd_app_info)
    )

## Git operation failure rate by repository
- title: "Git Operation Success Rate"
  expr: |
    rate(argocd_git_request_total{request_type="fetch"}[5m]) -
    rate(argocd_git_request_total{request_type="fetch", error!=""}[5m])

Capacity Planning Rules of Thumb:

  • 1 ArgoCD instance handles ~100 applications comfortably
  • Repository server needs 2-4MB RAM per managed application
  • Each cluster adds ~50MB baseline memory usage
  • Git polling scales linearly with application count
  • UI becomes sluggish above 500 applications

The key insight: ArgoCD monitoring isn't just about knowing when things break - it's about predicting when they're about to break and having the data to understand why. Most ArgoCD outages follow predictable patterns if you're measuring the right things.

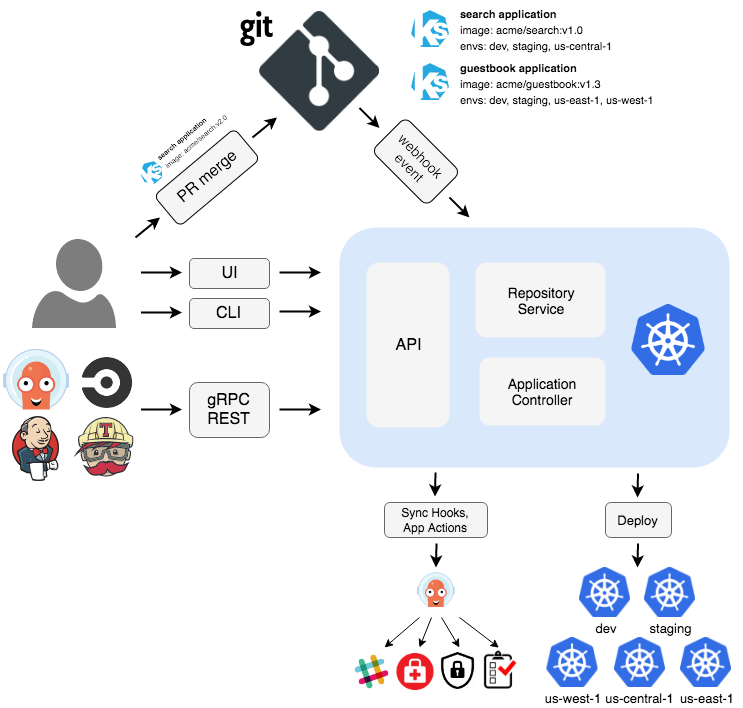
ArgoCD Architecture Components

ArgoCD Troubleshooting Resources and Emergency Guides

Related Tools & Recommendations

integration
Similar content

Jenkins Docker Kubernetes CI/CD: Deploy Without Breaking Production

The Real Guide to CI/CD That Actually Works

Jenkins
/integration/jenkins-docker-kubernetes/enterprise-ci-cd-pipeline
100%
tool
Similar content

Flux GitOps: Secure Kubernetes Deployments with CI/CD

GitOps controller that pulls from Git instead of having your build pipeline push to Kubernetes

FluxCD (Flux v2)
/tool/flux/overview
97%
tool
Similar content

ArgoCD - GitOps for Kubernetes That Actually Works

Continuous deployment tool that watches your Git repos and syncs changes to Kubernetes clusters, complete with a web UI you'll actually want to use

Argo CD
/tool/argocd/overview
71%
tool
Similar content

Fix gRPC Production Errors - The 3AM Debugging Guide

Fix critical gRPC production errors: 'connection refused', 'DEADLINE_EXCEEDED', and slow calls. This guide provides debugging strategies and monitoring solution

gRPC
/tool/grpc/production-troubleshooting
70%
tool
Similar content

Bolt.new Production Deployment Troubleshooting Guide

Beyond the demo: Real deployment issues, broken builds, and the fixes that actually work

Bolt.new
/tool/bolt-new/production-deployment-troubleshooting
63%
tool
Similar content

Grok Code Fast 1 Troubleshooting: Debugging & Fixing Common Errors

Stop googling cryptic errors. This is what actually breaks when you deploy Grok Code Fast 1 and how to fix it fast.

Grok Code Fast 1
/tool/grok-code-fast-1/troubleshooting-guide
61%
tool
Similar content

Fix Pulumi Deployment Failures - Complete Troubleshooting Guide

Master Pulumi deployment troubleshooting with this comprehensive guide. Learn systematic debugging, resolve common "resource creation failed" errors, and handle

Pulumi
/tool/pulumi/troubleshooting-guide
56%
tool
Similar content

Trivy & Docker Security Scanner Failures: Debugging CI/CD Integration Issues

Troubleshoot common Docker security scanner failures like Trivy database timeouts or 'resource temporarily unavailable' errors in CI/CD. Learn to debug and fix

Docker Security Scanners (Category)
/tool/docker-security-scanners/troubleshooting-failures
56%
tool
Similar content

Solana Web3.js Production Debugging Guide: Fix Common Errors

Learn to effectively debug and fix common Solana Web3.js production errors with this comprehensive guide. Tackle 'heap out of memory' and 'blockhash not found'

Solana Web3.js
/tool/solana-web3js/production-debugging-guide
56%
tool
Similar content

Arbitrum Production Debugging: Fix Gas & WASM Errors in Live Dapps

Real debugging for developers who've been burned by production failures

Arbitrum SDK
/tool/arbitrum-development-tools/production-debugging-guide
54%
pricing
Recommended

Enterprise Git Hosting: What GitHub, GitLab and Bitbucket Actually Cost

When your boss ruins everything by asking for "enterprise features"

GitHub Enterprise
/pricing/github-enterprise-bitbucket-gitlab/enterprise-deployment-cost-analysis
50%
tool
Recommended

GitLab CI/CD - The Platform That Does Everything (Usually)

CI/CD, security scanning, and project management in one place - when it works, it's great

GitLab CI/CD
/tool/gitlab-ci-cd/overview
49%
tool
Similar content

React Production Debugging: Fix App Crashes & White Screens

Five ways React apps crash in production that'll make you question your life choices.

React
/tool/react/debugging-production-issues
47%
tool
Similar content

Git Disaster Recovery & CVE-2025-48384 Security Alert Guide

Learn Git disaster recovery strategies and get immediate action steps for the critical CVE-2025-48384 security alert affecting Linux and macOS users.

Git
/tool/git/disaster-recovery-troubleshooting
47%
tool
Similar content

Cursor Background Agents & Bugbot Troubleshooting Guide

Troubleshoot common issues with Cursor Background Agents and Bugbot. Solve 'context too large' errors, fix GitHub integration problems, and optimize configurati

Cursor
/tool/cursor/agents-troubleshooting
47%
tool
Recommended

GitHub Copilot - AI Pair Programming That Actually Works

Stop copy-pasting from ChatGPT like a caveman - this thing lives inside your editor

GitHub Copilot
/tool/github-copilot/overview
45%
troubleshoot
Similar content

Fix Kubernetes ImagePullBackOff Error: Complete Troubleshooting Guide

From "Pod stuck in ImagePullBackOff" to "Problem solved in 90 seconds"

Kubernetes
/troubleshoot/kubernetes-imagepullbackoff/comprehensive-troubleshooting-guide
44%
tool
Similar content

Fix TaxAct Errors: Login, WebView2, E-file & State Rejection Guide

The 3am tax deadline debugging guide for login crashes, WebView2 errors, and all the shit that goes wrong when you need it to work

TaxAct
/tool/taxact/troubleshooting-guide
44%
tool
Similar content

TaxBit Enterprise Production Troubleshooting: Debug & Fix Issues

Real errors, working fixes, and why your monitoring needs to catch these before 3AM calls

TaxBit Enterprise
/tool/taxbit-enterprise/production-troubleshooting
44%
tool
Similar content

npm Enterprise Troubleshooting: Fix Corporate IT & Dev Problems

Production failures, proxy hell, and the CI/CD problems that actually cost money

npm
/tool/npm/enterprise-troubleshooting
44%

Recommendations combine user behavior, content similarity, research intelligence, and SEO optimization