Architecture Decisions That Will Haunt You Forever

Here's the thing about RHACS architecture - get it wrong early and you'll spend the next two years fixing it while security violations pile up and executives ask why their fancy security platform can't tell them if they're actually secure.

I've seen teams waste six months trying to retrofit their architecture because they didn't think through multi-cluster networking. Don't be those teams. At my last job, we had to rebuild everything because someone decided to ignore the networking design and just "figure it out later." Spoiler: later sucked.

Hub-and-Spoke vs. Federated Central Models

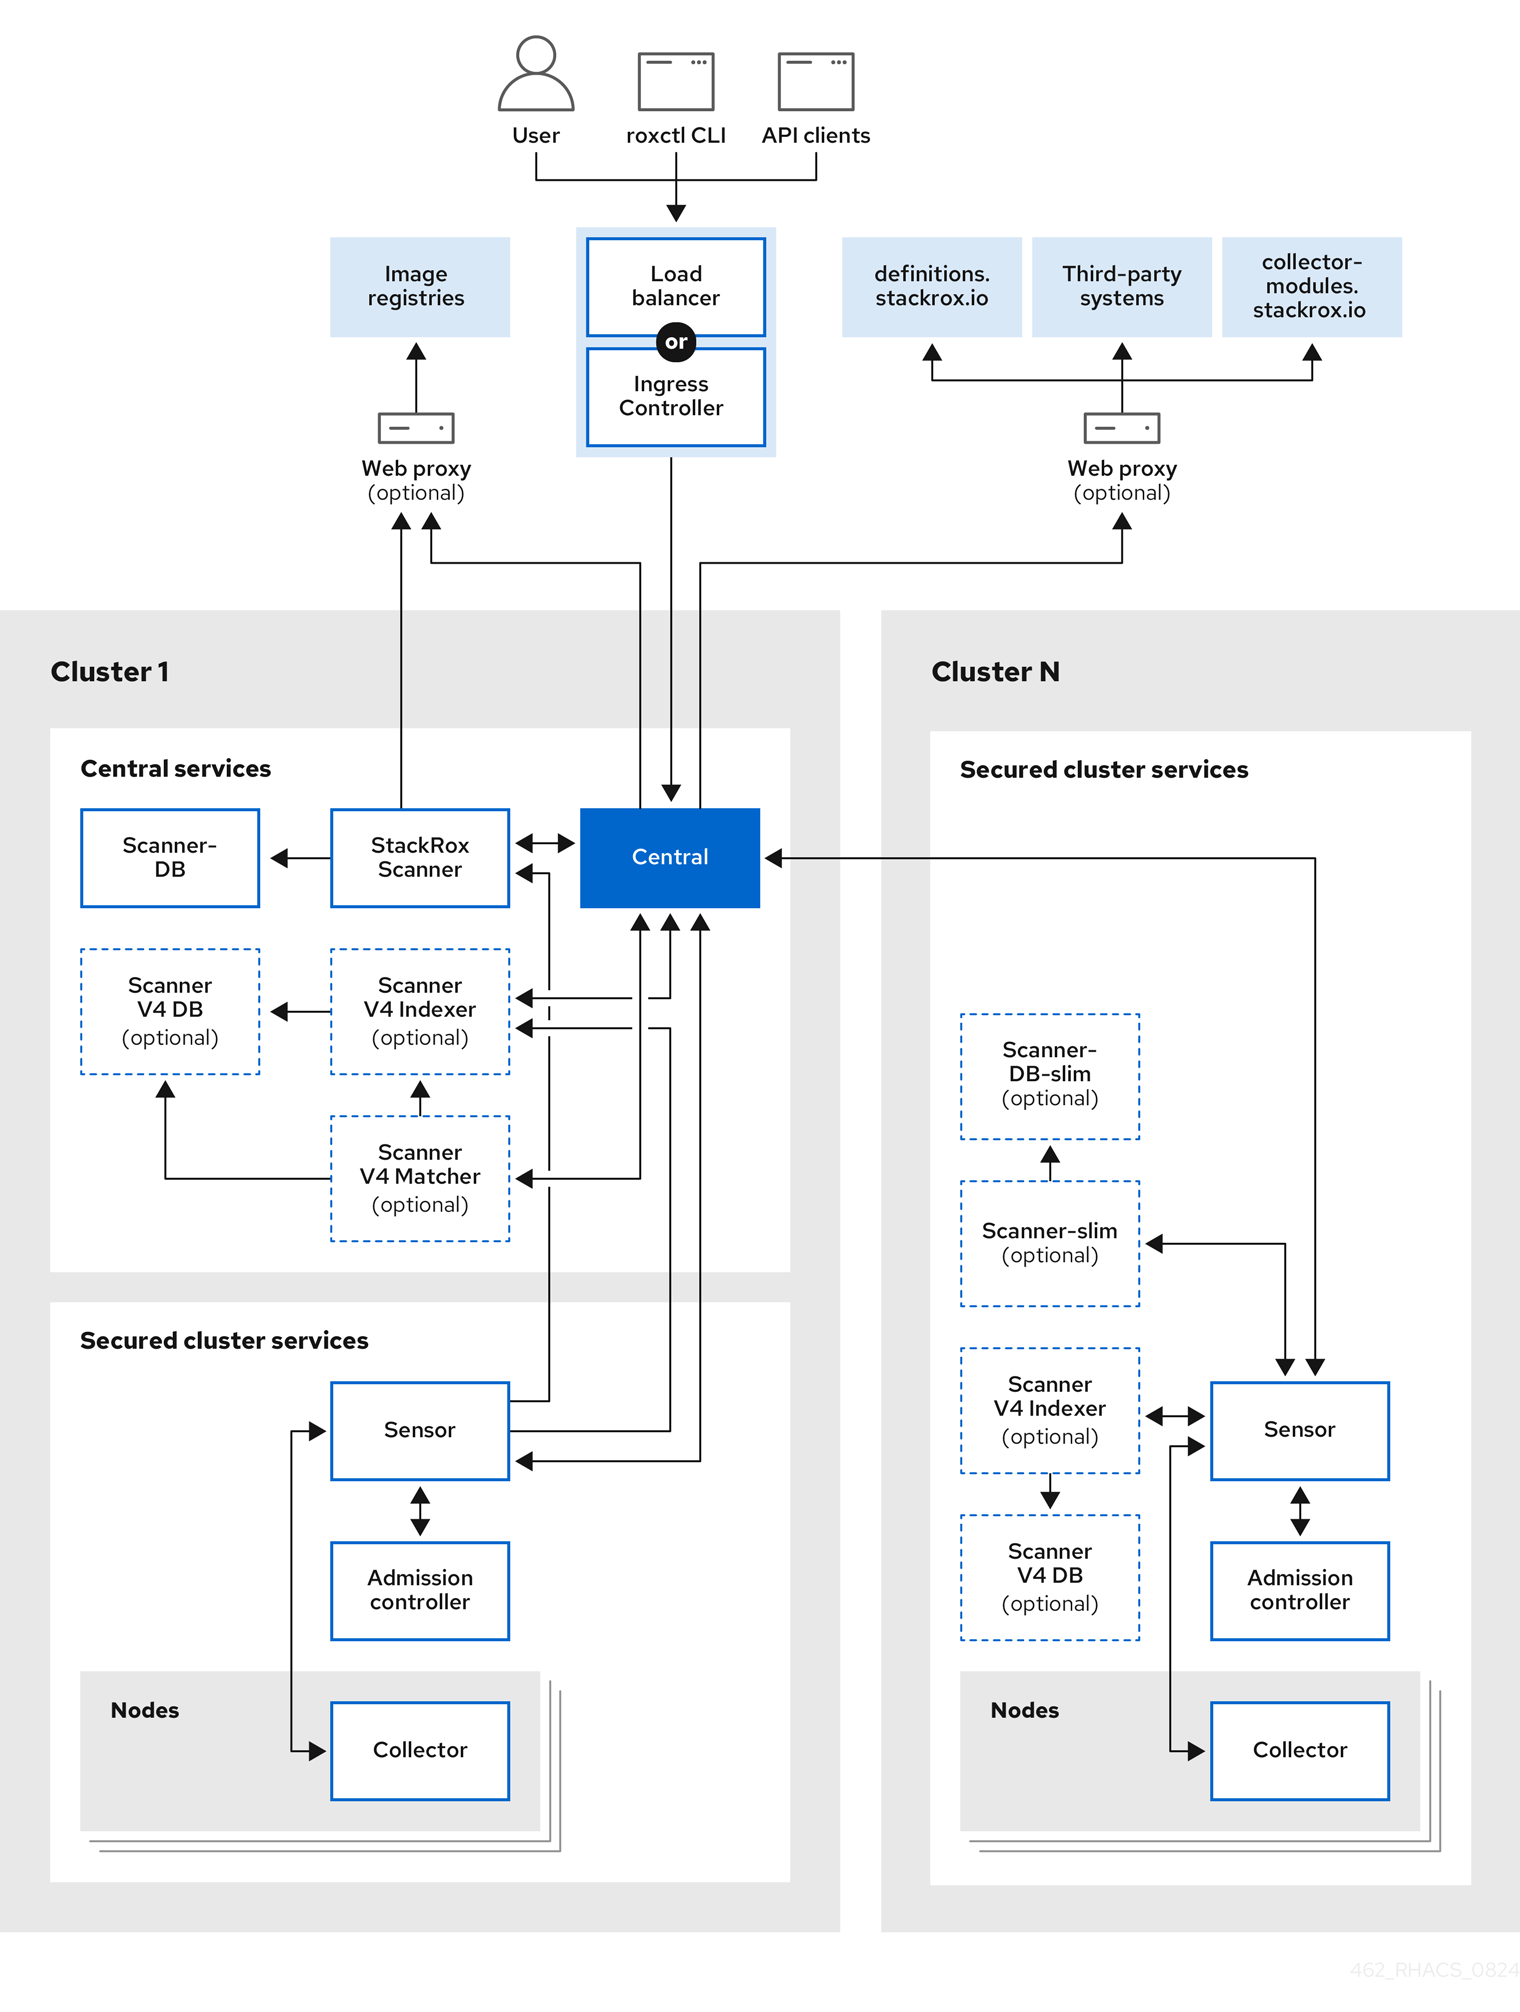
RHACS uses a distributed architecture where Central services manage multiple secured clusters through Sensor agents. For enterprise deployments, you have two primary architectural approaches that will make or break your deployment:

Single Central Hub (Works Until It Doesn't)

  • One Central trying to babysit all your clusters
  • Looks simple until Central dies at 3am and nobody can deploy anything
  • You need serious hardware: 16+ cores, 32+ GB RAM, 1TB+ storage (budget 2x what Red Hat's sizing guide says because it's always wrong)
  • Every cluster needs to phone home on port 443 (good luck with your corporate firewall team)
  • Perfect for teams that like single points of failure and 3am pages

Regional Central Federation (The Adult Option)

  • Multiple Central instances that don't all die simultaneously
  • Each one handles 50-150 clusters before choking (tested this the hard way with 200+ clusters)
  • Actually works when your European data center loses internet connectivity
  • More shit to manage but you won't get fired when one region implodes
  • Mandatory if you have air-gapped clusters or compliance people who actually read frameworks

RHACS Multi-cluster Architecture

Central Placement Strategy

Dedicated Security Cluster (Do This)

  • Put Central on its own cluster so app deployments can't kill your security monitoring
  • When devs break production, your security tools still work
  • Easier to explain to auditors why your security platform is actually secure
  • Size it properly: 3 nodes minimum, 16 vCPU/32GB RAM each (or watch it die under load like mine did last month)
  • Storage will eat your budget: 2TB+ for Central DB, 1TB+ for Scanner (and growing fast - we're at 3TB now)

Shared Management Cluster (The Cheap Option)

  • Cram RHACS onto the same cluster as RHACM to save money
  • Works fine until both tools fight for resources during a security incident
  • Perfect for when your CFO cares more about costs than uptime
  • Requires constant babysitting and resource tuning

Network Architecture (AKA Firewall Hell)

Here's where your network team will hate you. RHACS needs specific ports open and your enterprise firewall rules probably block half of them.

Central to Secured Clusters (The Fun Part):

  • Port 443: Sensors phone home constantly (prepare for "why is there so much traffic?" questions)
  • Port 8443: API access for roxctl and CI/CD (don't forget to document this or your automation will break)

Within Central Cluster (The Easy Part):

  • PostgreSQL: Keep internal (obviously - exposing your security database to the internet is a resume-generating event)
  • Scanner: Keep internal (unless you want vulnerability data leaking to places it shouldn't)
  • Central UI: External access required (good luck with your load balancer configuration and certificate bullshit)

Air-Gapped Deployments (Maximum Pain Mode):

  • Scanner needs to sync vulnerability databases offline (50-100GB of fun)
  • Internal CA certificates that expire at the worst possible moment (usually during vacation)
  • Scanner V4 database mirroring will eat storage like crazy - I've seen it go from 50GB to 200GB in a month
  • Plan for certificate hell and prepare to become best friends with your security team

High Availability Design

Central High Availability:

  • Central StatefulSet with persistent storage (not yet clustered)
  • Database backup strategy: PostgreSQL dumps every 6 hours minimum
  • Recovery time objective: Target 1-4 hours with proper backup/restore procedures
  • Single point of failure: Central DB cannot be clustered yet

Sensor High Availability:

  • Sensors automatically reconnect to Central after network outages
  • Policy cache enables limited offline operation (24-48 hours)
  • Multiple Sensor replicas for large clusters (1000+ nodes)
  • Node affinity to spread Sensors across availability zones

Scanner Architecture at Scale

Scanner V4 vs StackRox Scanner:
Look, Scanner V4 is finally stable enough for production (took them long enough). It's way better than the old scanner, though it'll still peg your CPU when scanning those 2GB images that developers somehow think are reasonable. SBOM generation is required for compliance frameworks - auditors fucking love this feature. Language-specific vulnerability detection covers Go, Java, Node.js, Python, Ruby - basically everything your devs are throwing at production these days.

Delegated Scanning Strategy:

  • Enable Scanner on secured clusters for registry-local images
  • Central Scanner for shared/external registries
  • Reduces network traffic and scanning latency
  • Each secured cluster needs 2-4 CPU cores, 4-8GB RAM for Scanner

Registry Integration Patterns:

Container Registry Security

  • Quay integration: Webhook-based scanning
  • Harbor, Artifactory: API-based integration
  • Air-gapped registries: Manual certificate and credential management

This architectural foundation determines your operational model, scalability limits, and disaster recovery capabilities. With your architecture decided, the next critical question becomes: how much hardware do you actually need to support your deployment scale? The sizing decisions you make now will directly impact your monthly cloud bills and operational complexity.

Enterprise RHACS Sizing Requirements by Scale

Deployment Scale

Central Resources

Central Storage

Scanner Resources

Database Sizing

Monthly Cost Reality Check

50-100 Clusters

8+ vCPU, 16+ GB RAM

500GB+ (grows fast)

4+ vCPU, 8+ GB RAM

PostgreSQL 12, will die without fast storage

Budget for sticker shock

  • your first AWS bill will hurt

100-200 Clusters

16+ vCPU, 32+ GB RAM

1TB+ (budget 2TB)

8+ vCPU, 16+ GB RAM

Dedicated storage or suffer

Depends on cloud provider, region, and how much you hate money

200-500 Clusters

32+ vCPU, 64+ GB RAM

2TB+ (grows to 5TB)

16+ vCPU, 32+ GB RAM

High-performance SSD mandatory

AWS will surprise you, Azure will confuse you, GCP charges for breathing

500+ Clusters

Regional federation

2TB+ per region

Delegated scanning everywhere

Multiple everything

Start saving now

  • enterprise Kubernetes isn't cheap

Production Operations and Monitoring

When you're running RHACS at scale, shit breaks in ways you never imagined. Here's how to keep it running when developers are pushing broken images at 2am and compliance scans decide to eat all your CPU during peak traffic.

Monitoring and Alerting (Or How to Sleep at Night)

Kubernetes Monitoring Dashboard

Shit You Must Monitor or Get Fired:

  • Central health (because when it's down, everything's down)
  • Sensor connectivity (offline sensors = blind spots)
  • Scanner queue depth (when it hits 500+ images, you're screwed)
  • Database performance (PostgreSQL doesn't scale infinitely)
  • Policy violation flood warnings (cryptominers cause alert storms)

Prometheus Metrics Integration:
RHACS exposes metrics that integrate with OpenShift monitoring, standalone Prometheus, and Grafana dashboards. Here's what you actually need to track:

## Key RHACS metrics for alerting
- stackrox_central_db_connections
- stackrox_scanner_queue_length  
- stackrox_sensor_last_contact_time
- stackrox_policy_violations_total
- stackrox_compliance_scan_duration

Grafana Dashboard Requirements:

  • Central cluster resource utilization (CPU, memory, storage)
  • Multi-cluster Sensor status overview
  • Scanner performance metrics and image processing rates
  • Security posture trends and policy violation patterns
  • System health scorecard with SLA metrics

Backup and Disaster Recovery

Central Database Backup Strategy:
Backup your Central database or lose everything. Here's the simple approach that actually works:

## Automated PostgreSQL backup every 6 hours
kubectl exec -n stackrox central-db-0 -- pg_dump -U postgres stackrox > backup-$(date +%Y%m%d-%H%M).sql

Recovery Procedures:

  1. Central Cluster Recovery:

    • Restore Central DB from latest backup
    • Verify Sensor reconnection (automatic within 5 minutes)
    • Validate policy synchronization
  2. Secured Cluster Recovery:

    • Sensors operate with cached policies for 24-48 hours
    • Reinstall Sensor components if cluster rebuilt
    • Historical data may be lost but new monitoring begins immediately

Cross-Region Backup:

  • Database backups stored in multiple availability zones
  • Configuration backup includes policies, integrations, RBAC settings
  • Recovery time objective: 2-4 hours for full Central restoration

Upgrade and Maintenance Procedures

Rolling Upgrade Strategy (Recommended):

  1. Upgrade Central first - maintains backward compatibility with older Sensors
  2. Upgrade Sensors by region/environment - development → staging → production
  3. Validate functionality at each stage before proceeding

Version Compatibility Matrix:

  • Central supports Sensors up to 2 minor versions behind
  • Scanner V4 requires Central and Sensor version alignment
  • Policy compatibility maintained across minor version upgrades

Maintenance Windows:

  • Central upgrades: 30-60 minutes planned downtime
  • Sensor upgrades: Zero-downtime rolling updates
  • Scanner database updates: 10-30 minutes (during upgrade)

Common Operational Challenges and Solutions

Challenge 1: Scanner Performance Bottlenecks
Symptoms: Long image scan queues, delayed CI/CD pipelines
Solutions:

  • Enable delegated scanning on high-volume clusters
  • Implement Scanner cache optimization
  • Scale Scanner V4 horizontally (multiple replicas)
  • Use dedicated high-IOPS storage for Scanner databases

Challenge 2: Policy Alert Fatigue
Symptoms: Thousands of policy violations, ignored alerts
Solutions:

  • Start with "inform" mode policies, gradually enable enforcement
  • Create environment-specific policy sets
  • Use policy exceptions for legitimate business requirements
  • Implement alert prioritization based on risk scores

Challenge 3: Central Database Growth (AKA The Storage Bill from Hell)
Symptoms: AWS storage bills that make your CFO cry, query timeouts during compliance scans

PostgreSQL Performance Monitoring

Real story: Our DB ballooned to like 500GB overnight, maybe more, and AWS started screaming at us about costs. Took us three fucking days to figure out why compliance scans were timing out - turns out nobody configured data retention and we had like 18 months of violation data just sitting there eating storage like a hungry hippo. The whole time executives are asking "why can't we see our security dashboard" while we're trying to vacuum a half-terabyte postgres database.

Solutions:

  • Configure data retention policies (90 days default, not 365 - learned this the expensive way)
  • Archive historical violation data before it bankrupts you
  • Monitor database vacuum jobs or PostgreSQL will shit the bed
  • Plan storage capacity - growth is exponential and will surprise you

Challenge 4: Network Connectivity Issues
Symptoms: Sensors appearing offline, inconsistent policy enforcement
Solutions:

  • Implement network monitoring between clusters and Central
  • Configure proxy settings for air-gapped environments
  • Validate firewall rules for required ports (443, 8443)
  • Set up automated Sensor restart procedures for network outages

Performance Optimization

Central Performance Tuning:

  • PostgreSQL configuration optimization for RHACS workload
  • JVM heap sizing for Central based on cluster count
  • Load balancer configuration for high availability

Scanner Optimization:

  • Image layer caching strategy to reduce registry load
  • Registry mirror placement for geographic distribution
  • Scanner database indexing optimization

Network Optimization:

  • Sensor communication batching and compression
  • Policy update distribution optimization
  • Event aggregation to reduce Central load

These operational practices ensure RHACS maintains security effectiveness as your Kubernetes environment scales. But even with solid operations, you'll face specific deployment challenges that every enterprise team encounters. Let's address the most common questions and gotchas that come up during real-world RHACS implementations.

Enterprise RHACS Deployment Questions

Q

How do I size Central without wasting money or having it crash?

A

Start with 16 vCPU/32GB and watch it like a hawk for the first month. RHACS resource usage is spiky and unpredictable - compliance scans will randomly spike CPU to 100% on Fridays when everyone deploys.But honestly? It depends on your workload. I've seen 8 cores handle 200 clusters and 32 cores choke on 50. Kubernetes is weird like that.Monitor these during your first few weeks:

  • CPU during compliance scans (always happens at the worst time)
  • Memory when policy violations flood in (like when someone deploys a cryptominer)
  • Database IOPS when Scanner V4 decides to scan 500 images simultaneously

Scale up when you hit 70% CPU average or when Central starts timing out. In my experience, 16 vCPU handles about 100-120 clusters before you start seeing weird timeout errors. Your mileage will definitely vary.

Q

What's the real bandwidth hit from this thing?

A

Sensor chatter to Central is pretty light

  • 50-100 Kbps per cluster most of the time, spikes to 1-2 Mbps when policies update or someone triggers a compliance scan.The real bandwidth killer is image scanning. Central Scanner pulling images from remote registries will eat 100 Mbps to 1 Gbps easily, especially if devs are pushing large images constantly. Enable delegated scanning or your network team will ask why their circuits are saturated.
Q

Cloud Service or self-managed? (AKA how much pain do you want?)

A

Self-managed if you hate yourself and love 3am pages. Cloud Service if you want Red Hat to deal with the operational nightmare.For 200+ clusters, self-managed usually wins on cost

  • but I can't give you exact pricing because Red Hat changes it every quarter and your sales rep will lie to you anyway. Self-managed means you're responsible when Central dies on Sunday morning and nobody can deploy.If you already have Open

Shift Platform Plus, self-managed is often cheaper and your compliance team will be happier. This worked at my last company, might explode at yours

  • enterprise licensing is dark magic.
Q

How do I handle policy enforcement across different environments?

A

Create environment-specific policy sets using policy scopes or watch developers throw tantrums when prod policies break their broken code. Development clusters get "inform" mode policies for learning (they won't read them), staging gets "enforce" for testing (they'll find workarounds), production gets strict enforcement (where the real fun begins). Use cluster labels and annotations to automatically apply the right policy set. Start with 10-15 core policies and expand based on violation patterns

  • you'll get plenty of violations to work with.
Q

What's the disaster recovery strategy for a federated Central setup?

A

Each regional Central maintains independent databases, so failure of one region doesn't affect others. Backup strategies include:

  • Automated PostgreSQL backups every 4 hours to object storage
  • Cross-region backup replication for critical configurations
  • Policy and RBAC configuration exported as YAML for version control
  • 2-4 hour RTO for Central restoration, Sensors reconnect automatically

Practice recovery procedures quarterly - Central database corruption is the primary failure mode.

Q

How do I manage RBAC across 500+ clusters efficiently?

A

Use OpenShift Group Sync or similar identity provider integration to maintain consistent groups across clusters. RHACS inherits Kubernetes RBAC, so standardized group mappings work automatically. Create role templates for common access patterns (security engineer, developer, cluster admin) and apply consistently. Avoid cluster-specific RBAC customization

  • it doesn't scale.
Q

What monitoring tools integrate well with RHACS at enterprise scale?

A

RHACS metrics integrate natively with Prometheus and Grafana. For enterprise monitoring stacks:

  • Splunk: Forward violation logs via syslog or API integration
  • Datadog: Custom metrics ingestion from RHACS API
  • ELK Stack: JSON-formatted logs work well with Logstash
  • ServiceNow: Security incident integration via webhooks

The built-in dashboards are useful but you'll want custom dashboards for executive reporting and SLA tracking.

Q

How do I optimize Scanner performance for large image repositories?

A

Enable Scanner V4 - it's faster than the legacy StackRox Scanner. For high-volume environments:

  • Deploy dedicated Scanner instances per major registry
  • Use high-IOPS SSD storage for Scanner databases
  • Configure registry mirrors geographically close to Scanner instances
  • Implement image layer caching to reduce duplicate scanning

Budget 50-100GB for Scanner V4 vulnerability database plus image cache storage.

Q

What are the common security hardening requirements for production Central?

A

Standard Kubernetes security practices apply, plus RHACS-specific hardening:

  • Network policies restricting Central cluster ingress to required ports only
  • Pod Security Standards enforcing restricted profile for all RHACS components
  • Regular database backup encryption and access auditing
  • Dedicated service accounts with minimal required permissions
  • Certificate rotation automation for inter-component TLS

Run the RHACS built-in compliance scans against the Central cluster itself - it should pass CIS Kubernetes benchmarks.

Q

How do I handle compliance reporting across multiple business units?

A

Use RHACS compliance reporting with cluster groupings by business unit. Export compliance data via API for custom reporting tools. Most enterprises create:

  • Executive dashboards with high-level compliance scores
  • Technical reports with detailed violation breakdowns
  • Trend analysis showing improvement over time
  • Exception tracking for approved deviations

The built-in reports cover PCI DSS, NIST, CIS benchmarks - sufficient for most compliance frameworks.With operational knowledge and common implementation challenges covered, there's one final critical area that determines whether your RHACS deployment will survive in production: security hardening. Because nothing's more embarrassing than getting breached through your own security platform.

Security Hardening (Securing the Thing That Secures Things)

Your security platform has the keys to everything. If someone compromises RHACS Central, they can see every vulnerability, every policy violation, and every cluster configuration. Don't be the team that gets breached through their own security tool - I've seen this happen and the post-mortem is fucking embarrassing.

Here's how to not fuck this up:

Central Cluster Security Hardening

Container Security Architecture

Network Segmentation (Build a Fucking Moat):
Lock down Central cluster networking like it contains nuclear launch codes:

## Ports you MUST have open (and nothing else)
- Port 443: Sensors, UI, API (unavoidable)
- Port 8443: roxctl/CI/CD access (document this well)
- Port 5432: PostgreSQL (internal only - expose this and die)
- Port 22: SSH (bastion host only - no direct access)

Pod Security Standards:
Apply restricted Pod Security Standards to the RHACS namespace following Kubernetes security best practices:

apiVersion: v1
kind: Namespace
metadata:
  name: stackrox
  labels:
    pod-security.kubernetes.io/enforce: restricted
    pod-security.kubernetes.io/audit: restricted
    pod-security.kubernetes.io/warn: restricted

Resource Quotas and Limits:
Prevent resource exhaustion attacks with proper limits:

apiVersion: v1
kind: ResourceQuota
metadata:
  name: rhacs-quota
  namespace: stackrox
spec:
  hard:
    limits.cpu: "64"
    limits.memory: "128Gi"
    persistentvolumeclaims: "10"
    requests.storage: "5Ti"

Certificate Management and TLS

Custom CA Integration:
For air-gapped environments, configure RHACS to trust internal certificate authorities:

## Add custom CA to Central
kubectl create configmap custom-ca --from-file=ca.crt=internal-ca.crt -n stackrox
kubectl patch deployment central -n stackrox -p '{"spec":{"template":{"spec":{"volumes":[{"name":"custom-ca","configMap":{"name":"custom-ca"}}]}}}}'

Certificate Rotation:
Set up automated certificate rotation or prepare for 3am certificate expiry emergencies:

  • Central TLS certificates: 90-day rotation cycle (or whenever they expire and break everything)
  • Sensor client certificates: Central handles this automatically (one less thing to break)
  • Scanner TLS certificates: Sync with Central rotation or suffer
  • Database TLS certificates: Annual rotation is fine (unless your security team has opinions)

Identity and Access Management

RBAC Integration:
Hook RHACS into your corporate identity nightmare (LDAP, AD, OAuth - pick your poison). Follow standard RBAC practices for secure authentication, assuming your enterprise identity system actually works:

## Example RHACS role for security engineers
apiVersion: platform.stackrox.io/v1alpha1
kind: Role
metadata:
  name: security-engineer
rules:
- resources: ["Alert", "Policy", "Compliance"]
  verbs: ["read", "write"]
- resources: ["Cluster", "Deployment"]
  verbs: ["read"]

Service Account Security:
Follow principle of least privilege for all service accounts:

  • Central service account: Minimal cluster-admin permissions
  • Sensor service accounts: Namespace-scoped read/write only
  • Scanner service accounts: Image pull and storage access only

API Access Controls:
Secure RHACS API access for automation and integrations:

  • Use API tokens with limited scope and expiration
  • Implement API rate limiting to prevent abuse
  • Log all API access for security auditing
  • Rotate API tokens every 90 days

Monitoring and Incident Response

Security Monitoring Dashboard

Security Event Monitoring:
Configure comprehensive logging and monitoring for RHACS itself using OpenShift logging and enterprise SIEM integration:

## Forward RHACS logs to central logging
apiVersion: logging.coreos.com/v1
kind: ClusterLogForwarder
metadata:
  name: rhacs-logs
spec:
  outputs:
  - name: rhacs-siem
    type: splunk
    url: https://splunk.company.com:8088
  pipelines:
  - name: rhacs-security-logs
    inputRefs:
    - application
    filterRefs:
    - rhacs-filter
    outputRefs:
    - rhacs-siem

Incident Response Integration:
Integrate RHACS with enterprise incident response processes following standard frameworks:

  • Configure high-severity policy violations to create ServiceNow or Jira tickets automatically
  • Set up on-call escalation using PagerDuty or Opsgenie for Central/Scanner service failures
  • Define runbooks for common operational scenarios
  • Test disaster recovery procedures quarterly using chaos engineering principles

Compliance and Governance

Audit Trail Requirements:
Maintain comprehensive audit trails for compliance:

  • All policy changes and approvals
  • Access control modifications
  • System configuration changes
  • Security violation acknowledgments and exceptions

Policy Governance:
Establish formal policy management processes:

  • Security team approval required for policy changes
  • Change management process for production policy updates
  • Regular policy review and tuning cycles
  • Documentation of business justifications for policy exceptions

Data Retention and Privacy:
Configure appropriate data retention for compliance requirements:

## Configure retention in Central
apiVersion: v1
kind: ConfigMap
metadata:
  name: central-config
  namespace: stackrox
data:
  retention.yaml: |
    alertRetentionDays: 30
    imageRetentionDays: 7
    auditLogRetentionDays: 90

Performance and Reliability

High Availability Configuration:
While Central itself is not clustered, implement reliability practices:

  • Database replication for read replicas (if needed for reporting)
  • Automated backup testing and validation
  • Health check endpoints for load balancer integration
  • Graceful degradation during maintenance windows

Capacity Planning:
Monitor and plan for growth patterns:

  • Track cluster onboarding rates and resource impact
  • Monitor policy violation trends and storage growth
  • Plan scanner capacity for peak scanning periods
  • Establish metrics-based alerting for resource exhaustion

Disaster Recovery Testing:
Regularly test disaster recovery procedures:

  • Complete Central cluster rebuild from backups
  • Network partition scenarios between Central and Sensors
  • Database corruption and recovery procedures
  • Cross-region failover for federated deployments

Integration Security

CI/CD Pipeline Security:
Secure RHACS integrations with development toolchains following DevSecOps best practices:

  • Use dedicated service accounts with limited permissions per principle of least privilege
  • Implement break-glass procedures for emergency deployments
  • Monitor scanner API usage with Prometheus alerting rules for anomalous patterns
  • Regular security review of pipeline integrations using OWASP DevSecOps guidelines

This comprehensive security foundation ensures RHACS itself remains protected while providing security oversight for your Kubernetes infrastructure. You now have the complete picture: architecture decisions, resource sizing, operational procedures, and security hardening. The final piece is knowing where to go for additional resources and support as you implement these enterprise deployment practices.

Enterprise Implementation Resources

Related Tools & Recommendations

tool
Similar content

LangChain Production Deployment Guide: What Actually Breaks

Learn how to deploy LangChain applications to production, covering common pitfalls, infrastructure, monitoring, security, API key management, and troubleshootin

LangChain
/tool/langchain/production-deployment-guide
100%
tool
Similar content

Helm Troubleshooting Guide: Fix Deployments & Debug Errors

The commands, tools, and nuclear options for when your Helm deployment is fucked and you need to debug template errors at 3am.

Helm
/tool/helm/troubleshooting-guide
85%
tool
Similar content

Qwik Production Deployment: Edge, Scaling & Optimization Guide

Real-world deployment strategies, scaling patterns, and the gotchas nobody tells you

Qwik
/tool/qwik/production-deployment
74%
tool
Similar content

ArgoCD Production Troubleshooting: Debugging & Fixing Deployments

The real-world guide to debugging ArgoCD when your deployments are on fire and your pager won't stop buzzing

Argo CD
/tool/argocd/production-troubleshooting
71%
tool
Similar content

Bolt.new Production Deployment Troubleshooting Guide

Beyond the demo: Real deployment issues, broken builds, and the fixes that actually work

Bolt.new
/tool/bolt-new/production-deployment-troubleshooting
71%
tool
Similar content

Development Containers - Production Deployment Guide

Got dev containers working but now you're fucked trying to deploy to production?

Development Containers
/tool/development-containers/production-deployment
71%
tool
Similar content

Google Cloud Run: Deploy Containers, Skip Kubernetes Hell

Skip the Kubernetes hell and deploy containers that actually work.

Google Cloud Run
/tool/google-cloud-run/overview
71%
tool
Similar content

Helm: Simplify Kubernetes Deployments & Avoid YAML Chaos

Package manager for Kubernetes that saves you from copy-pasting deployment configs like a savage. Helm charts beat maintaining separate YAML files for every dam

Helm
/tool/helm/overview
69%
tool
Similar content

GitLab CI/CD Overview: Features, Setup, & Real-World Use

CI/CD, security scanning, and project management in one place - when it works, it's great

GitLab CI/CD
/tool/gitlab-ci-cd/overview
65%
troubleshoot
Similar content

Docker Container Breakout Prevention: Emergency Response Guide

Learn practical strategies for Docker container breakout prevention, emergency response, forensic analysis, and recovery. Get actionable steps for securing your

Docker Engine
/troubleshoot/docker-container-breakout-prevention/incident-response-forensics
62%
tool
Similar content

AWS AI/ML Cost Optimization: Cut Bills 60-90% | Expert Guide

Stop AWS from bleeding you dry - optimization strategies to cut AI/ML costs 60-90% without breaking production

Amazon Web Services AI/ML Services
/tool/aws-ai-ml-services/cost-optimization-guide
60%
tool
Similar content

SvelteKit Deployment Troubleshooting: Fix Build & 500 Errors

When your perfectly working local app turns into a production disaster

SvelteKit
/tool/sveltekit/deployment-troubleshooting
60%
tool
Similar content

Jenkins Production Deployment Guide: Secure & Bulletproof CI/CD

Master Jenkins production deployment with our guide. Learn robust architecture, essential security hardening, Docker vs. direct install, and zero-downtime updat

Jenkins
/tool/jenkins/production-deployment
60%
tool
Similar content

HTMX Production Deployment - Debug Like You Mean It

Master HTMX production deployment. Learn to debug common issues, secure your applications, and optimize performance for a smooth user experience in production.

HTMX
/tool/htmx/production-deployment
56%
alternatives
Similar content

Lightweight Kubernetes Alternatives: K3s, MicroK8s, & More

Explore lightweight Kubernetes alternatives like K3s and MicroK8s. Learn why they're ideal for small teams, discover real-world use cases, and get a practical g

Kubernetes
/alternatives/kubernetes/lightweight-orchestration-alternatives/lightweight-alternatives
56%
tool
Similar content

pyenv-virtualenv Production Deployment: Best Practices & Fixes

Learn why pyenv-virtualenv often fails in production and discover robust deployment strategies to ensure your Python applications run flawlessly. Fix common 'en

pyenv-virtualenv
/tool/pyenv-virtualenv/production-deployment
56%
tool
Similar content

Fix Astro Production Deployment Nightmares: Troubleshooting Guide

Troubleshoot Astro production deployment issues: fix 'JavaScript heap out of memory' build crashes, Vercel 404s, and server-side problems. Get platform-specific

Astro
/tool/astro/production-deployment-troubleshooting
56%
integration
Similar content

Prometheus, Grafana, Alertmanager: Complete Monitoring Stack Setup

How to Connect Prometheus, Grafana, and Alertmanager Without Losing Your Sanity

Prometheus
/integration/prometheus-grafana-alertmanager/complete-monitoring-integration
54%
tool
Similar content

uv Docker Production: Best Practices, Troubleshooting & Deployment Guide

Master uv in production Docker. Learn best practices, troubleshoot common issues (permissions, lock files), and use a battle-tested Dockerfile template for robu

uv
/tool/uv/docker-production-guide
51%
tool
Similar content

Open Policy Agent (OPA): Centralize Authorization & Policy Management

Stop hardcoding "if user.role == admin" across 47 microservices - ask OPA instead

/tool/open-policy-agent/overview
49%

Recommendations combine user behavior, content similarity, research intelligence, and SEO optimization