Why Honeycomb Actually Works When Other Tools Don't

Honeycomb BubbleUp Interface

API was running like garbage. Spent 4 hours debugging just to find out one customer had some fucked up edge case data. That's exactly the shit that Charity Majors and her team at Honeycomb got tired of dealing with. They built something that actually helps you debug instead of just pretty dashboards that tell you everything's broken.

The Real Problem With Traditional Monitoring

Traditional monitoring tools make you predict what you'll need to monitor, which is complete bullshit. You set up dashboards for CPU, memory, response time - the usual suspects. Then at 3am when production melts down, you're frantically switching between Grafana, ELK stack, and Jaeger wondering what the fuck happened while your users are tweeting about how your app is garbage.

The problem isn't that these tools suck - they don't. The problem is they force you to pre-aggregate data. So when something weird happens (and weird shit ALWAYS happens in production), you don't have the context you need. You're basically debugging blindfolded.

Had this weird memory leak. Only happened weekends, took us forever to figure out why. Turns out our Saturday batch job was doing something stupid with active user sessions that nobody expected. Traditional metrics would have never caught that correlation.

How Honeycomb's Events Actually Work

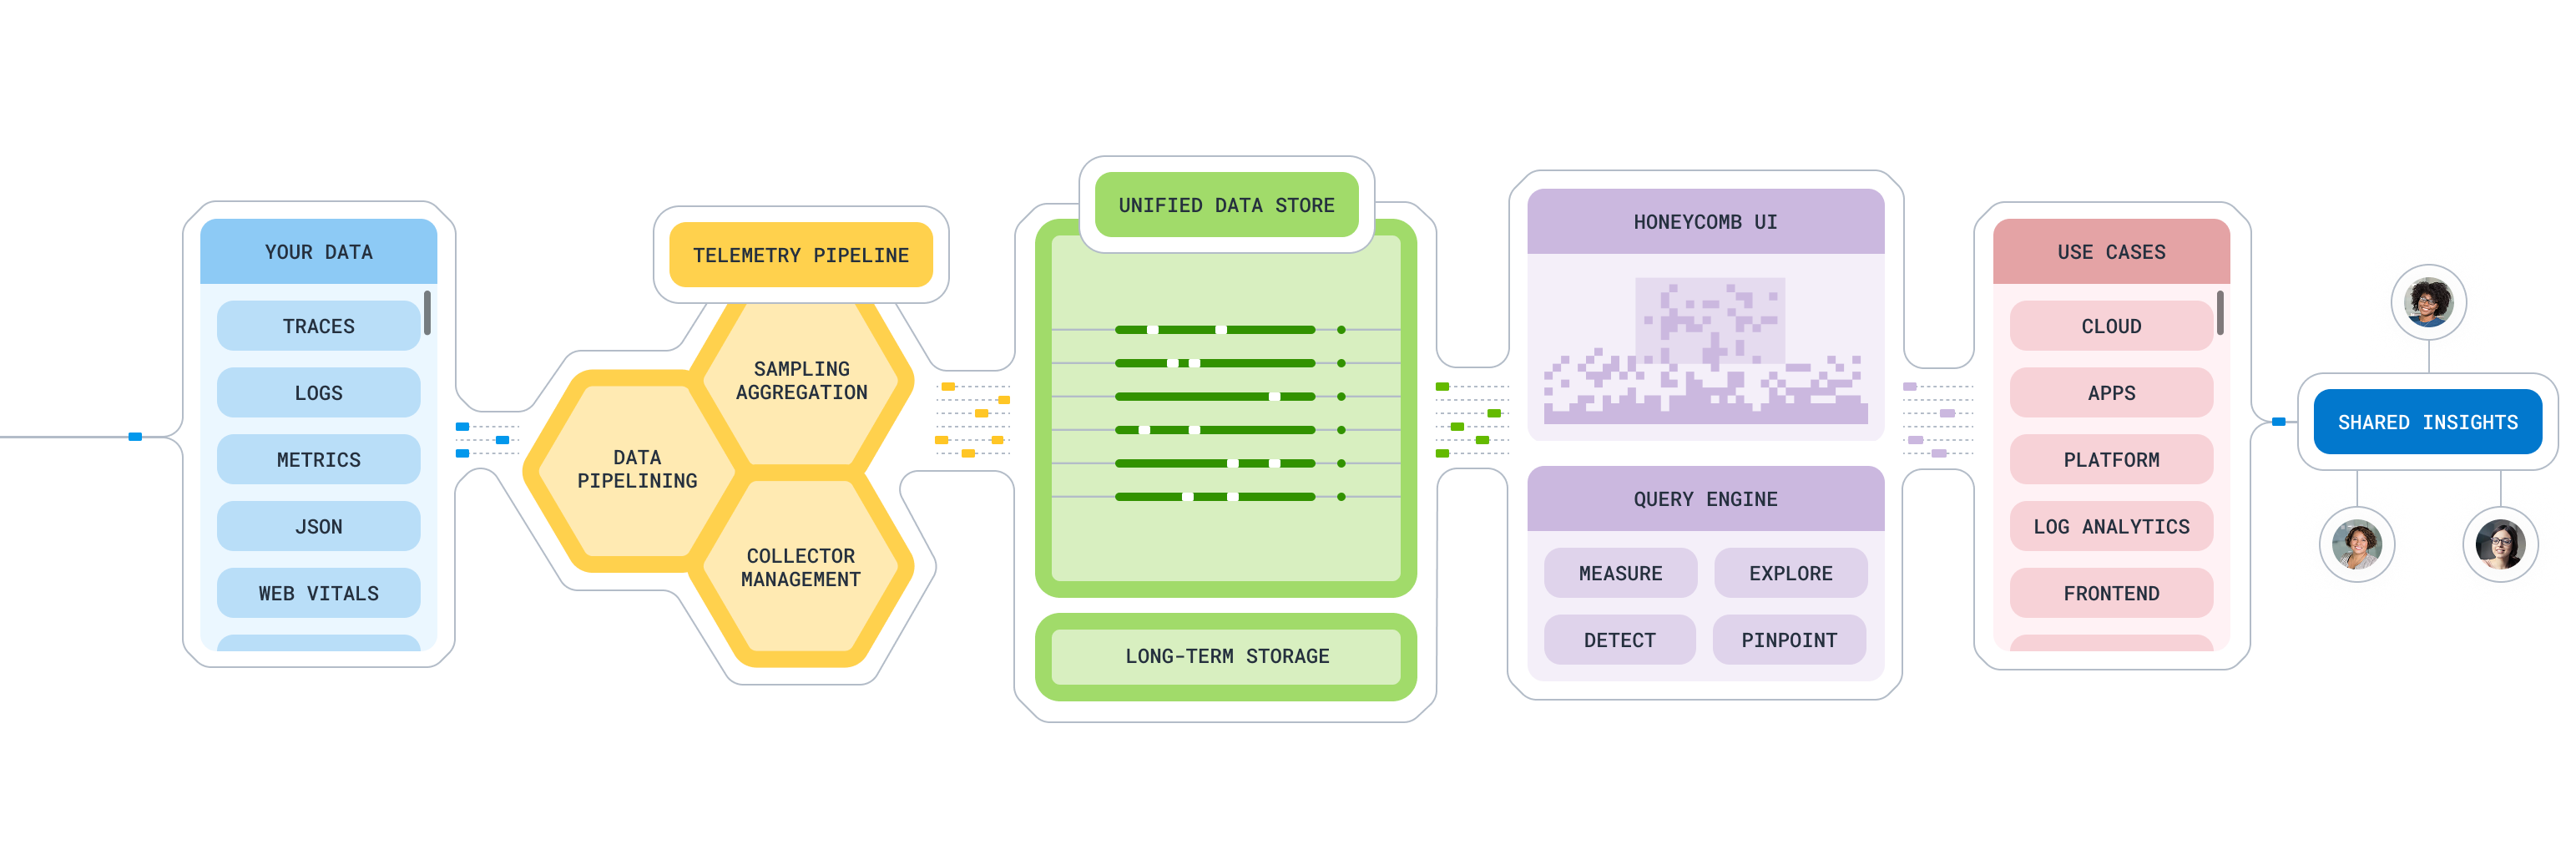
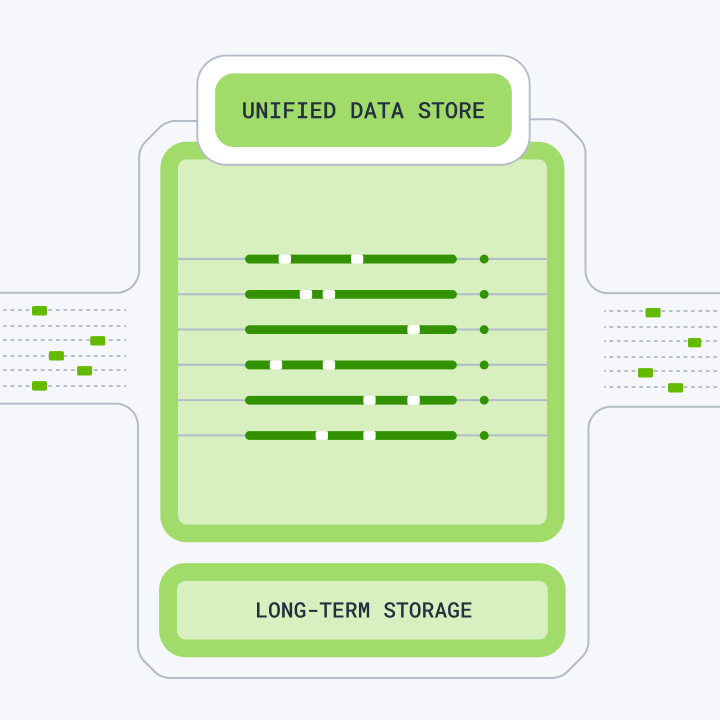
Instead of forcing you to choose between logs, metrics, or traces, Honeycomb stores everything as structured "wide events" that can contain hundreds or thousands of attributes. Think of it like this: instead of having separate time series for CPU, memory, request duration, user ID, feature flag state, etc., you get one event with ALL that context.

This means you can:

  • Query billions of events in under 3 seconds (no, seriously)
  • Ask questions you didn't think to ask beforehand
  • Correlate anything with anything else without joins or complex queries
  • Actually find the needle in the haystack instead of guessing

The first time I queried a billion events and got results instantly, I thought it was cached. Nope, that's just how their storage engine works.

Features That Don't Suck

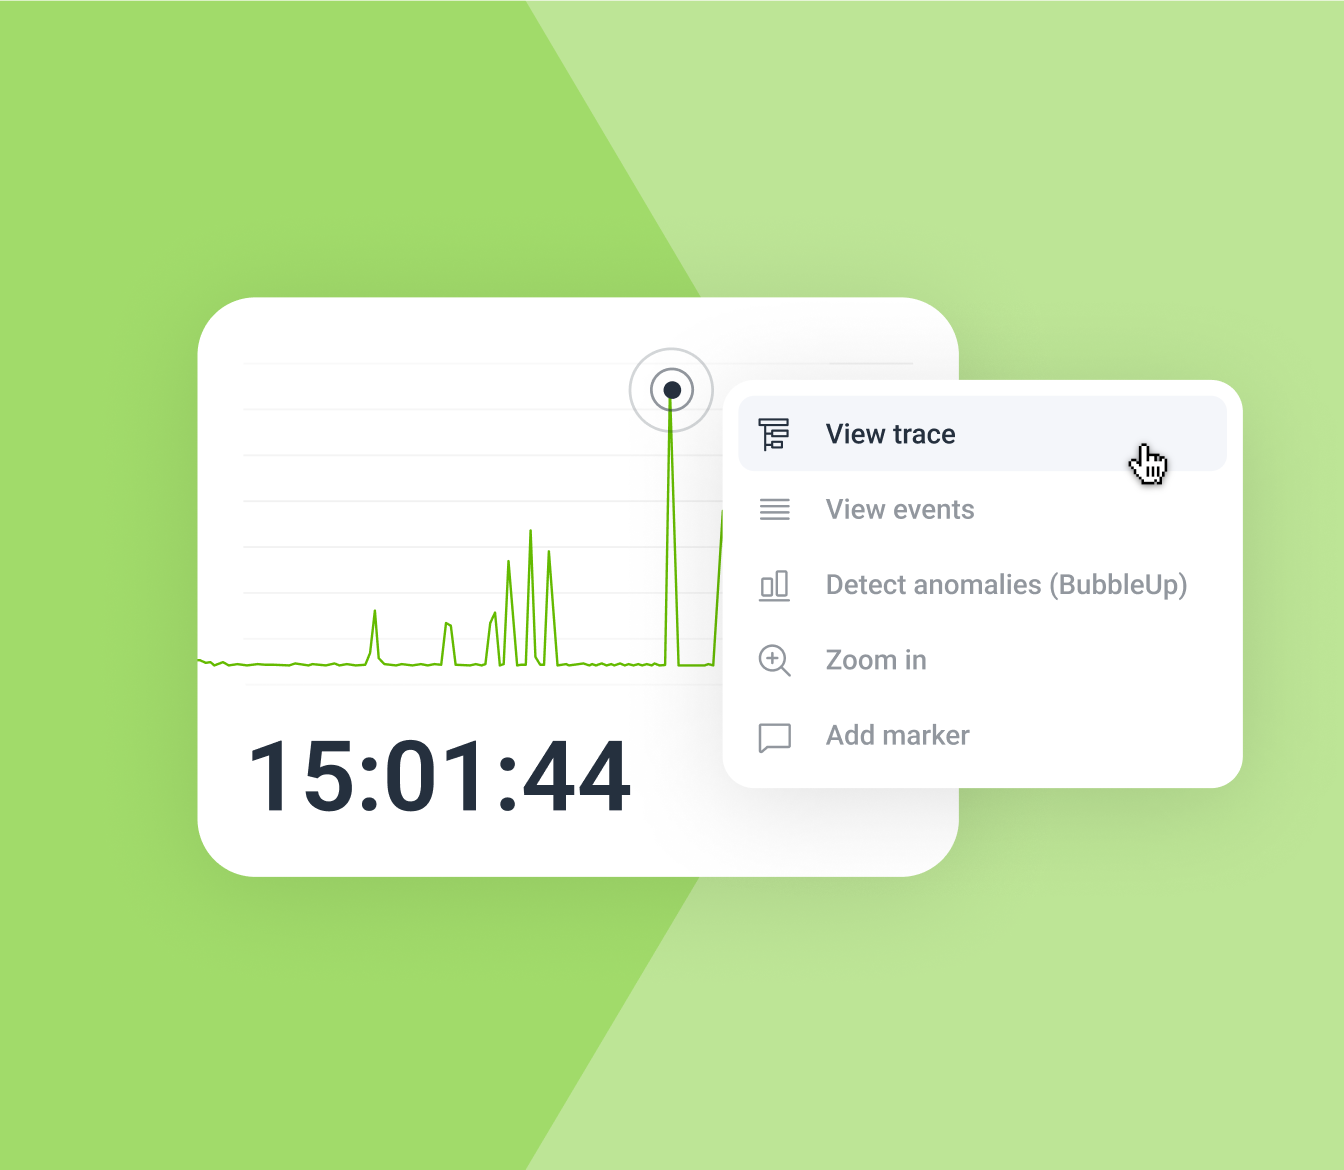
BubbleUp - The Thing That Finds Weird Shit

BubbleUp automatically finds unusual patterns in your data. Not "CPU is high" but "CPU is high specifically for requests from mobile users in the EU using feature flag X." It shows you exactly which combinations of attributes are behaving abnormally.

I've used it to find everything from a memory leak caused by a specific browser version to performance issues that only affected users with names starting with 'Q' (don't ask, long story involving a really dumb caching bug).

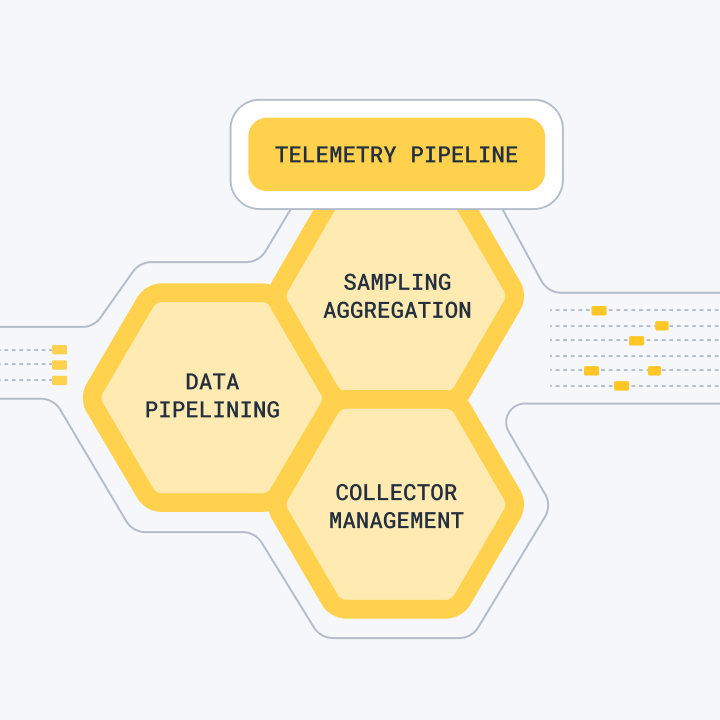
OpenTelemetry Integration That Actually Works

As a native OpenTelemetry platform, Honeycomb supports 40+ languages without the usual configuration nightmare. Unlike other tools that claim OTel support but make you jump through hoops, Honeycomb was literally built for it.

Setup takes 10 minutes instead of the usual 3-day configuration nightmare. The automatic instrumentation actually works, which is more than I can say for most APM tools.

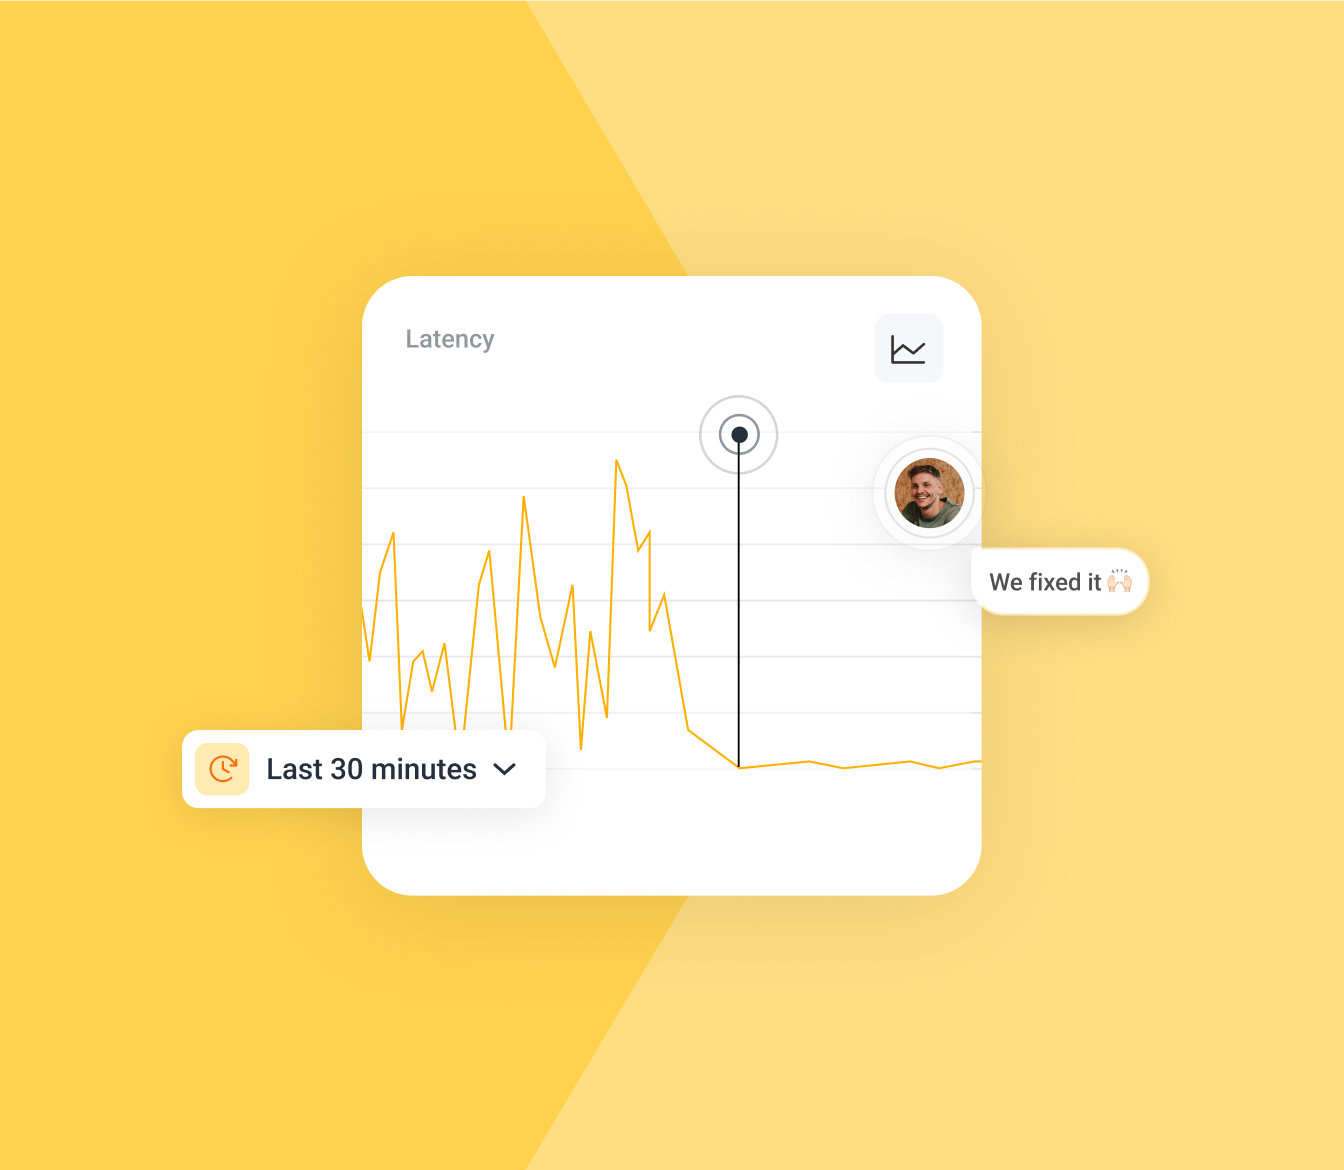
SLOs That You Can Actually Debug

Their SLO functionality isn't just pretty charts. When your error rate spikes, you can click through and see exactly why. Is it a specific endpoint? Certain user cohort? Database timeout? You get answers, not more questions.

Who Actually Uses This

Companies like Dropbox use Honeycomb because their engineers got tired of debugging production with multiple tools that don't talk to each other. These aren't companies with unlimited budgets throwing money at problems - they're engineering-first organizations that need shit that actually works when production is burning down and users are pissed.

If you've ever been woken up at 3am by a production issue and spent 2 hours switching between different monitoring tools trying to figure out what broke, Honeycomb is for you.

Current Status: Gartner Recognition

As of September 2025, Honeycomb has been recognized as a Visionary in the 2025 Gartner Magic Quadrant for Observability Platforms. What this really means is that even the Gartner analyst crowd is starting to realize that maybe storing pre-aggregated metrics isn't the best approach for debugging modern distributed systems. About fucking time.

How Honeycomb Stacks Up Against the Competition

Feature

Honeycomb

Datadog

New Relic

Dynatrace

Pricing Model

Event-based ($130/month for 100M events)

Host/container-based (~$15/host/month)

Data ingest-based (~$0.30/GB)

Host-based (~$69/host/month)

Data Storage Approach

Wide events (unlimited dimensions)

Pre-aggregated metrics + logs

Time-series metrics + events

AI-processed observability data

Query Performance

Sub-3-second queries on billions of events

Fast on pre-aggregated data only

Variable (often slow on complex queries)

Real-time with AI acceleration

OpenTelemetry Support

✅ Actually works out of the box

⚠️ Works but requires their agent

⚠️ Supported with heavy configuration

⚠️ Supported via proprietary OneAgent

Anomaly Detection

BubbleUp finds real patterns

Watchdog (lots of false positives)

Applied Intelligence (hit or miss)

Davis AI (decent but opaque)

Custom Metrics

✅ Unlimited at no extra cost

❌ Will bankrupt you

❌ Expensive per GB

❌ Limited by host licensing

High-Cardinality Data

✅ Handles millions of dimensions

❌ Performance degrades fast

❌ Expensive and slow

✅ Handled automatically

Learning Curve

Moderate (query-based, logical)

Steep (overwhelming UI)

Moderate (familiar but limited)

Moderate (AI does the thinking)

Best For

Engineers who debug production

DevOps teams with unlimited budgets

Traditional shops with simple needs

Enterprises with money to burn

The Technical Reality: How Honeycomb Handles Your Data

Honeycomb Architecture Diagram

Storage Engine That Actually Works for High-Cardinality Data

Most APM tools shit the bed when you have high-cardinality data. Add a user ID to your metrics? Suddenly your Prometheus queries timeout and your Grafana dashboards look like they're having a stroke.

Honeycomb built their storage engine specifically for observability workloads. It's columnar, it's fast, and it doesn't choke when you add a bunch of dimensions. Unlike InfluxDB or other time-series databases that have cardinality limits, Honeycomb's architecture maintains consistent performance whether you have 10 attributes or 1,000.

Wide Events: Why This Approach Doesn't Suck

Each event can contain up to 2,000 attributes and up to 1MB per event. Think of it like a really wide database row with all your context in one place instead of normalized across multiple tables.

This means:

  • No joins needed to correlate data (anyone who's tried to join logs with metrics knows this pain)
  • Full context preservation (you don't lose information to aggregation)
  • Query everything together instead of switching between tools

I can query user sessions, database performance, feature flags, and error rates all in one query. Try doing that with traditional monitoring.

Deployment: SaaS Without the Usual Pain

Honeycomb is SaaS-only, which means no 3am maintenance windows to upgrade your monitoring infrastructure. It's hosted on AWS with SOC 2 Type II certification and a 99.9% uptime SLA for enterprise customers.

They offer AWS PrivateLink if you're paranoid about network isolation, and they have global data centers so your telemetry doesn't have to travel across the world.

OpenTelemetry Setup That Doesn't Make You Want to Die

OpenTelemetry Integration

Unlike other tools that claim OpenTelemetry support but make you wrestle with configuration files for days, Honeycomb was literally built for OTel. Their auto-instrumentation actually works.

Languages that just work:

  • Go, Java, Python, Node.js, .NET, Ruby, PHP (backend)
  • React, Angular, Vue.js with their browser SDK
  • Kubernetes, Docker, AWS/GCP/Azure integrations

Setup time: 10 minutes if you're lucky, 2 hours if you're not. Compare that to the usual week-long Prometheus + Grafana + Jaeger setup nightmare.

Gotcha alert: If you're on recent Kubernetes, use the latest OTel Collector or you'll get weird permission errors. Don't ask how I know this.

Another gotcha: EKS with Fargate was broken for a while - should work now but test it first. Took me a week to figure that shit out.

Performance: Sub-3-Second Queries That Aren't Marketing BS

When they say "sub-3-second queries on billions of events," they actually mean it. I've thrown 100GB datasets at it and gotten results faster than Splunk returns "still thinking...".

Real-world performance:

  • Querying massive datasets: stupid fast
  • Complex aggregations: faster than you'd expect from other tools
  • Joining data across multiple services: instant (because it's all in one event)

Why it's fast:

  • Columnar storage optimized for analytical queries
  • No pre-aggregation overhead (unlike Datadog which pre-computes everything)
  • Smart indexing that adapts to your query patterns.

Data Management Without Bullshit

Retention: 60 days standard, extended retention for enterprise. Unlike other tools that charge you per GB of retention, Honeycomb's pricing is event-based.

Security: Encryption everywhere, fine-grained access controls, GDPR compliance if that's your thing. No sampling for security-sensitive environments (looking at you, New Relic with your aggressive sampling).

Real-time availability: Data shows up immediately, no waiting for indexing like with ELK stack.

Advanced Features for When You Get Serious

Telemetry Pipeline

Honeycomb Telemetry Pipeline lets you transform, enrich, and route data before it hits storage. Think of it like Vector but specifically designed for observability data.

Use cases:

  • Dropping PII before it hits storage (because lawyers)
  • Enriching events with business context
  • Sampling high-volume but low-value data
  • Multi-destination routing for hybrid architectures

Refinery for Cost Control

Refinery is their intelligent sampling proxy. Instead of randomly dropping 90% of your traces, it preserves interesting ones and drops boring ones.

Sampling strategies:

  • Tail-based sampling (keep traces with errors, drop happy path)
  • Dynamic rules based on trace characteristics
  • Head-based sampling for volume control
  • Custom logic through configuration

Pro tip: Set up burst protection or you'll get surprise bills during traffic spikes. Got hit with a DDoS and the telemetry bills were brutal - think it was like two grand before we got burst protection working.

Why This Architecture Doesn't Suck

Unlike traditional monitoring tools that make you choose between metrics, logs, and traces, Honeycomb's architecture gives you everything in one place. You can go from "response time is high" to "it's specifically requests from iOS users in California with feature flag X enabled" in seconds, not hours.

First production deploy with Honeycomb? Something will break. Always does. Works great until your startup hits 100M events/day, then you're in enterprise sales hell.

Questions People Actually Ask

Q

Why should I use Honeycomb instead of just sticking with Grafana + Prometheus?

A

Look, Prometheus and Grafana are fine if you like spending hours creating dashboards for every possible thing that could break. But when production melts down at 2am and you need to ask "why are API calls slow for users from California using the mobile app with feature flag X enabled?", good luck building that dashboard on the fly. Honeycomb stores everything as wide events, so you can ask questions you didn't think to ask beforehand. Plus, setup takes 30 minutes instead of the usual Prometheus + Grafana + Alertmanager configuration nightmare.

Q

How much is this actually going to cost me?

A

$130/month for 100 million events on the Pro plan. Unlike Datadog which charges per host (and counts containers as hosts, the bastards), Honeycomb's event-based pricing is actually predictable. Traffic spike during Black Friday? Your Honeycomb bill spikes too. Set those limits or you'll get a $5K surprise bill when your instrumentation goes crazy. The free tier gives you 20 million events, which is actually useful unlike most "freemium" observability tools that give you basically nothing. No charges for custom metrics, unlimited users, or additional services. Reality check: Datadog will bankrupt you if you're not careful with custom metrics. New Relic's pricing model is designed by sadists. Honeycomb's pricing makes sense.

Q

Does BubbleUp actually work or is it just marketing?

A

BubbleUp actually works. It finds the weird shit in your data instead of making you hunt through 47 different dashboards. I've used it to find everything from performance issues affecting users with specific browsers to memory leaks that only happened during certain API call patterns. When you're debugging a problem, BubbleUp automatically shows you which combinations of attributes are behaving abnormally. Not "CPU is high" but "CPU is high specifically for requests from iOS users in the EU using feature flag X."

Q

Will high-cardinality data fuck up my performance like it does with other tools?

A

Nope. Add a user ID to your Prometheus metrics and watch Grafana shit the bed. Honeycomb's storage engine was built specifically for high-cardinality observability data. I've thrown events with 500+ attributes at it without performance issues. This is crucial for modern apps where you need to slice data by user ID, session ID, feature flags, deployment version, A/B test cohort, etc. Traditional time-series databases literally can't handle this without exploding.

Q

How long does setup actually take?

A

If you're already using OpenTelemetry: maybe a few hours. Starting from scratch: plan for a week and it'll probably take two weeks. But that's still way better than the usual month-long monitoring setup nightmare. Real setup time: Plan for a week, it'll take two weeks, and you'll spend half that time fighting with container permissions. Gotcha: If you're on Kubernetes 1.25+, use OTel Collector 0.60+ or you'll get weird permission errors. The automatic instrumentation actually works, which shocked me.

Q

Can it replace all my monitoring tools?

A

Maybe, but probably not everything. Honeycomb is great for application observability, debugging, and understanding system behavior. You might still need:

  • Synthetic monitoring if uptime monitoring is critical
  • Infrastructure monitoring for basic server metrics
  • Security monitoring and log analysis
  • Specialized tools for compliance or audit requirements

But for debugging distributed systems and understanding what's happening in production? Yeah, Honeycomb can probably replace your current stack of 5 different tools.

Q

What if I go over my event limit?

A

Burst Protection handles spikes up to 2x your daily target automatically. You get notifications when approaching limits, not surprise bills. Pro tip: Set this up or you'll get fucked during traffic spikes. DDoS attack cost us like two grand in telemetry before we figured out burst protection.

Q

Is the "sub-3-second queries" thing actually true?

A

Honeycomb Query Performance Yeah, it's actually that fast. I keep expecting it to timeout like every other tool, but it just... works. Faster than Splunk will ever be. The first time I did a complex aggregation across 100GB of data and got instant results, I thought it was cached. It wasn't

  • that's just how their columnar storage works. Sometimes it's so fast I think something's broken, but nope.
Q

What about data security and compliance?

A

Honeycomb Security Features Honeycomb has SOC 2 Type II certification, encryption everywhere, and can sign Business Associate Agreements for healthcare. They offer AWS PrivateLink for network isolation if you're paranoid about that stuff. Unlike some other tools that sample your data for "performance reasons," Honeycomb doesn't need to because their storage engine actually works with high-volume data.

Q

How does data retention work in Honeycomb?

A

All plans include 60-day data retention with unlimited storage capacity. Enterprise customers can request extended retention periods. Data is immediately available for querying upon ingestion with no indexing delays, and Honeycomb automatically manages data compression and lifecycle.

Q

What security and compliance certifications does Honeycomb have?

A

Honeycomb is SOC 2 Type II certified and regularly undergoes independent penetration testing. The platform offers encryption at rest and in transit, AWS PrivateLink support for network isolation, and can sign Business Associate Agreements (BAAs) for healthcare customers.

Q

Can Honeycomb replace multiple existing monitoring tools?

A

Many organizations use Honeycomb to consolidate their observability stack because it unifies logs, metrics, traces, and events in a single platform. However, the decision depends on your specific requirements

  • teams needing specialized features like synthetic monitoring, security scanning, or infrastructure management may still require additional tools alongside Honeycomb.
Q

How long does it take to implement Honeycomb?

A

Basic implementation can take as little as a few hours for applications already using OpenTelemetry. For greenfield implementations, expect 1-2 weeks to instrument key services and establish useful queries and SLOs. They've got people who'll help you not fuck it up if you're paying enterprise money.

Q

What happens if I exceed my event limit?

A

Honeycomb provides Burst Protection that automatically handles traffic spikes up to 2x your daily target without counting against your monthly limit. You'll receive notifications when approaching limits, and have time to adjust instrumentation or upgrade plans before any throttling occurs.

Essential Honeycomb Resources

Related Tools & Recommendations

howto
Similar content

Set Up Microservices Observability: Prometheus & Grafana Guide

Stop flying blind - get real visibility into what's breaking your distributed services

Prometheus
/howto/setup-microservices-observability-prometheus-jaeger-grafana/complete-observability-setup
100%
tool
Similar content

OpenTelemetry Overview: Observability Without Vendor Lock-in

Because debugging production issues with console.log and prayer isn't sustainable

OpenTelemetry
/tool/opentelemetry/overview
85%
integration
Similar content

Prometheus, Grafana, Alertmanager: Complete Monitoring Stack Setup

How to Connect Prometheus, Grafana, and Alertmanager Without Losing Your Sanity

Prometheus
/integration/prometheus-grafana-alertmanager/complete-monitoring-integration
79%
integration
Recommended

OpenTelemetry + Jaeger + Grafana on Kubernetes - The Stack That Actually Works

Stop flying blind in production microservices

OpenTelemetry
/integration/opentelemetry-jaeger-grafana-kubernetes/complete-observability-stack
73%
tool
Similar content

Datadog Monitoring: Features, Cost & Why It Works for Teams

Finally, one dashboard instead of juggling 5 different monitoring tools when everything's on fire

Datadog
/tool/datadog/overview
61%
tool
Similar content

Jaeger: Distributed Tracing for Microservices - Overview

Stop debugging distributed systems in the dark - Jaeger shows you exactly which service is wasting your time

Jaeger
/tool/jaeger/overview
60%
integration
Similar content

ELK Stack for Microservices Logging: Monitor Distributed Systems

How to Actually Monitor Distributed Systems Without Going Insane

Elasticsearch
/integration/elasticsearch-logstash-kibana/microservices-logging-architecture
59%
integration
Similar content

Kafka, MongoDB, K8s, Prometheus: Event-Driven Observability

When your event-driven services die and you're staring at green dashboards while everything burns, you need real observability - not the vendor promises that go

Apache Kafka
/integration/kafka-mongodb-kubernetes-prometheus-event-driven/complete-observability-architecture
51%
tool
Similar content

Temporal: Stop Losing Work in Distributed Systems - An Overview

The workflow engine that handles the bullshit so you don't have to

Temporal
/tool/temporal/overview
51%
tool
Similar content

Prometheus Monitoring: Overview, Deployment & Troubleshooting Guide

Free monitoring that actually works (most of the time) and won't die when your network hiccups

Prometheus
/tool/prometheus/overview
47%
tool
Similar content

Grafana: Monitoring Dashboards, Observability & Ecosystem Overview

Explore Grafana's journey from monitoring dashboards to a full observability ecosystem. Learn about its features, LGTM stack, and how it empowers 20 million use

Grafana
/tool/grafana/overview
39%
tool
Similar content

Alertmanager - Stop Getting 500 Alerts When One Server Dies

Learn how Alertmanager processes alerts from Prometheus, its advanced features, and solutions for common issues like duplicate alerts. Get an overview of its pr

Alertmanager
/tool/alertmanager/overview
39%
tool
Similar content

Datadog Production Troubleshooting Guide: Fix Agent & Cost Issues

Fix the problems that keep you up at 3am debugging why your $100k monitoring platform isn't monitoring anything

Datadog
/tool/datadog/production-troubleshooting-guide
39%
tool
Similar content

Kibana - Because Raw Elasticsearch JSON Makes Your Eyes Bleed

Stop manually parsing Elasticsearch responses and build dashboards that actually help debug production issues.

Kibana
/tool/kibana/overview
34%
tool
Similar content

Datadog Setup & Config Guide: Production Monitoring in One Afternoon

Get your team monitoring production systems in one afternoon, not six months of YAML hell

Datadog
/tool/datadog/setup-and-configuration-guide
34%
tool
Similar content

Node.js Microservices: Avoid Pitfalls & Build Robust Systems

Learn why Node.js microservices projects often fail and discover practical strategies to build robust, scalable distributed systems. Avoid common pitfalls and e

Node.js
/tool/node.js/microservices-architecture
34%
tool
Similar content

Apache Kafka Overview: What It Is & Why It's Hard to Operate

Dive into Apache Kafka: understand its core, real-world production challenges, and advanced features. Discover why Kafka is complex to operate and how Kafka 4.0

Apache Kafka
/tool/apache-kafka/overview
34%
alternatives
Recommended

OpenTelemetry Alternatives - For When You're Done Debugging Your Debugging Tools

I spent last Sunday fixing our collector again. It ate 6GB of RAM and crashed during the fucking football game. Here's what actually works instead.

OpenTelemetry
/alternatives/opentelemetry/migration-ready-alternatives
32%
tool
Similar content

Service Mesh: Understanding How It Works & When to Use It

Explore Service Mesh: Learn how this proxy layer manages network traffic for microservices, understand its core functionality, and discover when it truly benefi

/tool/servicemesh/overview
30%
tool
Similar content

etcd Overview: The Core Database Powering Kubernetes Clusters

etcd stores all the important cluster state. When it breaks, your weekend is fucked.

etcd
/tool/etcd/overview
30%

Recommendations combine user behavior, content similarity, research intelligence, and SEO optimization