
Day 1: Agent Installation That Actually Works
The hardest part isn't choosing Datadog - it's getting the fucking thing to work without breaking your existing infrastructure. Here's how to install agents without your team hating you or accidentally monitoring every container that's ever existed.
Before starting: Review the Datadog installation requirements and system compatibility matrix to avoid platform-specific gotchas. Also check the supported operating systems list and network requirements.
Linux Installation: The Path of Least Resistance
Don't overthink the installation method. The one-liner script works fine for getting started, despite what security teams say about "curl | sudo bash" being evil. You can harden it later.
## The basic installation that actually works
DD_API_KEY=your_32_char_api_key bash -c \"$(curl -L https://s3.amazonaws.com/dd-agent/scripts/install_script.sh)\"
Get your API key from the right place: Datadog API Keys Management - not the application keys, not the client tokens, the actual API key. They all look similar and using the wrong one wastes hours.
The script installs Datadog Agent v7.70.0 (latest as of September 2025) and automatically starts it. Check installation worked with sudo datadog-agent status - you should see the forwarder running and sending metrics. For troubleshooting installation issues, check the agent troubleshooting guide.
What the installer actually does:
- Downloads and installs the agent package for your OS
- Creates the datadog-agent user and systemd service
- Starts collecting basic host metrics (CPU, memory, disk, network)
- Connects to Datadog and begins sending data within 2-3 minutes
Agent Architecture Overview: The Datadog agent runs as a lightweight process collecting system metrics, application traces, and logs. It buffers data locally and forwards to Datadog SaaS infrastructure through encrypted HTTPS connections.
Agent Architecture Diagram: The Agent v7 architecture consists of a main agent process, DogStatsD server for metrics collection, trace agent for APM data, and log agent for log forwarding. All components communicate through local channels and forward data to Datadog through secure HTTPS connections.
Container Installation: Kubernetes Without the Kubernetes Bullshit
Skip the complex Helm charts on day one. Use the Datadog Operator which handles RBAC, resource limits, and configuration management automatically. Alternative installation methods include DaemonSets and Helm charts, but the operator is most reliable for production deployments.
## Install the operator using recommended installation method
## See the official Datadog Operator documentation for current install commands
## Use Helm or follow the Kubernetes installation guide

## Then create a simple DatadogAgent resource
kubectl apply -f - <<EOF
apiVersion: datadoghq.com/v2alpha1
kind: DatadogAgent
metadata:
  name: datadog
spec:
  global:
    credentials:
      apiKey: your_api_key_here
      appKey: your_app_key_here
  features:
    apm:
      enabled: true
    logCollection:
      enabled: true
EOF
This deploys agents as a DaemonSet (one per node) plus a cluster agent for Kubernetes metadata aggregation. Within 5-10 minutes you'll see your nodes, pods, and services appearing in Datadog.
Common Kubernetes gotchas on day one:
- RBAC permissions: The operator creates proper cluster roles automatically - see Kubernetes RBAC docs
- Resource limits: Default limits work for most clusters; tune later if agents get OOMKilled - check resource requirements
- Network policies: Agents need egress to
*.datadoghq.comon ports 443 and 10516 - review network requirements
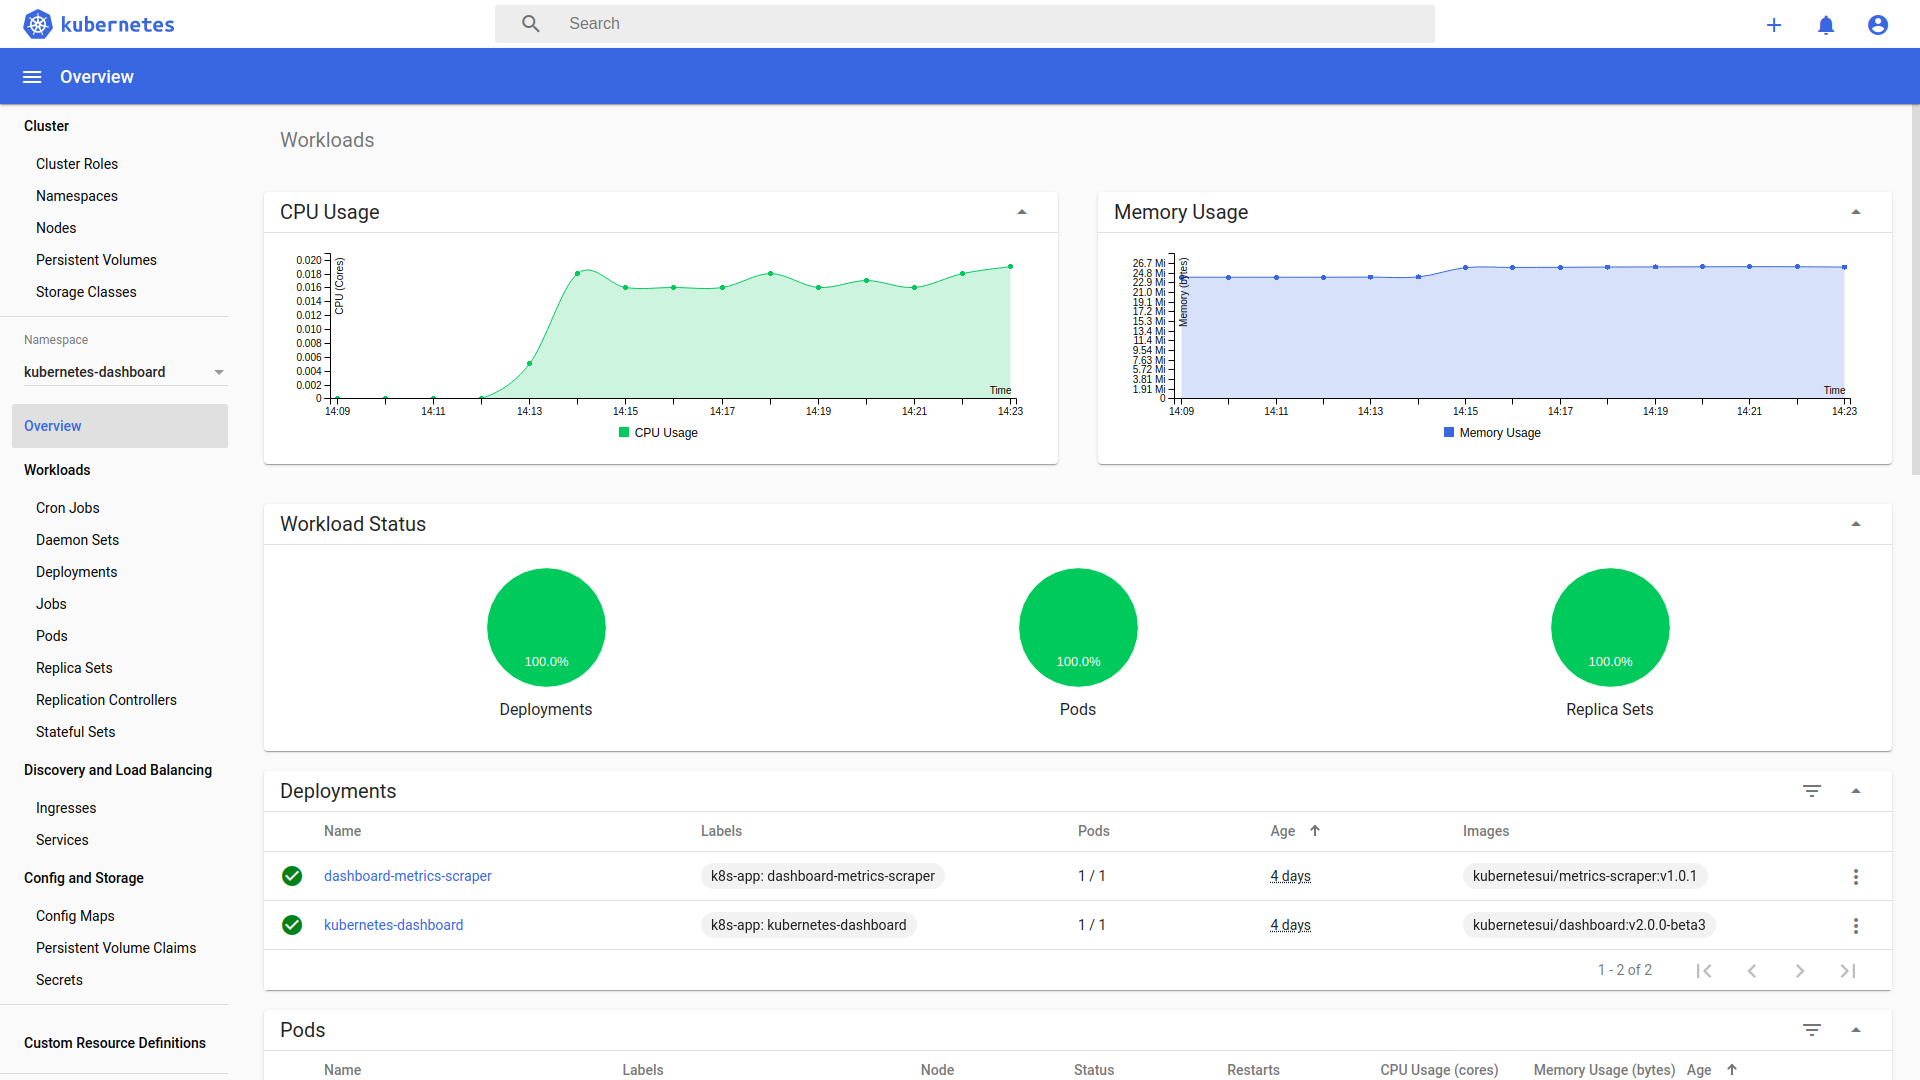
Kubernetes Monitoring Architecture: The setup deploys node agents (DaemonSet) on every worker node for host and container metrics, plus a cluster agent for Kubernetes API metadata aggregation. This distributed architecture prevents API server overload while providing comprehensive visibility.
AWS Integration: Connect Your Cloud Without Breaking Everything
The AWS integration is magic when it works, hell when it doesn't. Set it up correctly on day one to avoid weeks of debugging why half your metrics are missing. Start with the AWS integration quickstart guide and follow the manual setup instructions for production environments.
- Create a dedicated IAM role (don't use admin permissions like lazy tutorials suggest):
{
    \"Version\": \"2012-10-17\",
    \"Statement\": [
        {
            \"Effect\": \"Allow\",
            \"Action\": [
                \"cloudwatch:GetMetricStatistics\",
                \"cloudwatch:ListMetrics\",
                \"ec2:DescribeInstances\",
                \"ec2:DescribeSecurityGroups\",
                \"ec2:DescribeVolumes\",
                \"rds:DescribeDBInstances\",
                \"rds:ListTagsForResource\",
                \"s3:GetBucketLocation\",
                \"s3:ListBuckets\"
            ],
            \"Resource\": \"*\"
        }
    ]
}
Configure the integration in Datadog: AWS Integration Setup - paste your role ARN and external ID. The setup wizard actually works now.
Verify data flow: Within 10-15 minutes, you should see AWS metrics in the Infrastructure Map. If not, check IAM permissions and CloudTrail for access denied errors.
Data appears in layers: EC2 instances show up first (2-3 minutes), then RDS metrics (5-10 minutes), then S3 and other services (10-15 minutes). Don't panic if everything doesn't appear immediately.
AWS Integration Data Flow: Datadog connects to CloudWatch APIs using cross-account IAM roles to collect metrics from EC2, RDS, S3, and 90+ other AWS services. Data flows from AWS APIs → Datadog infrastructure → unified dashboards and alerts.
Day 2-3: Essential Integrations That Matter
Don't enable every integration - you'll get lost in the noise. Start with the applications you actually monitor manually and expand from there.
Database Monitoring: See What's Actually Slow
Database problems cause 70% of production incidents. Set up database monitoring early, not after your database melts down.
PostgreSQL Setup (most common):
## Add to /etc/datadog-agent/conf.d/postgres.d/conf.yaml
init_config:

instances:
  - host: localhost
    port: 5432
    username: datadog
    password: your_monitoring_user_password
    dbname: postgres
    collect_database_size_metrics: true
    collect_default_database: true
    collect_activity_metrics: true
Create a dedicated monitoring user (don't reuse application credentials):
CREATE USER datadog WITH PASSWORD 'secure_password';
GRANT CONNECT ON DATABASE postgres TO datadog;
GRANT USAGE ON SCHEMA public TO datadog;
GRANT SELECT ON pg_stat_database TO datadog;
MySQL/MariaDB has similar setup but different permissions. Check Database Monitoring docs for your specific database version. Additional database integrations include Redis, MongoDB, Cassandra, and Elasticsearch. The integration catalog has detailed setup instructions for each database type.
Within 24 hours you'll see:
- Slow query identification (queries >1s execution time)
- Connection pool utilization and max connection warnings
- Database size growth trends and space utilization
- Query performance trends showing degradation over time
Database Monitoring Dashboard Components: Query performance metrics, execution plans, lock contention analysis, connection pool utilization, and slow query identification with example traces for debugging.
Application Performance Monitoring: Trace What Matters
APM setup takes 5 minutes but provides the debugging capabilities that save hours during incidents.
Python/Flask example (adapt for your framework):
## pip install ddtrace
## Add to your application startup
from ddtrace import patch_all
patch_all()

## Or use the command line wrapper
DD_SERVICE=user-api DD_ENV=production ddtrace-run python app.py
Node.js/Express:
// npm install dd-trace --save
// Add as the FIRST import in your main file
const tracer = require('dd-trace').init({
  service: 'user-api',
  env: 'production'
});
Other language integrations: Java, Go, Ruby, .NET, and PHP all have auto-instrumentation libraries. See also the tracing setup overview for additional frameworks and the APM troubleshooting guide for common issues.
Environment variables for consistency:
export DD_SERVICE=user-api
export DD_ENV=production
export DD_VERSION=1.2.3
export DD_TRACE_SAMPLE_RATE=0.1  # Sample 10% of traces to control costs
APM data appears in 2-5 minutes. You'll immediately see:
- Service dependency maps showing which services call which
- Slow endpoints (>500ms response times) with example traces
- Error rates and error trace examples for debugging
- Database query performance from within your application
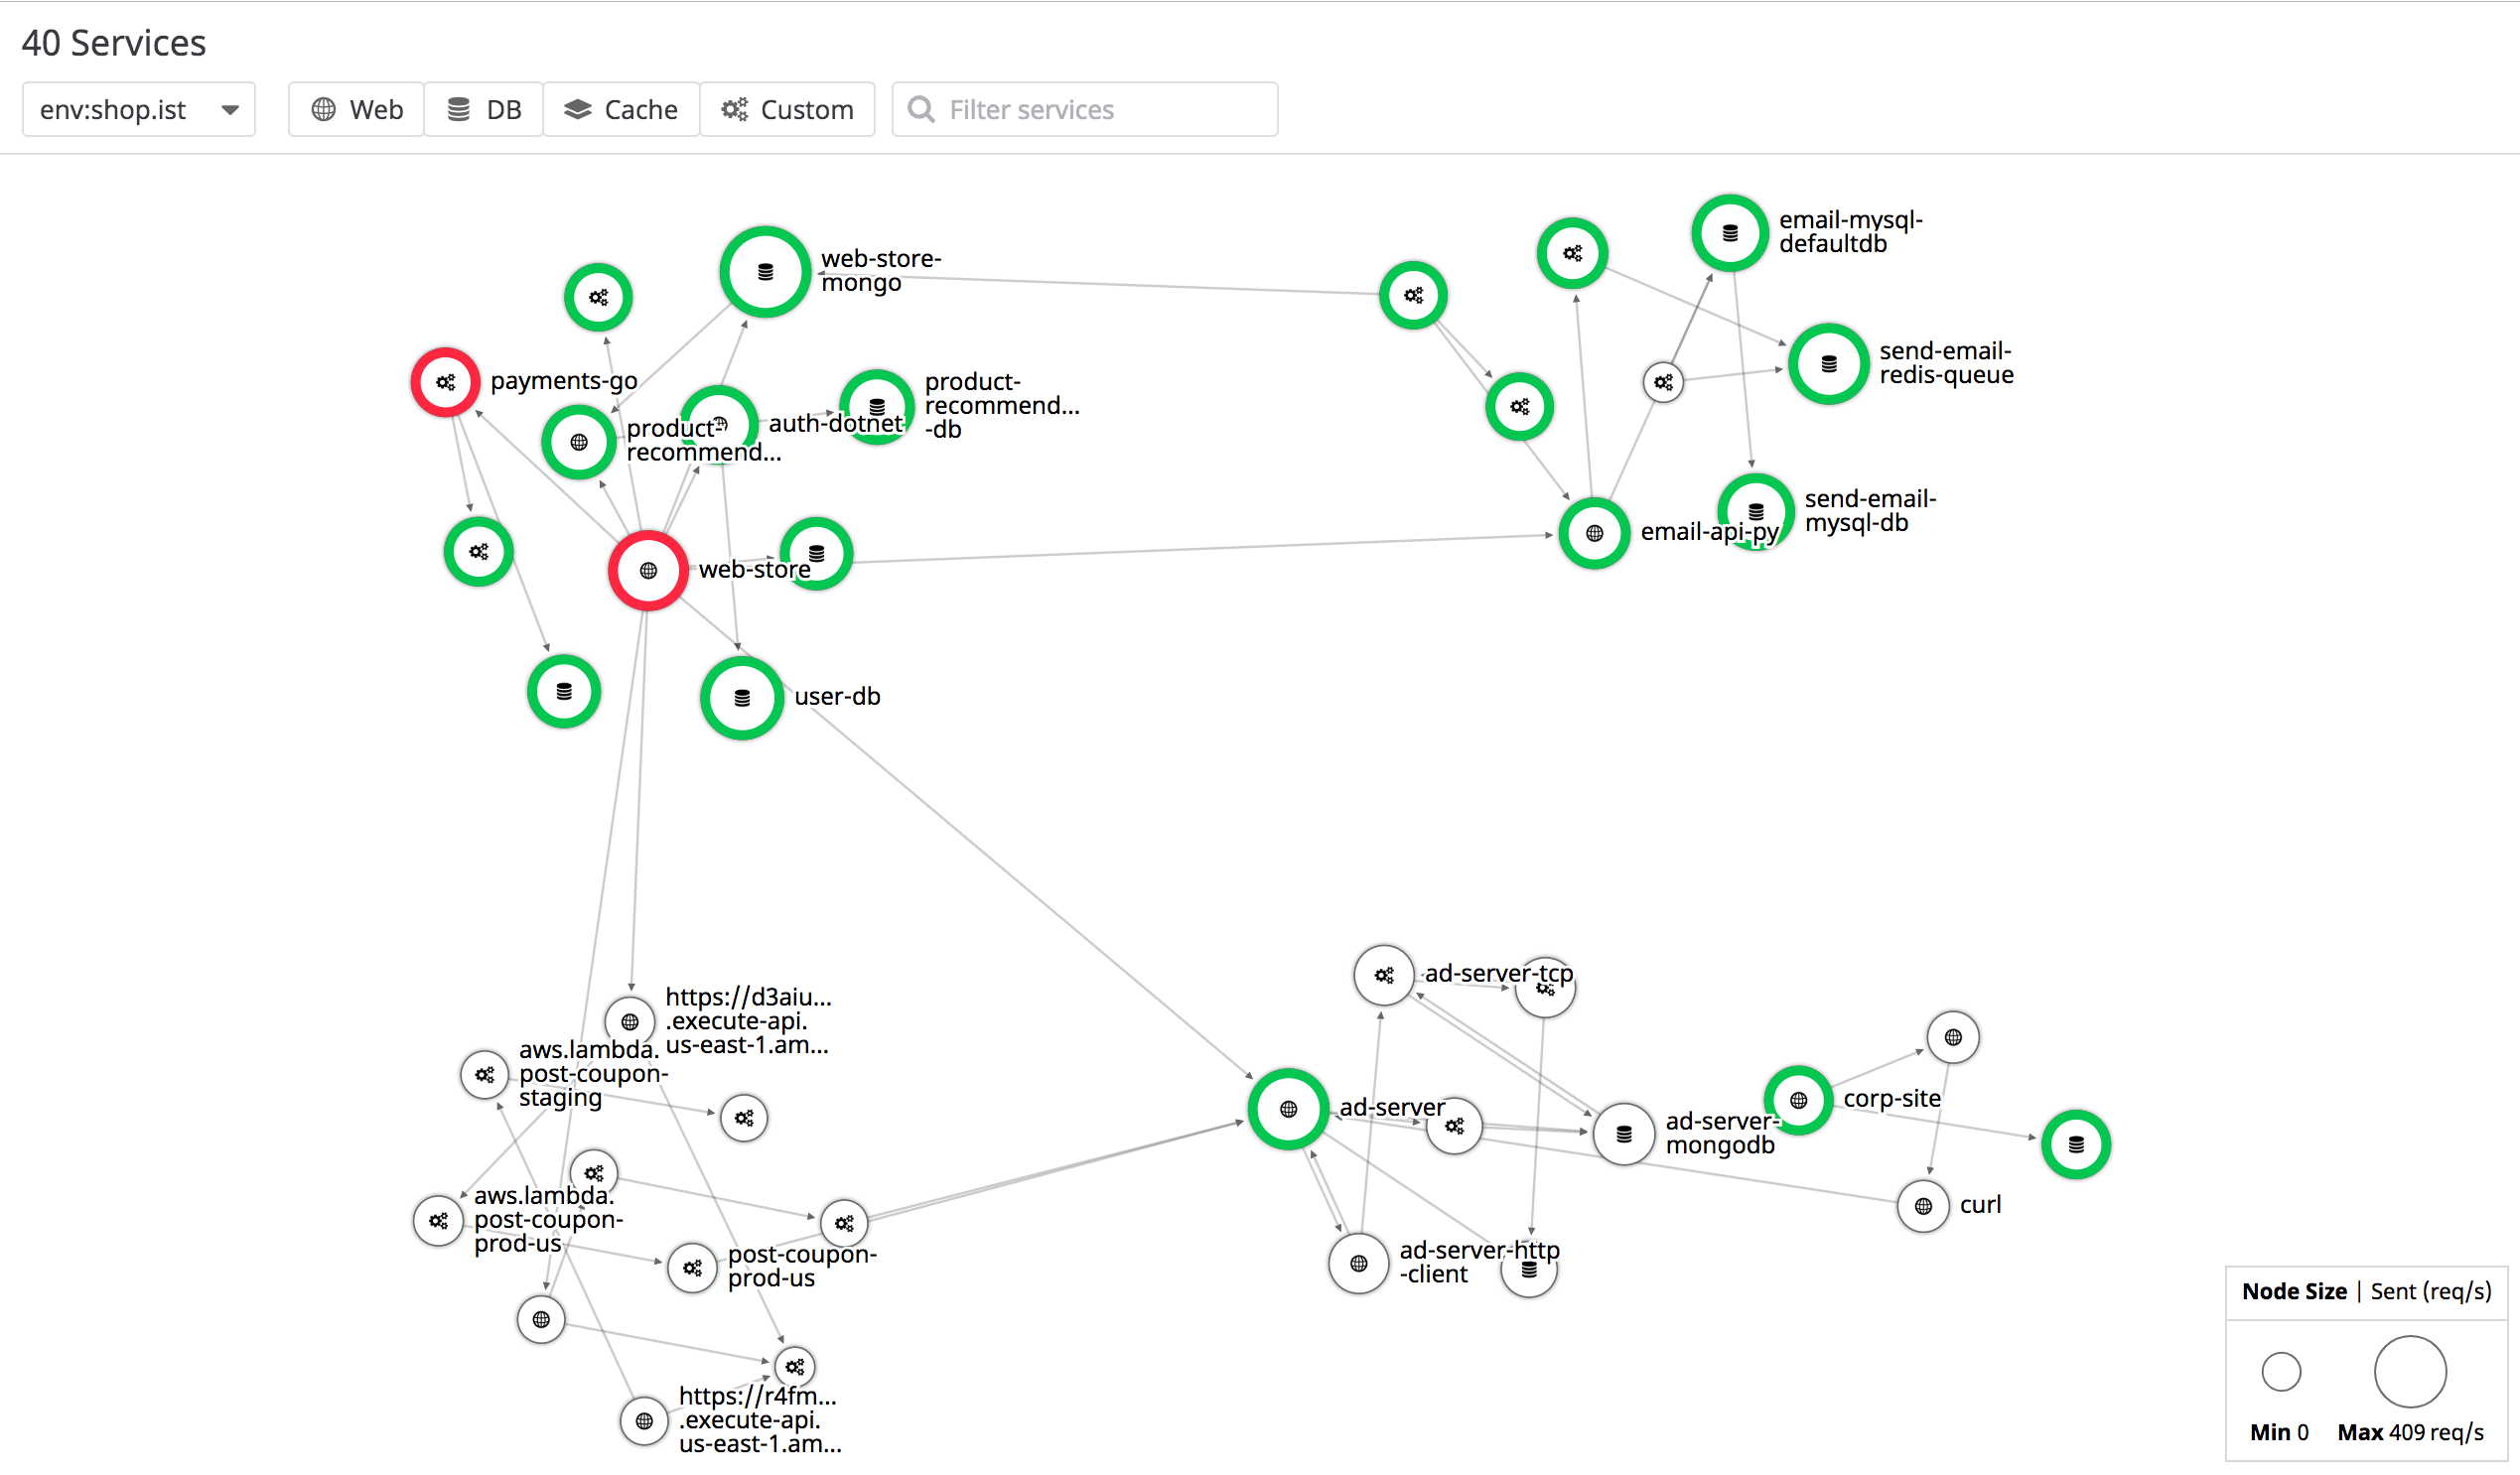
APM Service Map Visualization: Interactive dependency graph showing request flows between microservices, latency bottlenecks, error rates, and throughput metrics. Click on services to drill down into individual traces and performance details.
Log Management: Collect Logs That Actually Help Debug Issues
Log collection setup depends on your logging strategy. If you're using structured JSON logs, great. If not, start there.
File-based log collection (most common):
## Add to /etc/datadog-agent/conf.d/logs.yaml
logs:
  - type: file
    path: /var/log/application/*.log
    service: user-api
    source: python
    sourcecategory: application
Container log collection (Kubernetes):
## Add to your pod spec
metadata:
  annotations:
    ad.datadoghq.com/logs: '[{\"source\": \"python\", \"service\": \"user-api\"}]'
Log parsing happens automatically for common formats. Custom formats require parsing rules but start simple.
Cost control from day one: Enable log sampling to avoid $10k+ monthly surprises:
## Sample INFO logs at 10%, keep all ERROR/WARN
logs:
  - type: file
    path: /var/log/app/*.log
    service: user-api
    source: python
    log_processing_rules:
      - type: sample
        sample_rate: 0.1
        exclude_at_match: \"INFO\"
Log Collection Pipeline: Agent tails log files → parsing and filtering → structured indexing → search and alerting. The pipeline handles JSON logs automatically and supports custom parsing for application-specific formats.
Day 4-5: Dashboards and Alerts That People Actually Use
Most teams build 20 dashboards and use 3. Start with the dashboards you'll actually look at during incidents.
The \"Oh Shit\" Dashboard: What to Check First During Outages
Create a simple dashboard with the metrics that matter during incidents:
System Health Overview:
- CPU utilization (average across all hosts)
- Memory utilization (watch for >90% usage)
- Disk space remaining (alert when <10% free)
- Network errors and dropped packets
Application Performance:
- Request rate (requests per minute)
- Error rate (% of requests returning 5xx)
- Response time (95th percentile, not average)
- Database query performance (slow query count)
Infrastructure Status:
- Load balancer health check failures
- Auto-scaling group size changes
- Database connection pool utilization
Use the templating feature to create one dashboard that works for multiple services using the $service variable.
Dashboard Design Principles: Emergency dashboards focus on system health indicators, application performance metrics, and infrastructure status. Use template variables for multi-service dashboards and keep widget count under 15 for incident response speed.
Dashboard Layout: A well-designed operational dashboard includes system health widgets (CPU, memory, disk usage), application metrics (request rate, error rate, latency), and infrastructure status (load balancer health, database connections). Use time series graphs for trends and single-value widgets for current status.
Alerts That Don't Cause Alert Fatigue
Start with fewer, better alerts. Alert fatigue kills incident response more than missing metrics.
Essential alerts for week one:
- Disk Space Critical (actually critical):
avg(last_5m):min:system.disk.free{*} by {host,device} / max:system.disk.total{*} by {host,device} < 0.1
- Memory Usage High (leading indicator):
avg(last_10m):avg:system.mem.pct_usable{*} by {host} < 0.15
- Application Error Rate Spike:
avg(last_5m):sum:trace.web.request.errors{env:production} by {service}.as_rate() > 0.05
- Database Connection Pool Exhaustion:
avg(last_5m):avg:postgresql.max_connections{*} - avg:postgresql.connections{*} < 10
Configure alert notifications properly: Use separate notification channels for critical vs warning alerts. Critical alerts wake people up, warnings go to Slack.
Alert tuning takes weeks - expect to adjust thresholds based on false positive rates. Better to start conservative and tighten thresholds than deal with 3am false alarms.
Alert Configuration Workflow: Define metric thresholds → configure evaluation windows → set notification channels → test alert conditions → monitor false positive rates → adjust thresholds based on operational experience.
The key insight: Week one is about getting basic visibility, not comprehensive monitoring. Focus on the 20% of setup that provides 80% of the value - system metrics, APM for your main services, and basic alerting for things that actually break.
Advanced features like custom metrics, complex dashboards, and security monitoring come later. Get the foundation right first, then expand once your team trusts the data and knows how to use the tools.