Alertmanager handles the alerts that Prometheus fires. Prometheus says "CPU is at 90%" and Alertmanager figures out who to tell and how. Without it, every alert goes everywhere and your team learns to ignore Slack notifications.
Recent versions added Microsoft Teams v2 and Jira integrations that don't suck. Finally shipping features people asked for instead of fixing bugs nobody reported - like that Rocket.Chat integration for teams that can't afford Slack but still want alerts somewhere other than email hell.
How It Actually Works
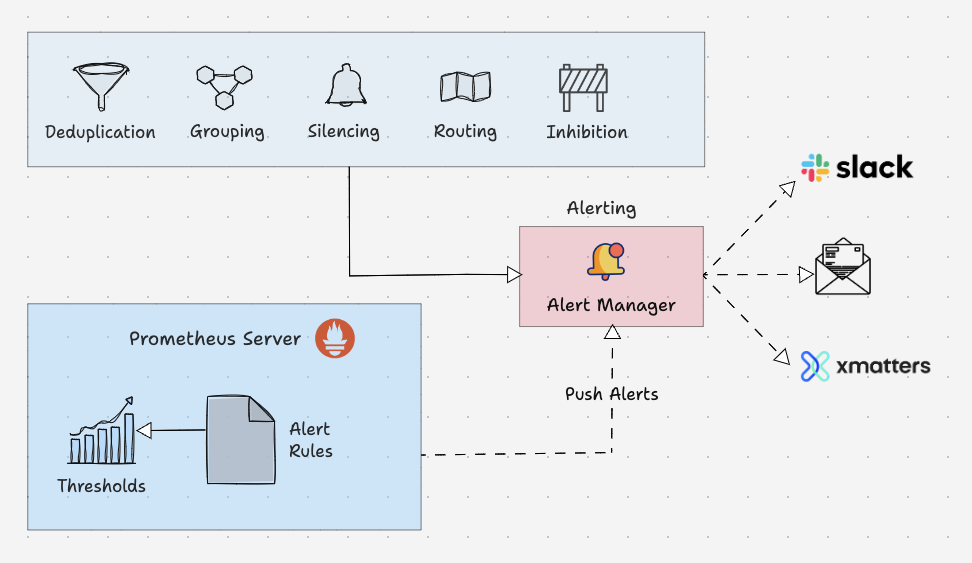
Alertmanager runs as a separate service from Prometheus. Prometheus evaluates alerting rules and sends alerts via HTTP to /api/v2/alerts and Alertmanager decides what to do with them. The clustering setup lets you run multiple instances that share state via gossip protocol - works great until network partitions fuck everything up.
Here's the actual flow when shit hits the fan:
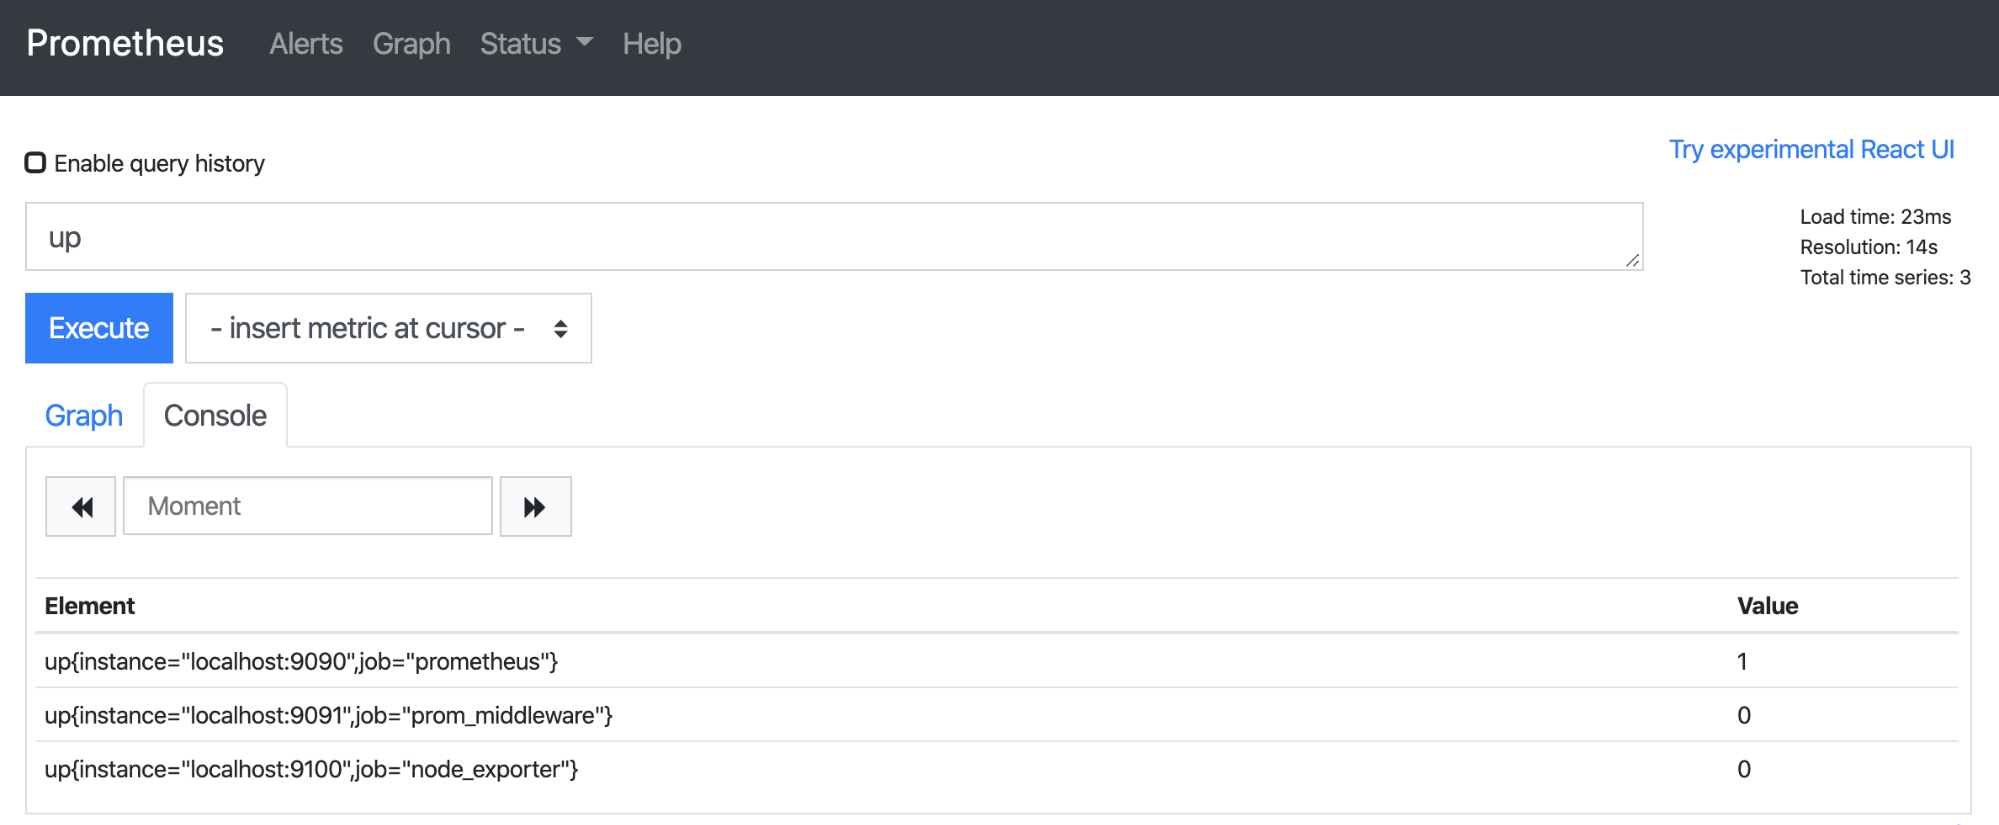
Alert Reception: Prometheus HTTP POSTs alerts to /api/v2/alerts. Each alert has labels and annotations - fuck up the labels and your routing won't work.
Grouping: Related alerts get batched together so you don't get 50 individual "disk full" alerts from the same cluster. Configuration is label-based and you'll get it wrong the first three times.
Routing: The routing tree matches labels to receivers. Database alerts go to DBAs, app alerts to devs. Sounds simple until you spend 4 hours debugging why critical alerts are going to the wrong Slack channel because of a typo in your label matcher.
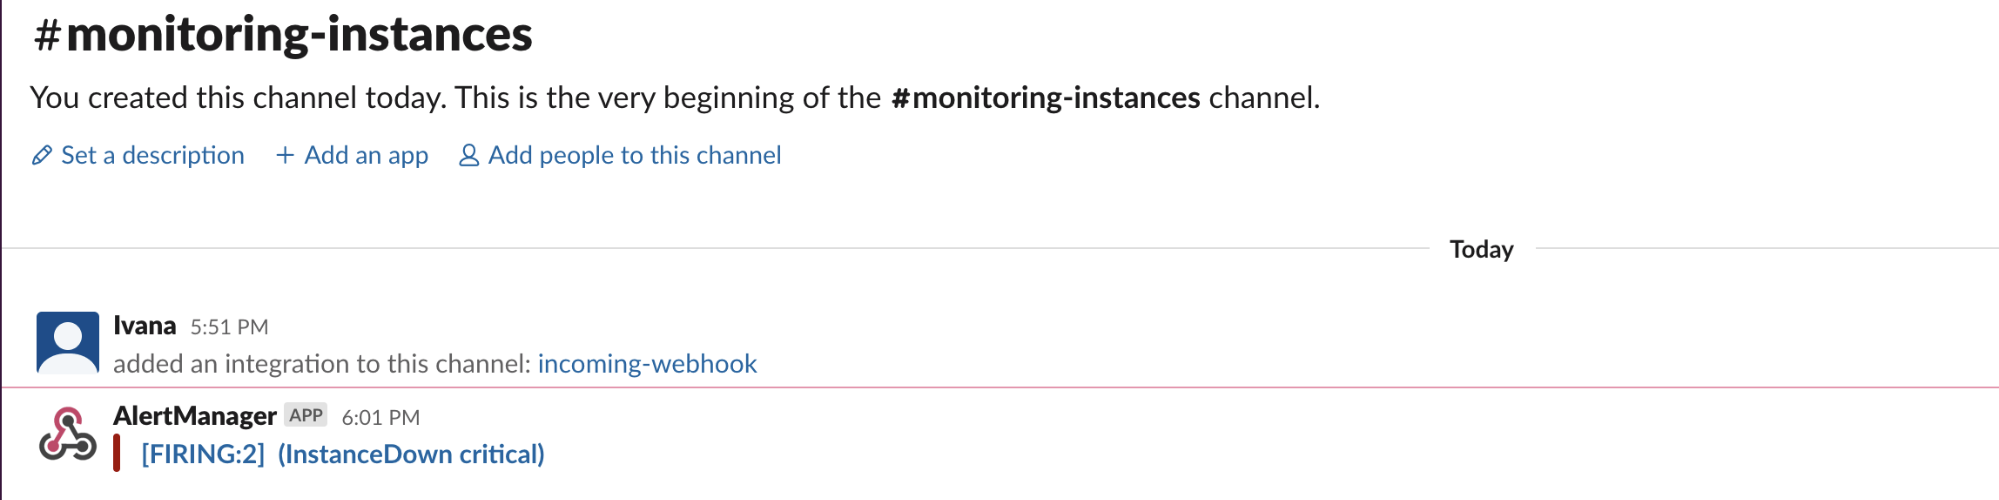
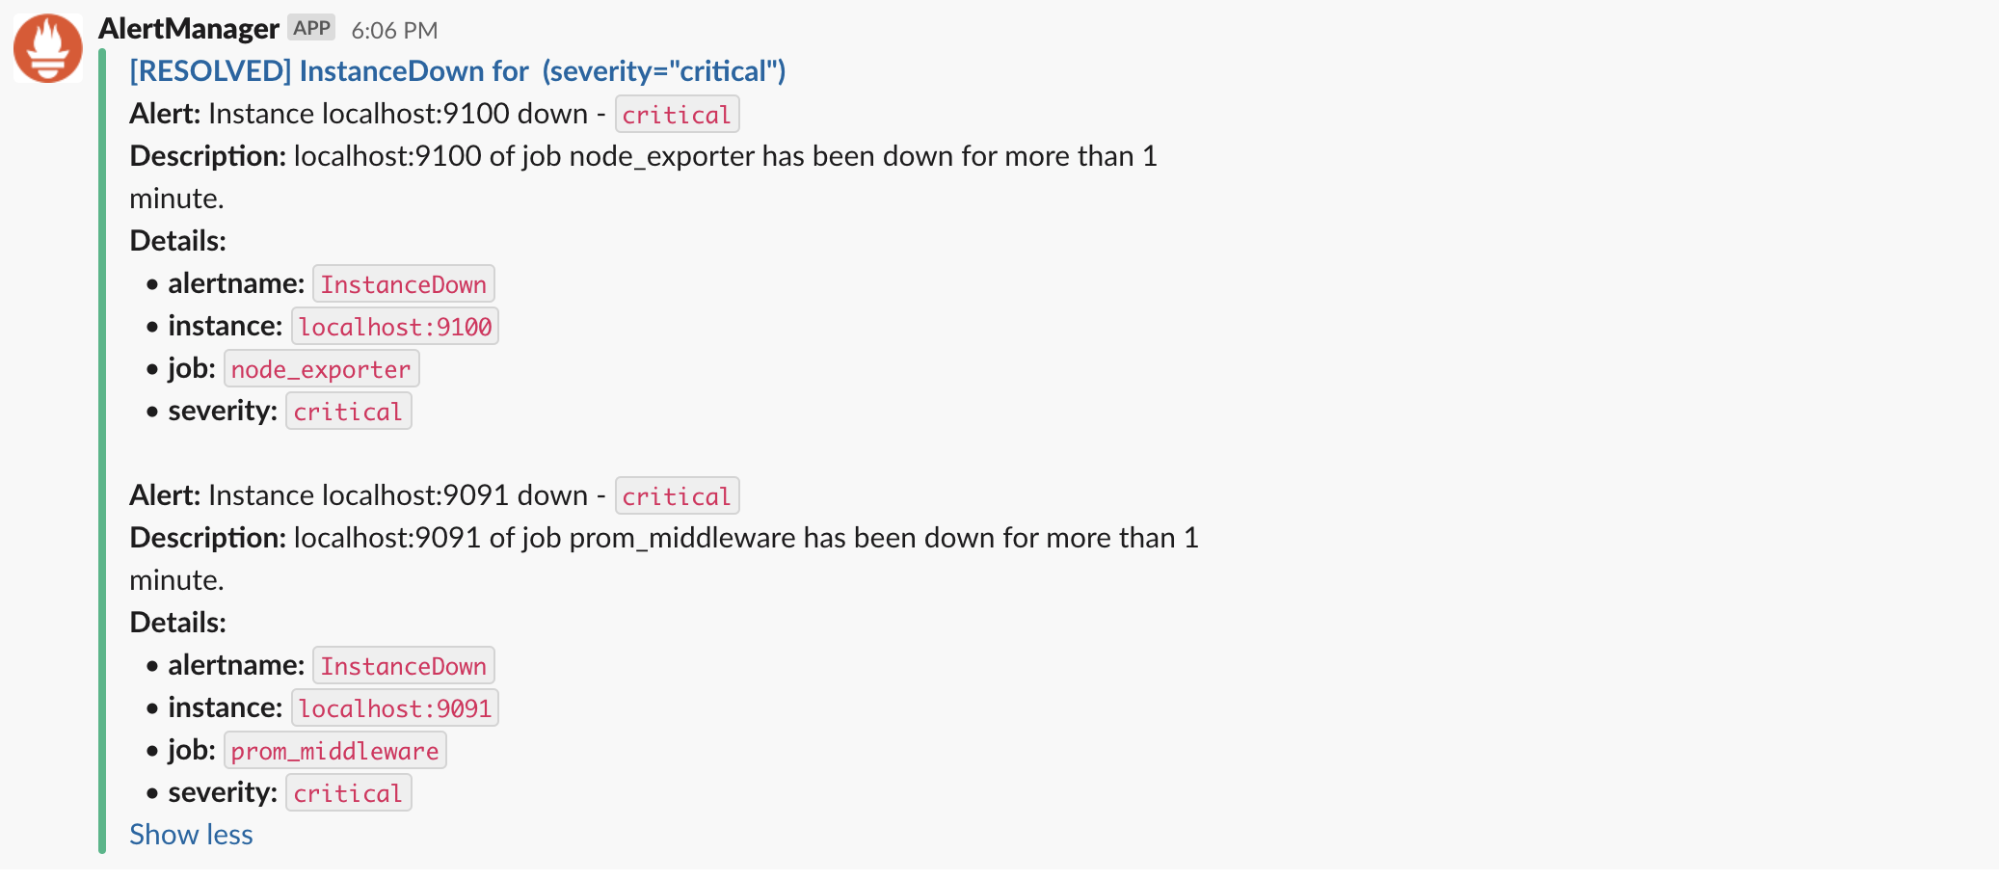
Notification Delivery: Supports tons of channels - Slack, PagerDuty, email, webhooks, Discord, Teams. Pick what actually works for your team, not what looks cool in the config.
The Stuff That Actually Matters
Alertmanager's main job is stopping alert spam while making sure critical shit still reaches you. Inhibition rules automatically suppress related alerts - when the whole cluster is down, you don't need 47 individual service alerts.
Silences let you mute alerts during planned maintenance. Great in theory, unless you forget to expire them and miss the actual outage next week. The web UI makes this easy but doesn't prevent human stupidity.
Alert state persists across restarts, so you won't lose track of what's firing when you restart the service. It exports its own Prometheus metrics so you can monitor the thing that monitors your monitors. Meta-monitoring is important - you need to know when your monitoring is broken.
Everyone uses it because what's your alternative? Roll your own alert routing? Good luck with that. PagerDuty costs us $1,200/month for a 15-person team - worth every penny when prod is on fire, but our finance team asks about it every quarter. Grafana Alerting works fine for simple setups but lacks the complex routing patterns you need when you have 47 different services and 12 different teams who all want alerts delivered differently.