Why Jaeger Exists (And Why You Need It)

Picture this: your API is randomly slow as hell, users are complaining, and you're staring at a wall of 15 microservices wondering which one is the asshole causing the problem. Welcome to distributed systems debugging without tracing - it's about as fun as debugging a memory leak with print statements.

Jaeger solves the "which service is fucking up" problem that every engineer running microservices deals with. It's a CNCF graduated project that actually works, which is saying something in the cloud-native space.

The Real Problem It Solves

Here's what happens without tracing: A user hits your API, it takes 5 seconds to respond, and you have no clue which of your services is the bottleneck. You start ssh-ing into boxes, checking logs, running htop, and generally losing your sanity. I've spent entire weekends debugging cascading failures across microservices where the root cause was a misconfigured Redis timeout in service #12 of 18, or a database connection pool that was exhausted.

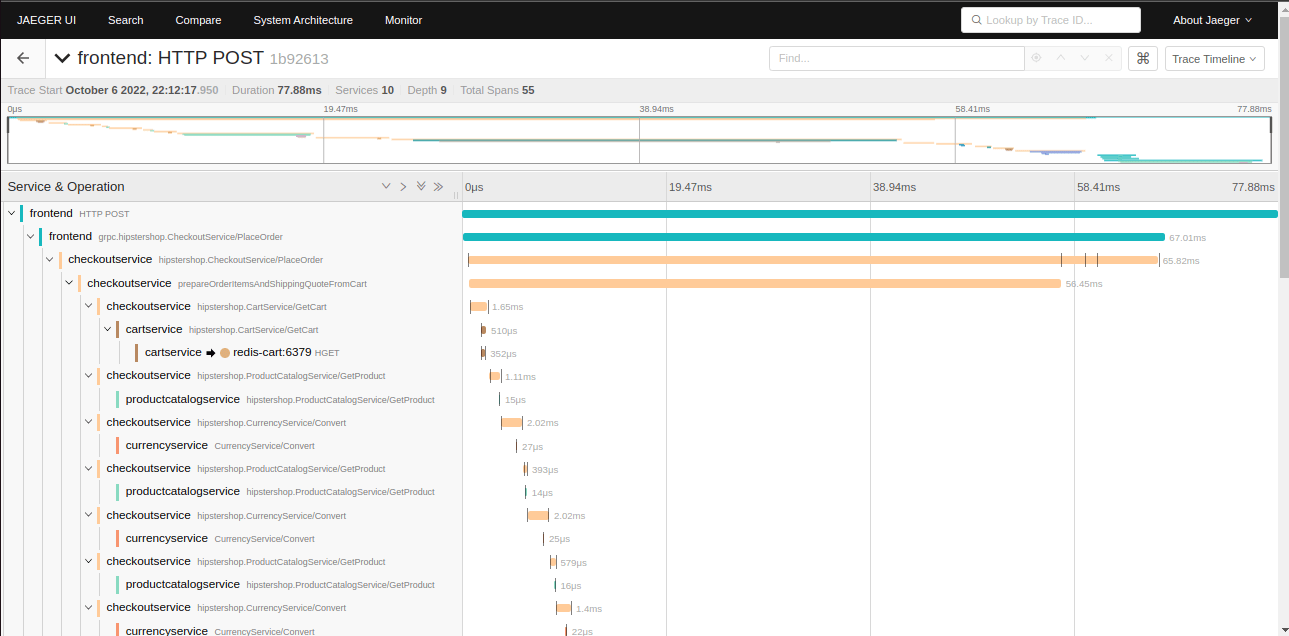
Distributed tracing shows you the complete path of a request through your system. Instead of guessing, you see exactly where the time is being spent. That 5-second API call? Turns out your user service is making 47 database queries because someone forgot to implement proper eager loading. Jaeger shows you this shit in seconds, not hours.

Jaeger v2: Finally Fixed The Annoying Stuff

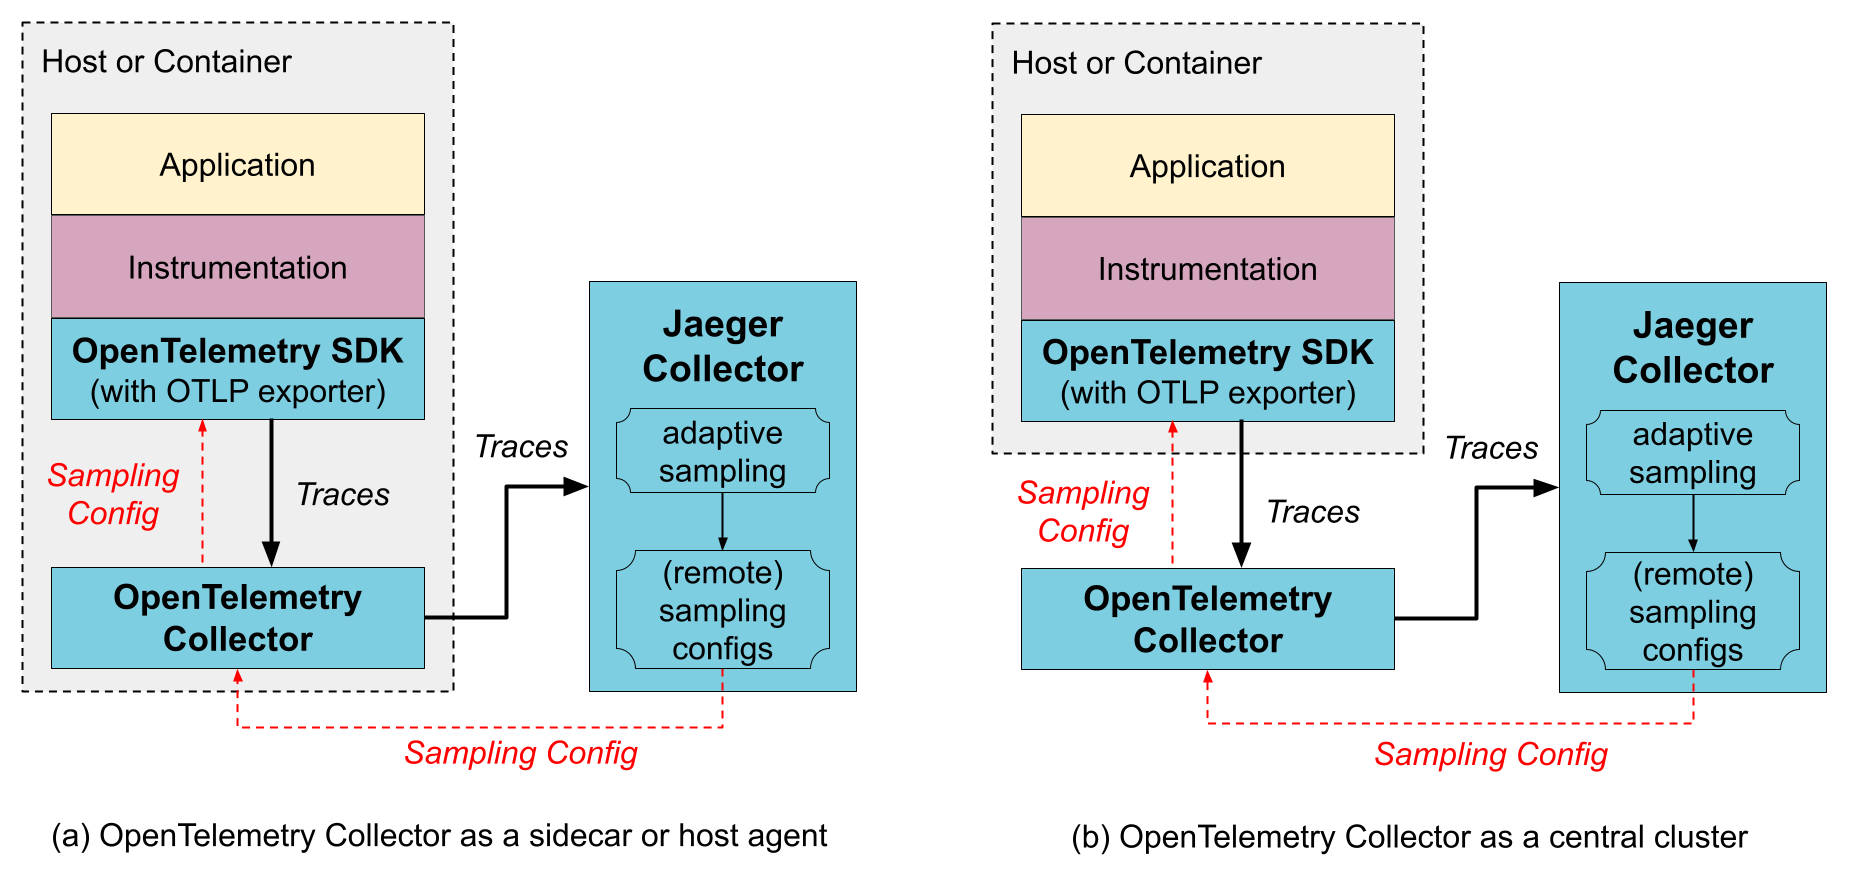
Jaeger v2 shipped in November 2024 and thank fucking god they fixed some major pain points. The old agent architecture was a nightmare to deploy - you had to run agents on every host, manage their configuration, and pray they didn't crash. V2 ditches the agent entirely and goes full OpenTelemetry native.

This matters because OpenTelemetry is the only observability standard that isn't complete garbage. Every other tracing library forces you into vendor lock-in or requires custom instrumentation that breaks when you upgrade. With Jaeger v2 + OpenTelemetry, your instrumentation works everywhere. The OpenTelemetry specification actually makes sense, unlike the proprietary APIs from Datadog or New Relic.

What It Actually Does For You

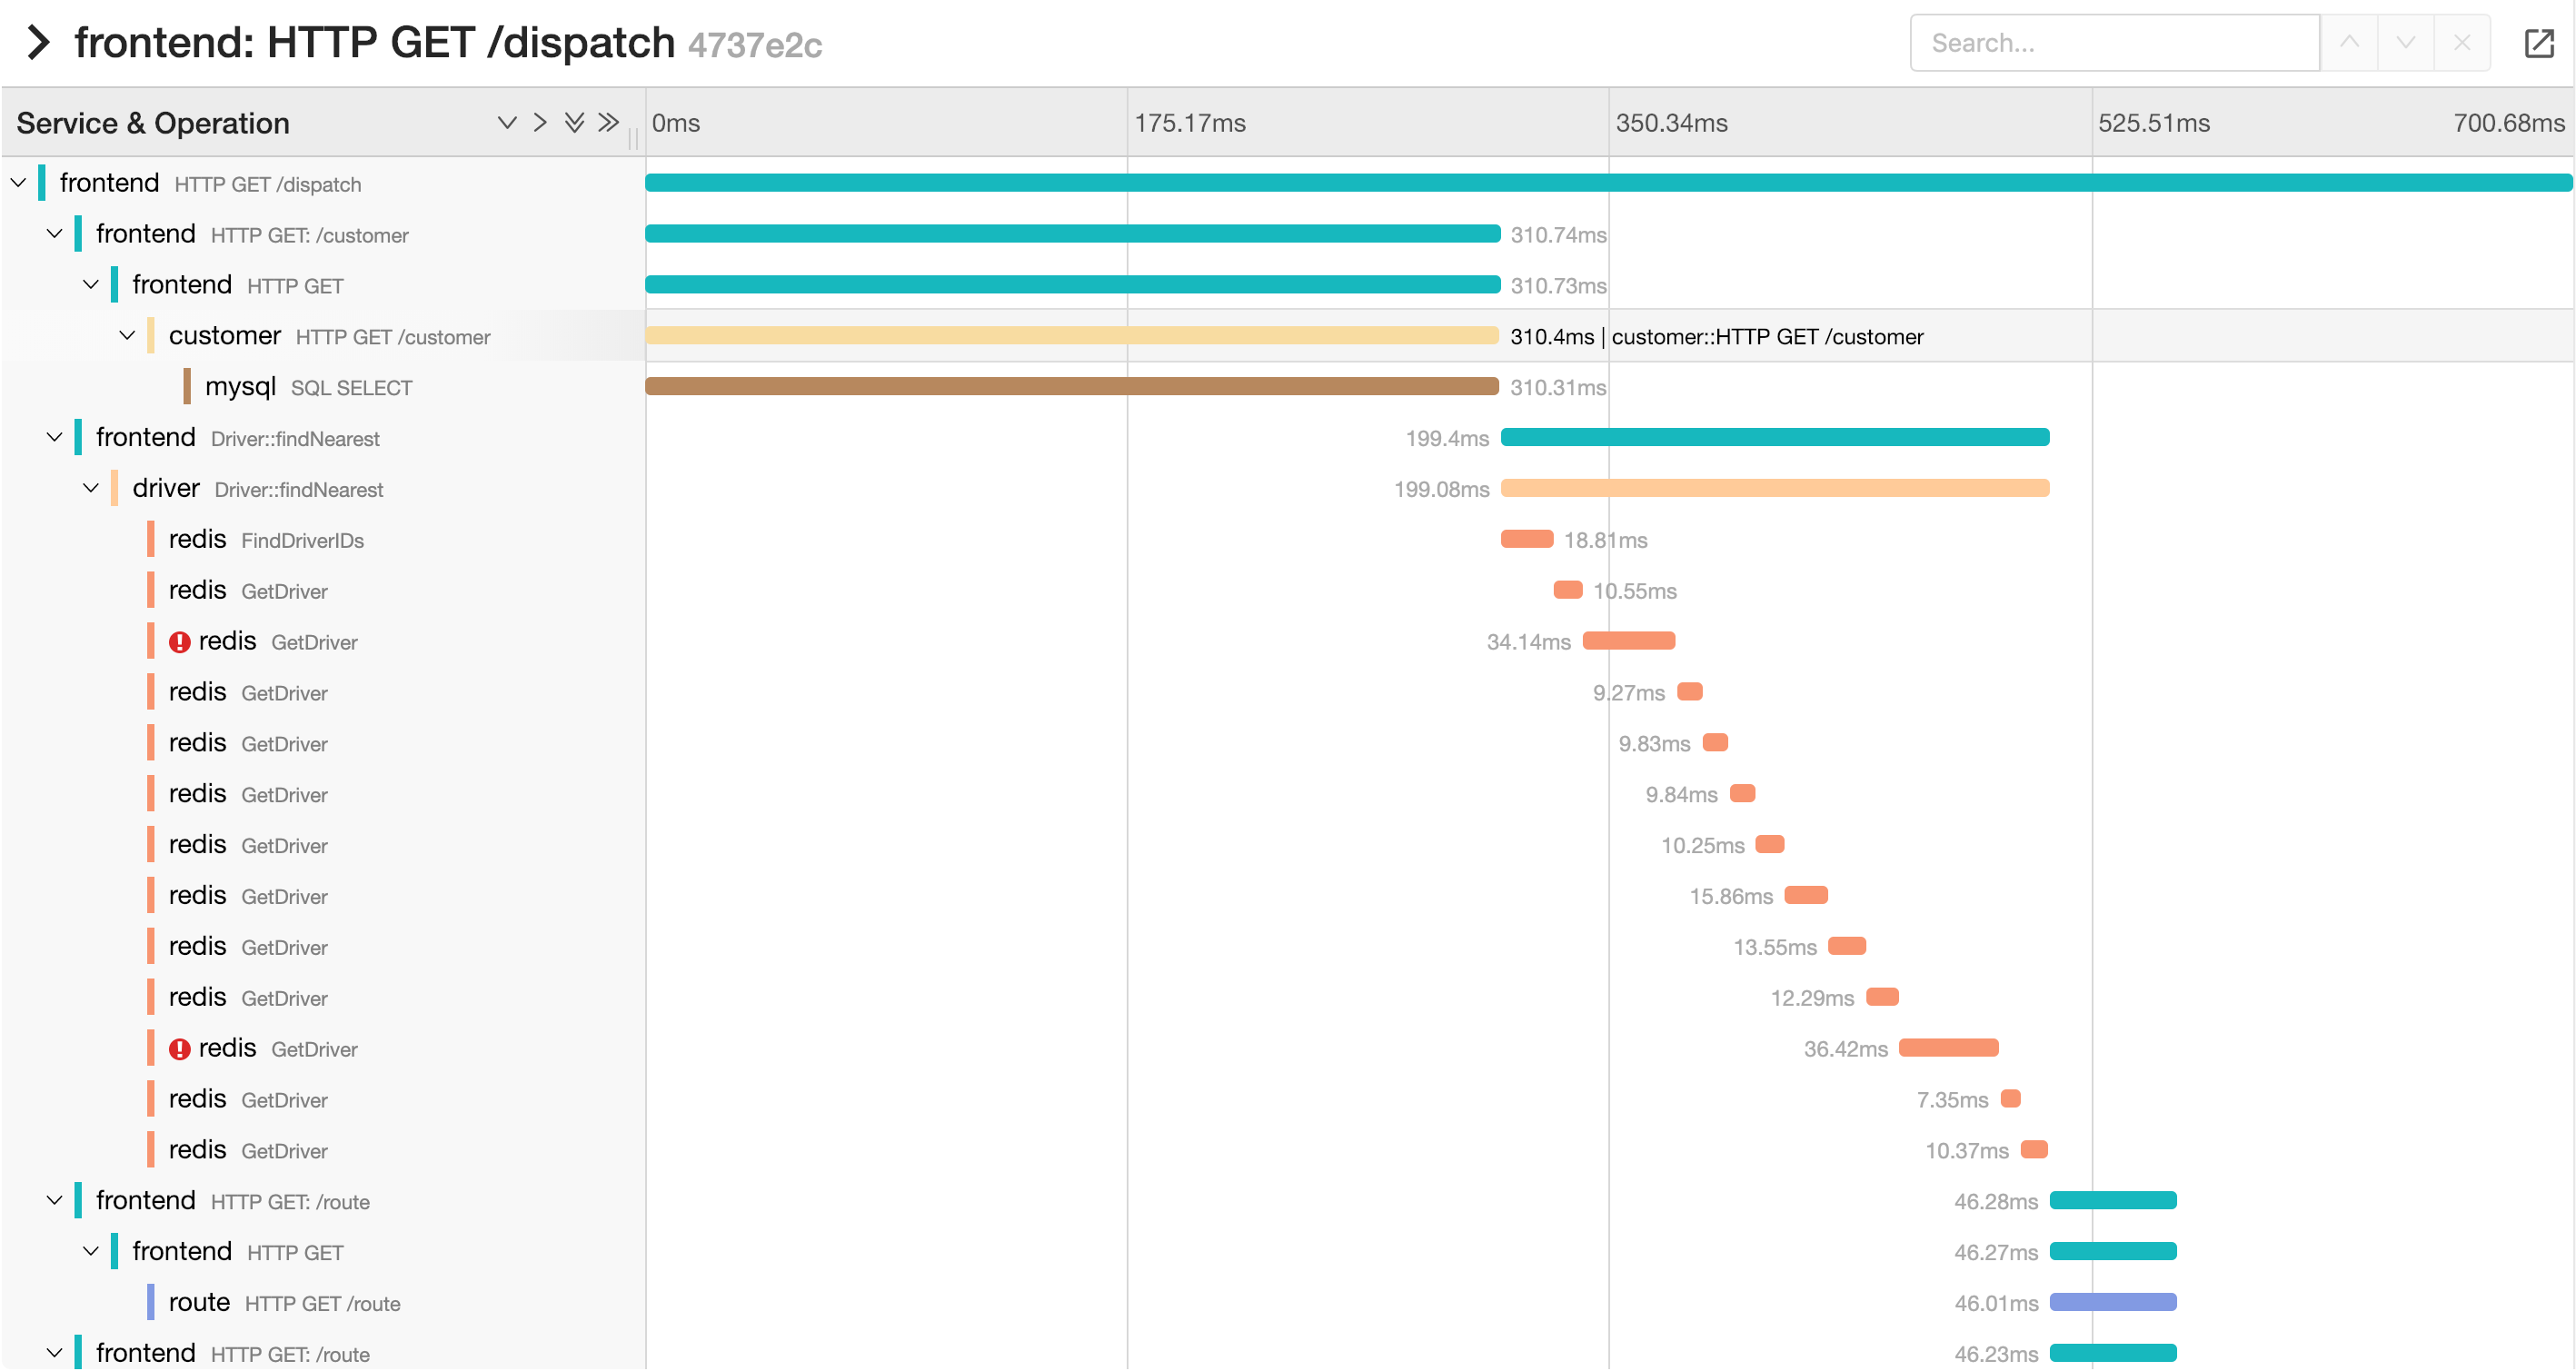
Finds The Slow Service: When your login endpoint suddenly takes 8 seconds, Jaeger shows you it's the auth service making a call to a user service that's hitting a database with a missing index. No more guessing.

Debugs Cascading Failures: That fun moment when one service going down takes out five others? Jaeger's dependency visualization shows you exactly how the failure propagated and which services you need to fix first.

Catches Resource Leaks: See patterns like steadily increasing latency that indicate memory leaks, connection pool exhaustion, or that one service that's slowly dying but hasn't crashed yet.

Performance Optimization: Find the services that are actually slow vs. the ones you think are slow. I've seen teams optimize the wrong service for months because they were guessing instead of measuring. Application performance monitoring becomes data-driven instead of gut-driven.

Jaeger v2 Architecture

The Architecture That Actually Works

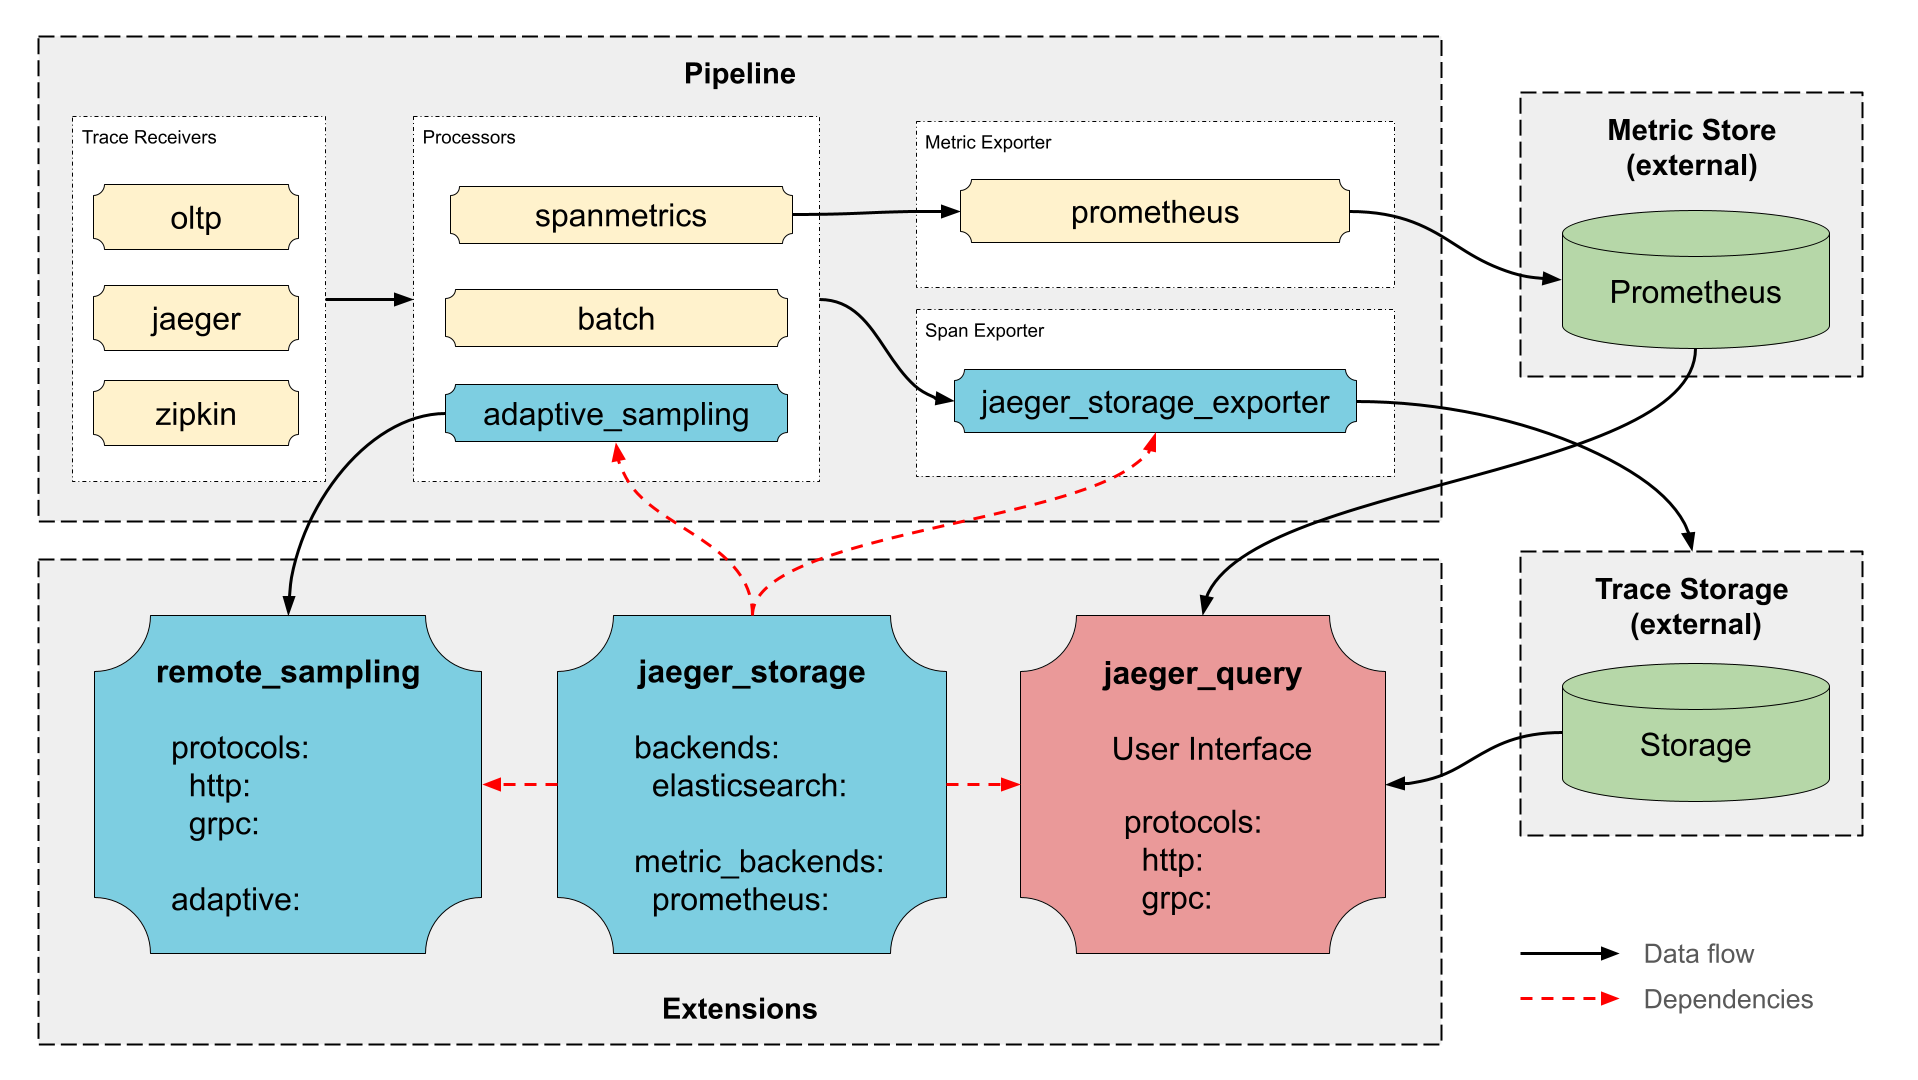
Jaeger's new v2 architecture ditches the complex multi-component approach. Instead of managing collectors, agents, query services, and storage separately, v2 gives you a single binary that handles everything. This matters because the old architecture was a deployment nightmare - five different components, each with their own configuration and failure modes.

OpenTelemetry Integration Architecture

Why Not Just Use Logs?

Logs tell you what happened in each service. Traces tell you what happened to each request. When you have 50 services and a request touches 12 of them, correlating logs manually is like trying to debug a race condition by reading print statements. Distributed tracing gives you the causality that logs can't provide.

Plus, setting up proper logging correlation across microservices is harder than setting up Jaeger. Trust me, I've done both.

The Reality of Running Jaeger in Production

Setting up Jaeger properly takes a weekend and a lot of coffee. The documentation assumes you know what you're doing, which you probably don't the first time around. Here's what actually happens when you deploy this thing in production.

Storage: The Thing That Will Kill Your Budget

Elasticsearch will eat all your memory if you don't configure it right. I learned this the hard way when our Jaeger deployment consumed 64GB of RAM and started OOMing our Kubernetes nodes. The default Elasticsearch configuration is designed for a laptop, not production tracing.

Budget at least 100GB per million spans for storage. A busy service generating 1000 requests/minute with 10 spans each will produce ~50GB of trace data monthly. That adds up fast when you have dozens of services. Storage costs become real money real quick.

Cassandra is a nightmare to tune but handles massive scale if you have someone who actually understands Cassandra (good luck finding them). Most teams go with Elasticsearch because it's easier to operate, but it's not cheap at scale.

The Collector: Your New Single Point of Failure

The Jaeger collector will crash if you send it malformed spans, so validate everything. We discovered this when a rogue service started sending traces with 50MB payloads and took down our entire tracing infrastructure.

The collector defaults are conservative - bump the memory limits or it will OOM under load. Set --collector.queue-size=100000 and --collector.num-workers=100 for production, not the pathetic defaults.

The UI: Functional But Frustrating

The Jaeger UI times out on large traces and makes you want to punch something. If your trace has 1000+ spans, prepare to wait. The search functionality is basic - you can't filter by custom tags efficiently, and complex queries are a pain in the ass.

Large traces (>1000 spans) make the UI unusable. The timeline view becomes a horizontal scroll nightmare, and finding specific spans requires clicking through a tree of doom. I've seen 30-minute traces crash browser tabs.

Service Discovery Hell

Getting service names right is harder than it should be. If your services don't report consistent names, half of them won't show up in the UI. The dependency graph becomes useless when you have 15 variations of "user-service" because different teams configured things differently.

Jaeger Service Dependency Graph

The UI: Love/Hate Relationship

Jaeger UI Trace View

The trace view is decent when it works, but it's not winning any design awards. The timeline gets cluttered fast, and finding specific spans in a 1000+ span trace is like looking for a needle in a distributed haystack.

Jaeger UI Interface

Sampling: Critical But Confusing

The default sampling settings will bankrupt your storage budget. Set up adaptive sampling or die. Without proper sampling, you'll trace every request and generate terabytes of data you'll never look at.

Start with 1% sampling in production and adjust up carefully. High-traffic services need much lower sampling rates - we sample our checkout service at 0.1% and still get useful data.

OpenTelemetry: Finally Works Without Hacks

Jaeger v2's OpenTelemetry integration actually works properly now. The old agent architecture was a deployment nightmare - agents would randomly crash, lose traces, or fall behind on ingestion.

With OpenTelemetry SDKs, your apps send traces directly to the collector using OTLP. No more managing agents, no more mysterious trace loss, no more debugging the debugging infrastructure.

Kubernetes Deployment: Use the Operator

The official Kubernetes operator saves you from YAML hell but has its own quirks. It assumes you know how to configure Elasticsearch properly for production workloads. If you don't, you'll spend a lot of time learning about heap sizes and node affinity.

When Jaeger Itself is Broken

When Jaeger is down, debugging becomes a special kind of hell. You can't trace why Jaeger is broken because Jaeger is what shows you traces. Keep traditional monitoring on the Jaeger components themselves - metrics on ingestion rates, storage utilization, and query latency.

The Bottom Line

Despite the operational complexity, Jaeger is worth it. Nothing else gives you the same visibility into distributed system behavior. Just budget for DevOps time, storage costs, and the learning curve. It's not plug-and-play, but it works when configured properly.

Jaeger vs Alternative Tracing Solutions

Feature

Jaeger

Zipkin

AWS X-Ray

Datadog APM

New Relic

License

Open Source (Apache 2.0)

Open Source (Apache 2.0)

Proprietary

Proprietary

Proprietary

Hosting

Self-hosted or Cloud

Self-hosted

AWS Only

SaaS Only

SaaS Only

CNCF Status

Graduated Project

Incubating

N/A

N/A

N/A

OpenTelemetry Support

Native OTLP Support

Via Collector

Limited

Yes

Yes

Storage Options

Elasticsearch, Cassandra, Kafka

Elasticsearch, Cassandra, MySQL

DynamoDB

Proprietary

Proprietary

UI/Visualization

Basic but functional

Basic but functional

AWS Console (meh)

Actually good dashboards

Excellent UX

Sampling

Adaptive Sampling

Basic Sampling

Automatic

Intelligent

Intelligent

Cost

Free but you pay for infrastructure ($$$ for storage)

Free but simpler to operate

Pay-per-trace (gets expensive fast)

$23/host minimum, scales brutally

$25/host minimum, fancy dashboards though

Kubernetes Integration

Native Operator

Manual Setup

EKS Integration

Agent-based

Agent-based

Community

18k+ GitHub stars

16k+ GitHub stars

N/A

Enterprise Support

Enterprise Support

Real Questions About Running Jaeger in Production

Q

Why is my Jaeger UI so damn slow?

A

The Jaeger UI chokes on large traces (1000+ spans). If your requests generate massive trace trees, the UI becomes unusable. Large distributed transactions can create traces with 10k+ spans that crash browser tabs. Solution: implement better sampling and break up your transaction boundaries. Also, the search is painfully slow without proper indexing.

Jaeger Trace Timeline

Large traces turn into horizontal scroll nightmares. The UI wasn't designed for traces with thousands of spans, and browser performance degrades significantly.

Jaeger Embedded Trace View

Q

How do I stop Jaeger from filling up all my disk space?

A

Set up retention policies immediately or Jaeger will consume every byte of storage you have. In Elasticsearch, configure index lifecycle management to delete old traces. For Cassandra, you need time-based compaction strategies. Default retention is basically forever, which is insane.

Start with 7-day retention and adjust based on your debugging patterns. Most issues are found within hours, not weeks.

Q

Can I trust Jaeger not to crash my application?

A

Mostly, but not completely. OpenTelemetry SDKs are pretty robust now, but I've seen cases where tracing overhead killed performance. The old OpenTracing Java client had memory leaks that took down production apps. OpenTelemetry is much better, but still - always canary deployments with tracing enabled.

Set resource limits on span size and batch processing. A rogue service generating 100MB traces will OOM your collector and potentially your apps.

Q

Why do some of my traces disappear?

A

Sampling is probably dropping them. Adaptive sampling makes decisions based on traffic volume - high-volume services get sampled more aggressively. Check your sampling configuration if you're missing critical traces.

Also, collector crashes lose traces. If your collector is under-resourced or gets malformed spans, it will drop data silently. Monitor collector health metrics religiously.

Q

How much will this actually cost me?

A

Budget $500-2000/month minimum for a medium-sized system with decent retention. Elasticsearch storage costs add up fast - expect $0.10-0.30 per GB-month on cloud providers. A system generating 1M spans/day needs ~50GB storage/month at minimum.

Don't forget compute costs for the collector, query service, and Elasticsearch cluster. Factor in at least 0.5 FTE DevOps time for maintenance. Commercial APM solutions might be cheaper if you're under 50 services.

Q

What breaks when I upgrade to Jaeger v2?

A

The agent is gone, so any deployment scripts using jaeger-agent need updating. Your OpenTracing instrumentation still works but you should migrate to OpenTelemetry. Configuration format changed significantly between versions.

Custom dashboards and alerting on agent metrics will break since the agent doesn't exist anymore. Plan for a few days of fixing monitoring after the upgrade.

Q

Why does my dependency graph look like spaghetti?

A

Service naming inconsistency. Different teams configured service names differently, so you get "user-service", "user-svc", "userservice", and "UserService" all showing up as separate services. Standardize service naming early or live with the mess forever.

Also, the dependency graph doesn't handle high-cardinality data well. If you have services that call hundreds of other services, the visualization becomes useless.

Q

How do I debug when Jaeger itself is broken?

A

Keep traditional monitoring on Jaeger components. When the tracing system is down, you can't trace why it's down. Monitor collector ingestion rates, storage utilization, and query latency with Prometheus metrics.

Common failure modes: Elasticsearch cluster split-brain, collector OOM from large spans, storage quota exceeded, and network partitions between components.

Q

Should I run Jaeger on Kubernetes?

A

Yes, but use the official operator. Running Jaeger components manually on Kubernetes is YAML hell. The operator handles most of the operational complexity, but you still need to understand Elasticsearch tuning.

Don't put Jaeger and your application workloads on the same cluster if you can avoid it. When your app cluster has issues, you want your observability infrastructure to stay up.

Q

Is the learning curve worth it?

A

Absolutely. Despite all the operational pain, nothing else gives you the same insight into distributed system behavior. The first time you use Jaeger to debug a cascading failure across 15 services in minutes instead of hours, you'll understand why it's worth the complexity.

Just budget for the learning curve, operational overhead, and storage costs upfront.

Essential Jaeger Resources (And Which Ones Actually Matter)

Related Tools & Recommendations

howto
Similar content

Set Up Microservices Observability: Prometheus & Grafana Guide

Stop flying blind - get real visibility into what's breaking your distributed services

Prometheus
/howto/setup-microservices-observability-prometheus-jaeger-grafana/complete-observability-setup
100%
integration
Similar content

OpenTelemetry, Jaeger, Grafana, Kubernetes: Observability Stack

Stop flying blind in production microservices

OpenTelemetry
/integration/opentelemetry-jaeger-grafana-kubernetes/complete-observability-stack
83%
tool
Similar content

OpenTelemetry Overview: Observability Without Vendor Lock-in

Because debugging production issues with console.log and prayer isn't sustainable

OpenTelemetry
/tool/opentelemetry/overview
79%
integration
Similar content

ELK Stack for Microservices Logging: Monitor Distributed Systems

How to Actually Monitor Distributed Systems Without Going Insane

Elasticsearch
/integration/elasticsearch-logstash-kibana/microservices-logging-architecture
77%
integration
Similar content

Cassandra & Kafka Integration for Microservices Streaming

Learn how to effectively integrate Cassandra and Kafka for robust microservices streaming architectures. Overcome common challenges and implement reliable data

Apache Cassandra
/integration/cassandra-kafka-microservices/streaming-architecture-integration
69%
tool
Similar content

Fix gRPC Production Errors - The 3AM Debugging Guide

Fix critical gRPC production errors: 'connection refused', 'DEADLINE_EXCEEDED', and slow calls. This guide provides debugging strategies and monitoring solution

gRPC
/tool/grpc/production-troubleshooting
62%
integration
Similar content

gRPC Service Mesh Integration: Solve Load Balancing & Production Issues

What happens when your gRPC services meet service mesh reality

gRPC
/integration/microservices-grpc/service-mesh-integration
55%
tool
Similar content

gRPC Overview: Google's High-Performance RPC Framework Guide

Discover gRPC, Google's efficient binary RPC framework. Learn why it's used, its real-world implementation with Protobuf, and how it streamlines API communicati

gRPC
/tool/grpc/overview
52%
tool
Similar content

Node.js Microservices: Avoid Pitfalls & Build Robust Systems

Learn why Node.js microservices projects often fail and discover practical strategies to build robust, scalable distributed systems. Avoid common pitfalls and e

Node.js
/tool/node.js/microservices-architecture
49%
tool
Similar content

Temporal: Stop Losing Work in Distributed Systems - An Overview

The workflow engine that handles the bullshit so you don't have to

Temporal
/tool/temporal/overview
47%
tool
Similar content

Service Mesh Troubleshooting Guide: Debugging & Fixing Errors

Production Debugging That Actually Works

/tool/servicemesh/troubleshooting-guide
46%
integration
Recommended

Connecting ClickHouse to Kafka Without Losing Your Sanity

Three ways to pipe Kafka events into ClickHouse, and what actually breaks in production

ClickHouse
/integration/clickhouse-kafka/production-deployment-guide
43%
integration
Recommended

Setting Up Prometheus Monitoring That Won't Make You Hate Your Job

How to Connect Prometheus, Grafana, and Alertmanager Without Losing Your Sanity

Prometheus
/integration/prometheus-grafana-alertmanager/complete-monitoring-integration
42%
tool
Similar content

Kong Gateway: Cloud-Native API Gateway Overview & Features

Explore Kong Gateway, the open-source, cloud-native API gateway built on NGINX. Understand its core features, pricing structure, and find answers to common FAQs

Kong Gateway
/tool/kong/overview
40%
tool
Similar content

Service Mesh: Understanding How It Works & When to Use It

Explore Service Mesh: Learn how this proxy layer manages network traffic for microservices, understand its core functionality, and discover when it truly benefi

/tool/servicemesh/overview
40%
tool
Similar content

KrakenD API Gateway: Fast, Open Source API Management Overview

The fastest stateless API Gateway that doesn't crash when you actually need it

Kraken.io
/tool/kraken/overview
36%
howto
Similar content

Master Microservices Setup: Docker & Kubernetes Guide 2025

Split Your Monolith Into Services That Will Break in New and Exciting Ways

Docker
/howto/setup-microservices-docker-kubernetes/complete-setup-guide
31%
tool
Similar content

Istio Service Mesh: Real-World Complexity, Benefits & Deployment

The most complex way to connect microservices, but it actually works (eventually)

Istio
/tool/istio/overview
29%
tool
Recommended

Google Kubernetes Engine (GKE) - Google's Managed Kubernetes (That Actually Works Most of the Time)

Google runs your Kubernetes clusters so you don't wake up to etcd corruption at 3am. Costs way more than DIY but beats losing your weekend to cluster disasters.

Google Kubernetes Engine (GKE)
/tool/google-kubernetes-engine/overview
25%
review
Recommended

Kubernetes Enterprise Review - Is It Worth The Investment in 2025?

integrates with Kubernetes

Kubernetes
/review/kubernetes/enterprise-value-assessment
25%

Recommendations combine user behavior, content similarity, research intelligence, and SEO optimization