Reality Check: What You're Getting Into

This setup gives you monitoring that doesn't suck when production catches fire:

  • Metrics that matter: Prometheus scraping app metrics (not just "CPU is 50%")
  • Trace everything: Jaeger showing which service is bottlenecking your requests
  • Dashboards that work: Grafana displaying data you can actually use at 3am
  • One data pipeline: OpenTelemetry Collector so you don't configure 12 different exporters

Prerequisites (AKA "Shit You Need Before Starting")

Required or you're fucked:

  • Docker Desktop with 8GB+ RAM allocated (4GB minimum if you hate yourself)
  • Docker Compose that actually works (not the old Python version)
  • Basic Docker knowledge (you know what docker ps does)
  • Patience for when things randomly break

For Kubernetes (prepare for pain):

  • K8s cluster that doesn't randomly restart pods
  • Helm installed and working
  • kubectl configured properly (test with kubectl get nodes)
  • At least 16GB total RAM across your cluster (seriously, don't cheap out)

The Stack (What Each Thing Actually Does)

OpenTelemetry Collector routes your telemetry data without the pain of configuring exporters in every damn service. Worked great on my setup until I needed custom processing - spent 4 hours reading YAML documentation trying to figure out why my processor kept barfing with failed to build pipelines: service "pipelines" has no listeners. Still don't understand half the OpenTelemetry specification, but the contrib distributions have all the processors that actually work.

Prometheus stores your metrics and doesn't crash when you ask it questions. Latest versions supposedly have better memory handling - something about Remote Write improvements that cut memory usage, though honestly I haven't seen dramatic changes in my setup. Check the official docs, PromQL guide, and best practices before you start collecting everything.

Jaeger shows you request traces so you can see that user auth is taking 2 seconds because someone added a database call in a loop. The newer versions work better with OpenTelemetry out of the box, though I still had to mess with the config for an hour. The Jaeger documentation covers deployment, while sampling strategies prevent you from drowning in trace data.

Grafana makes dashboards that look good in demos and confusing in production. Grafana 11 added AI features that are basically useless, and their query builder still makes me want to punch my screen. Just steal from community dashboards - someone else already did the hard work. The provisioning docs will save you from clicking through the UI 50 times to recreate your dashboards. Also check the Grafana getting started guide and dashboard optimization tips for faster loading.

Reality Check: Cost and Time

Time investment:

  • Docker setup: 2-3 hours if Docker behaves, 8 hours if it doesn't (spent a whole Saturday wrestling with Docker Desktop on M1 Mac)
  • Kubernetes production setup: 2-3 days minimum (more like a week if you hit the CrashLoopBackOff hell)
  • Getting useful dashboards: 1 week of tweaking (and cursing at Grafana's query builder)

Infrastructure costs (prepare your wallet):

  • Development: probably 50-100 bucks a month, maybe more if you're not paying attention to retention settings
  • Production: anywhere from a few hundred to fuck-knows-how-much depending on how much data you hoard (bills went completely nuts when someone cranked up retention to a year or something stupid - think it was over a grand that month, maybe more)

Essential cost planning: AWS CloudWatch pricing if you're going cloud, the CNCF landscape for open source alternatives when you're tired of vendor bills, Grafana performance considerations, and Prometheus best practices to avoid shooting yourself in the foot.

The real cost: A DevOps person who understands this stack, because when Prometheus OOMs at 2am, you need someone who knows why.

Free is never free when you factor in the human time to make it work.

Dashboard Metrics Visualization

Observability in MicroServices: Serilog, Grafana, OpenTelemetry, Jaeger, Prometheus & Grafana Loki by Five Minute Tech

## Microservices Observability with OpenTelemetry (17 mins)

This Five Minute Tech walkthrough shows you the real setup without the usual YouTube bullshit. Goes through Serilog, Grafana, OpenTelemetry, Jaeger, and Prometheus integration.

Watch: Observability in MicroServices: Serilog, Grafana, OpenTelemetry, Jaeger, Prometheus & Grafana Loki

What you'll actually learn:
- Complete observability stack setup with working configs (actual YAML, not pseudo-code)
- OpenTelemetry integration that doesn't break your app (learned this after it broke mine twice)
- Dashboard creation without the Grafana query builder confusion
- How to connect everything without reading 12 different docs
- Real troubleshooting when things inevitably fail (around 14:30 mark when his collector crashes)

Why this one doesn't suck:
Relatively recent upload, shows actual working code, and covers the full observability pipeline. The presenter actually debugs the OTEL_EXPORTER_OTLP_ENDPOINT error instead of pretending everything works perfectly. Plus he admits when he fucks up the YAML indentation at 9:15.

📺 YouTube

Docker Setup: Copy-Paste This and Pray

Prometheus and Grafana Architecture

The Docker Compose That Actually Works

Here's the docker-compose.yml that murdered my weekend the first time I tried to set this up. Copy this exactly - don't be like me and think you can "improve" it. Wasted 2 hours wondering why otel-collector:4317 kept throwing connection errors before I realized Docker networking ignores your /etc/hosts file. This config follows Docker Compose best practices, container observability patterns, and Docker networking fundamentals - read those or you'll hit the same stupid networking issues I did.

version: '3.8'

services:
  # OpenTelemetry Collector - Routes telemetry data
  otel-collector:
    image: otel/opentelemetry-collector-contrib:latest
    command: ["--config=/etc/otel-collector-config.yaml"]
    volumes:
      - ./otel-collector-config.yaml:/etc/otel-collector-config.yaml
    ports:
      - "4317:4317"   # OTLP gRPC receiver
      - "4318:4318"   # OTLP HTTP receiver
      - "8889:8889"   # Prometheus metrics endpoint
    depends_on:
      - jaeger-all-in-one
    networks:
      - observability

  # Prometheus - Metrics storage
  prometheus:
    image: prom/prometheus:latest
    command:
      - '--config.file=/etc/prometheus/prometheus.yml'
      - '--storage.tsdb.path=/prometheus'
      - '--web.console.libraries=/etc/prometheus/console_libraries'
      - '--web.console.templates=/etc/prometheus/consoles'
      - '--web.enable-lifecycle'
    ports:
      - "9090:9090"
    volumes:
      - ./prometheus.yml:/etc/prometheus/prometheus.yml
      - prometheus-data:/prometheus
    networks:
      - observability

  # Jaeger - Tracing
  jaeger-all-in-one:
    image: jaegertracing/all-in-one:latest
    ports:
      - "16686:16686"  # Jaeger UI
      - "14250:14250"  # gRPC endpoint
    environment:
      - COLLECTOR_OTLP_ENABLED=true
    networks:
      - observability

  # Grafana - Dashboards
  grafana:
    image: grafana/grafana:10.2.2
    ports:
      - "3000:3000"
    volumes:
      - grafana-data:/var/lib/grafana
      - ./grafana/provisioning:/etc/grafana/provisioning
    environment:
      - GF_SECURITY_ADMIN_PASSWORD=admin
      - GF_USERS_ALLOW_SIGN_UP=false
    networks:
      - observability

volumes:
  prometheus-data:
  grafana-data:

networks:
  observability:
    driver: bridge

OpenTelemetry Collector Configuration

Create otel-collector-config.yaml:

receivers:
  otlp:
    protocols:
      grpc:
        endpoint: 0.0.0.0:4317
      http:
        endpoint: 0.0.0.0:4318

processors:
  batch:
    timeout: 1s
    send_batch_size: 1024
  memory_limiter:
    limit_mib: 512

exporters:
  prometheus:
    endpoint: "0.0.0.0:8889"
    const_labels:
      cluster: "local"
  jaeger:
    endpoint: jaeger-all-in-one:14250
    tls:
      insecure: true

service:
  pipelines:
    traces:
      receivers: [otlp]
      processors: [memory_limiter, batch]
      exporters: [jaeger]
    metrics:
      receivers: [otlp]
      processors: [memory_limiter, batch]
      exporters: [prometheus]

Prometheus Configuration

Create prometheus.yml:

global:
  scrape_interval: 15s
  evaluation_interval: 15s

rule_files:
  # - "first_rules.yml"
  # - "second_rules.yml"

scrape_configs:
  - job_name: 'prometheus'
    static_configs:
      - targets: ['localhost:9090']

  - job_name: 'otel-collector'
    static_configs:
      - targets: ['otel-collector:8889']
    scrape_interval: 10s

  # Add your application endpoints here
  - job_name: 'microservices'
    static_configs:
      - targets: ['app1:8080', 'app2:8081']
    metrics_path: '/metrics'
    scrape_interval: 10s

Getting This Shit Running

Warning: This will use 4GB+ RAM. Docker Desktop will hate you if you're running on 8GB total.

  1. Create the dirs (or it'll fail silently):

    mkdir observability-stack && cd observability-stack
    mkdir -p grafana/provisioning/{dashboards,datasources}
    # Yes, you need those specific directories or Grafana won't start
    
  2. Start everything:

    docker-compose up -d
    # If this fails with "network not found", run it again. Docker networking is weird.
    
  3. Check if anything died:

    docker-compose ps
    # If anything shows "Exit 1", check logs: docker-compose logs [service-name]
    
  4. Access the UIs (if they actually started):

    • Grafana: localhost port 3000 (admin/admin) - takes 30 seconds to boot
    • Prometheus: localhost port 9090 - should be immediate
    • Jaeger: localhost port 16686 - takes 30 seconds to show traces

When everything goes to shit:

  • Port 3000 taken? Kill whatever's hogging it (usually a zombie React dev server): lsof -ti:3000 | xargs kill -9
  • Grafana refuses to start? Check the grafana/provisioning dirs exist (forgot this 3 different times like an idiot)
  • OTel Collector crashes with no such file or directory? Your config file path is wrong or someone fucked up the YAML
  • Everything shows "Exited (1)"? Classic tabs vs spaces YAML nightmare

This setup creates a "observability" Docker network so containers can talk to each other. The volumes persist data so you don't lose metrics when containers restart.

Essential reading: Docker networking guide when containers won't talk, resource limits before you OOM everything, Docker Compose troubleshooting, and OpenTelemetry Collector config reference. Also check Prometheus configuration docs and Grafana provisioning guide to avoid manual setup hell.

Kubernetes: Where Your Budget Goes to Die

Kubernetes Architecture

Docker setup working? Awesome. Now for the part where your bank account starts crying - making this shit work on Kubernetes. Everything gets 10x more expensive and complex, but you also get actual scalability instead of praying your single Docker host doesn't die. I learned this lesson when my first K8s observability setup nuked production for 2 hours because I didn't set resource limits and Prometheus ate every byte of RAM on the cluster.

Helm Charts (Because Manual YAML is Masochism)

Kubernetes deployment is where costs explode and complexity multiplies. Helm charts keep you from manually editing YAML files at 3am when production is burning. The Kubernetes monitoring guide covers the fundamentals, while the Kubernetes architecture docs and resource management guide prevent you from blowing your budget. Also check Grafana's high cardinality management to avoid performance hell.

1. Add Required Helm Repositories

## Add OpenTelemetry repository (check the [OpenTelemetry Helm charts](https://github.com/open-telemetry/opentelemetry-helm-charts) for latest)
helm repo add open-telemetry https://github.com/open-telemetry/opentelemetry-helm-charts

## Add Prometheus community charts (see [Prometheus community](https://prometheus-community.github.io/helm-charts))
helm repo add prometheus-community https://prometheus-community.github.io/helm-charts

## Add Grafana repository (check [Grafana charts](https://grafana.github.io/helm-charts))
helm repo add grafana https://grafana.github.io/helm-charts

## Add Jaeger repository (visit [Jaeger charts](https://jaegertracing.github.io/helm-charts))
helm repo add jaegertracing https://jaegertracing.github.io/helm-charts

## Update repositories
helm repo update

2. Deploy OpenTelemetry Collector

Create otel-collector-values.yaml:

mode: deployment
replicaCount: 2

config:
  receivers:
    otlp:
      protocols:
        grpc:
          endpoint: 0.0.0.0:4317
        http:
          endpoint: 0.0.0.0:4318
  processors:
    batch:
      timeout: 1s
      send_batch_size: 1024
    memory_limiter:
      limit_mib: 512
    k8sattributes:
      auth_type: "serviceAccount"
      passthrough: false
      extract:
        metadata:
          - k8s.pod.name
          - k8s.pod.uid
          - k8s.deployment.name
          - k8s.namespace.name
  exporters:
    prometheus:
      endpoint: "0.0.0.0:8889"
      const_labels:
        cluster: "production"
    jaeger:
      endpoint: jaeger-collector:14250
      tls:
        insecure: true
  service:
    pipelines:
      traces:
        receivers: [otlp]
        processors: [memory_limiter, k8sattributes, batch]
        exporters: [jaeger]
      metrics:
        receivers: [otlp]
        processors: [memory_limiter, k8sattributes, batch]
        exporters: [prometheus]

resources:
  limits:
    cpu: 500m
    memory: 1Gi
  requests:
    cpu: 250m
    memory: 512Mi

service:
  type: ClusterIP

Deploy with:

helm install otel-collector open-telemetry/opentelemetry-collector \
  -f otel-collector-values.yaml \
  -n observability --create-namespace

3. Deploy Jaeger

helm install jaeger jaegertracing/jaeger \
  --set provisionDataStore.cassandra=false \
  --set provisionDataStore.elasticsearch=true \
  --set storage.type=elasticsearch \
  --set elasticsearch.replicas=1 \
  --set elasticsearch.minimumMasterNodes=1 \
  -n observability

4. Deploy Prometheus Stack

Create prometheus-values.yaml:

prometheus:
  prometheusSpec:
    retention: 30d
    resources:
      requests:
        memory: 2Gi
        cpu: 500m
      limits:
        memory: 4Gi
        cpu: 1000m
    storageSpec:
      volumeClaimTemplate:
        spec:
          storageClassName: fast-ssd
          accessModes: ["ReadWriteOnce"]
          resources:
            requests:
              storage: 50Gi

grafana:
  adminPassword: "secure-password-here"
  persistence:
    enabled: true
    size: 10Gi
  resources:
    requests:
      memory: 256Mi
      cpu: 100m
    limits:
      memory: 512Mi
      cpu: 500m

alertmanager:
  alertmanagerSpec:
    resources:
      requests:
        memory: 256Mi
        cpu: 100m
      limits:
        memory: 512Mi
        cpu: 500m

Deploy with:

helm install prometheus prometheus-community/kube-prometheus-stack \
  -f prometheus-values.yaml \
  -n observability

5. Configure Service Discovery

Create ServiceMonitor for automatic metrics discovery:

apiVersion: monitoring.coreos.com/v1
kind: ServiceMonitor
metadata:
  name: otel-collector
  namespace: observability
spec:
  selector:
    matchLabels:
      app.kubernetes.io/name: opentelemetry-collector
  endpoints:
  - port: prometheus
    interval: 10s
    path: /metrics

Apply with:

kubectl apply -f servicemonitor.yaml

6. Verify Production Deployment

## Check all pods are running
kubectl get pods -n observability

## Port-forward to access UIs
kubectl port-forward -n observability svc/prometheus-grafana 3000:80
kubectl port-forward -n observability svc/jaeger-query 16686:16686

## Check metrics collection
kubectl port-forward -n observability svc/prometheus-kube-prometheus-prometheus 9090:9090

Production Reality Check

Resource planning (prepare your wallet):

  • Prometheus: probably need 4-8GB RAM, maybe more if you're not careful about retention
  • Grafana: 1GB RAM (512MB if you hate performance)
  • Jaeger with Elasticsearch: 8GB+ RAM total or it'll crash randomly
  • OTel Collector: 1GB RAM (scales with throughput, will OOM if you don't set limits)

Total infrastructure cost: anywhere from 500 to fuck-knows-how-much per month depending on cluster size and cloud provider - could be way more if you're not watching the bills.

High availability (because single points of failure suck):
Deploy 3 replicas minimum for critical components. Use pod anti-affinity or you'll get all replicas on the same node that dies during an update. Check the Kubernetes deployment patterns and pod disruption budgets guides.

Security (so you don't get fired):

  • Enable RBAC (default in most managed K8s now)
  • NetworkPolicies to prevent lateral movement
  • TLS everywhere (pain in the ass but necessary)
  • Don't use default passwords (looking at you, Grafana admin/admin)

ServiceMonitors are useless without Prometheus Operator installed first. Another moving piece to deploy and manage. Spent a full day wondering why Prometheus completely ignored my ServiceMonitors before discovering you need the CRDs installed first. The kube-prometheus-stack bundles everything together, so just use that instead of cobbling together individual components like I did.

Must-read: Kubernetes monitoring architecture, resource management, the Prometheus community charts, Jaeger Kubernetes deployment guide, and GeekGrove's optimization guide or you'll blow your budget.

Instrumenting Your Apps: Where Things Break

Microservices Telemetry Architecture

Got your monitoring stack running? Cool. Now for the part that'll make you question your career choices - getting your applications to send data that doesn't suck. Most people either instrument everything and tank their performance, or instrument nothing and wonder why their traces are empty. I went full idiot on my first attempt and instrumented every database call - ended up with 50,000 spans per request and a trace that looked like a Christmas tree.

Adding Telemetry Without Breaking Everything

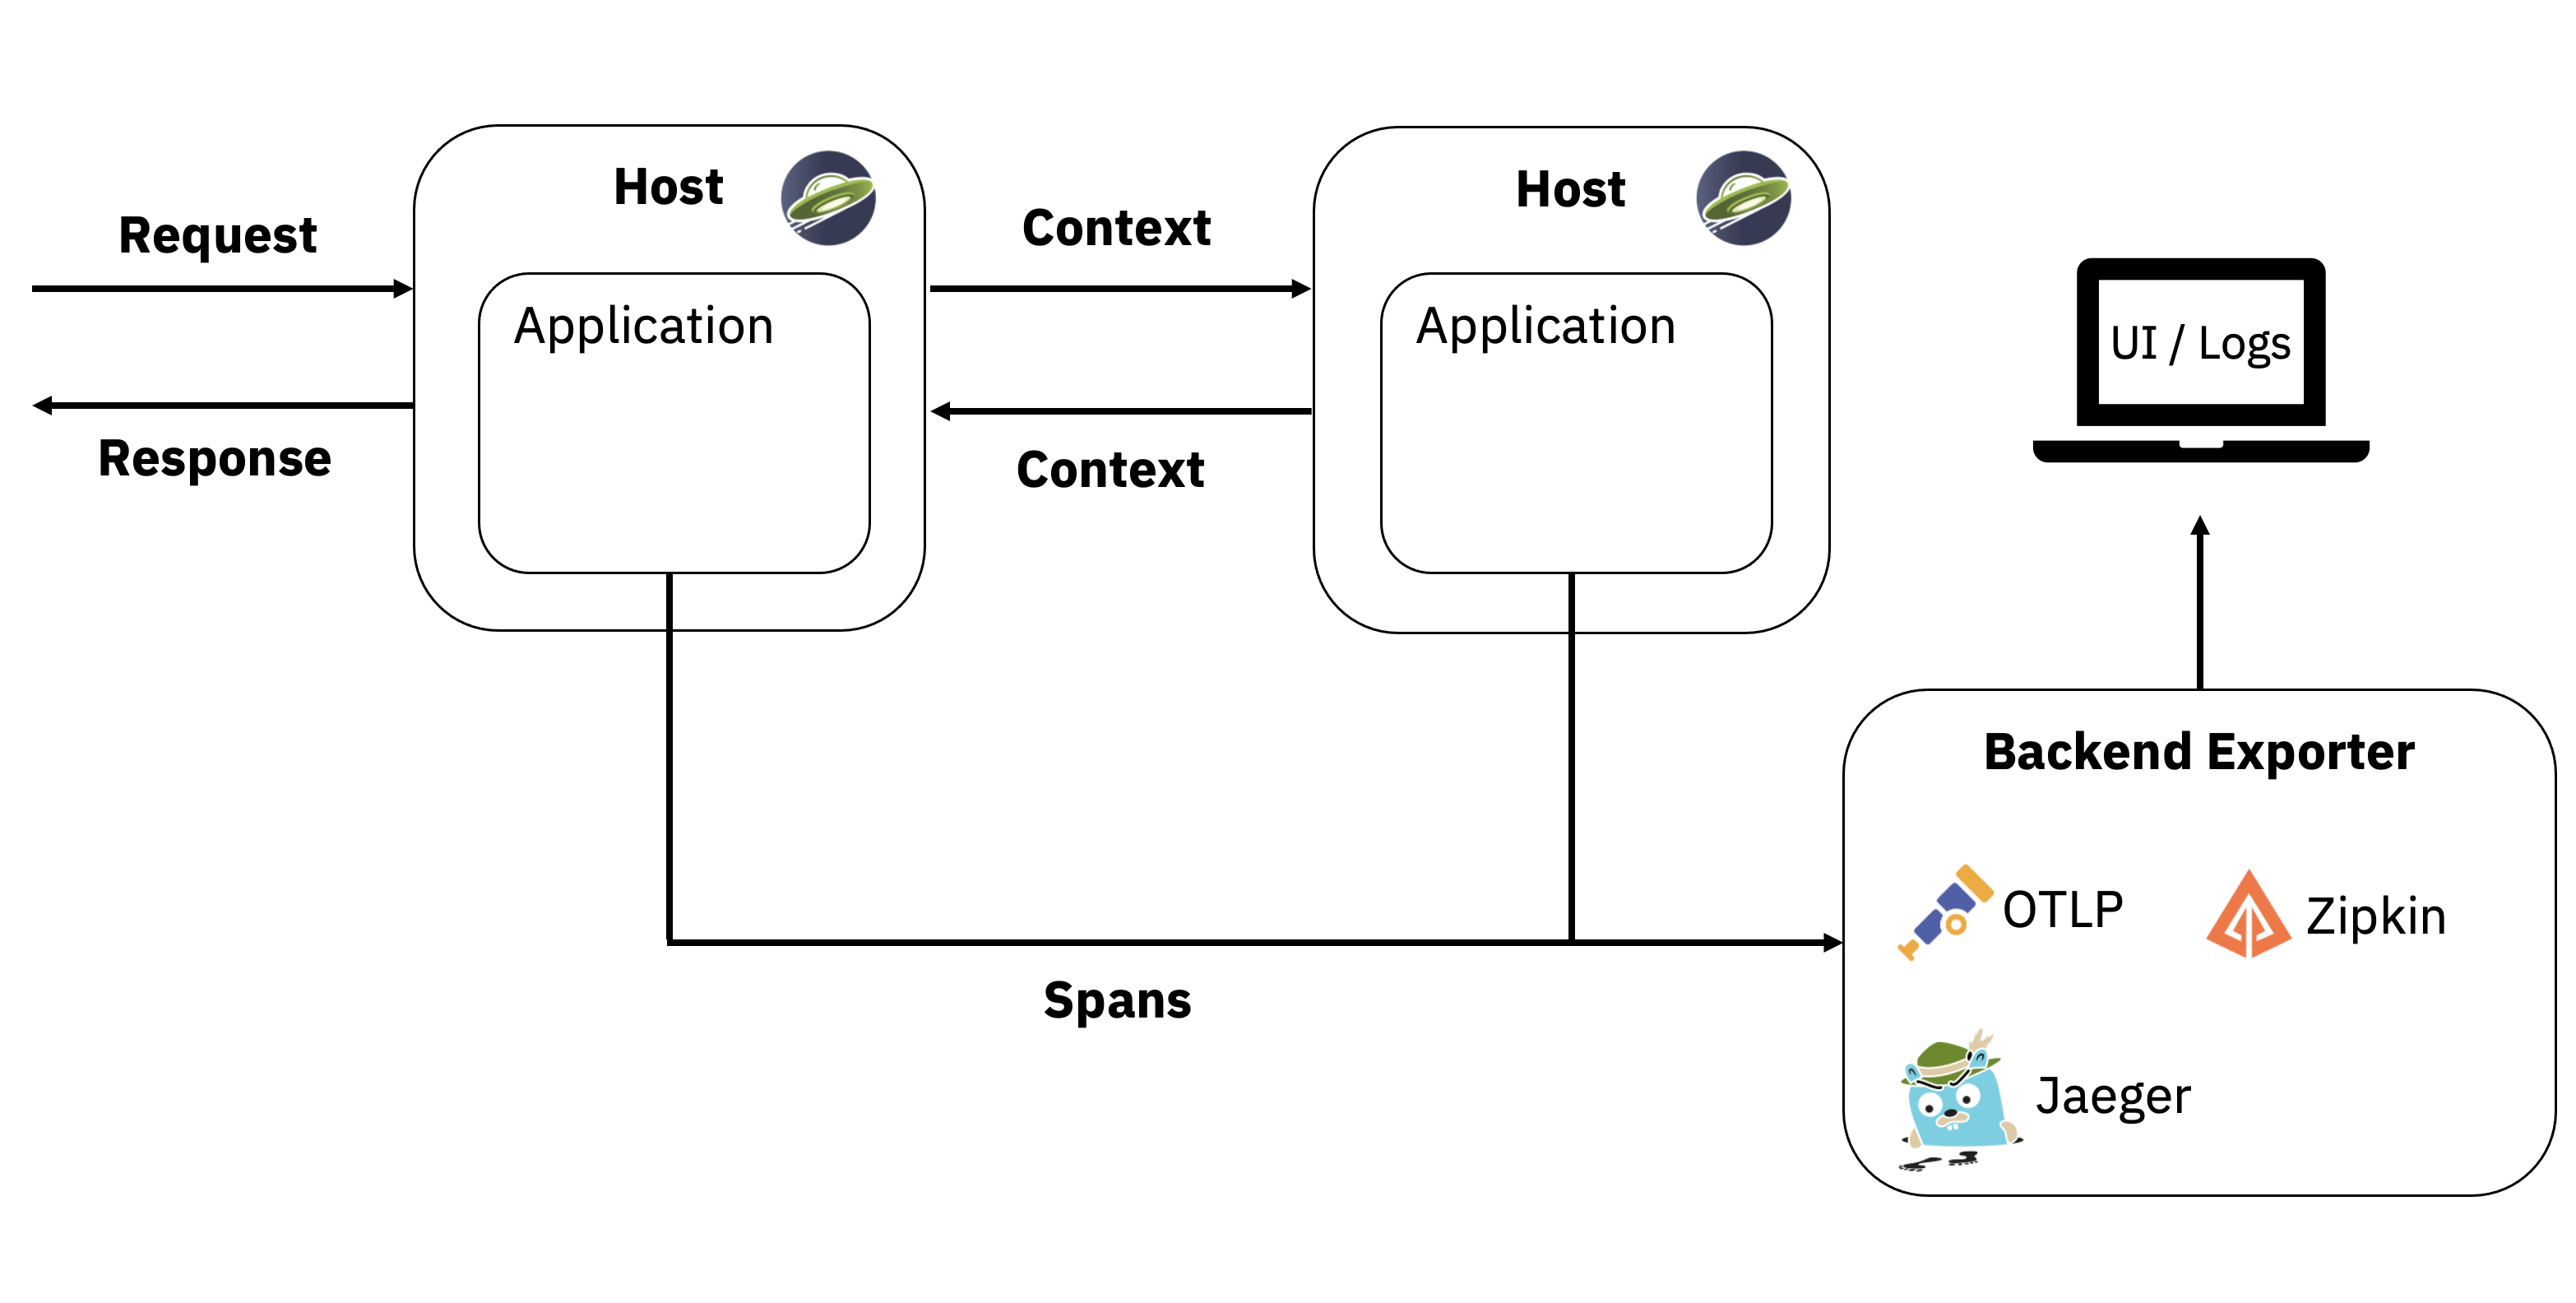
The OpenTelemetry documentation is your friend here, especially the semantic conventions that define what attributes you should actually be tracking. Also worth reading: the Spring Boot starter guide and OpenTelemetry troubleshooting for Node.js for platform-specific gotchas.

Java/Spring Boot Applications

Add OpenTelemetry dependencies to your pom.xml (check the OpenTelemetry Java instrumentation repo for latest versions):

<dependency>
    <groupId>io.opentelemetry</groupId>
    <artifactId>opentelemetry-api</artifactId>
    <version>1.30.0</version>
</dependency>
<dependency>
    <groupId>io.opentelemetry</groupId>
    <artifactId>opentelemetry-sdk</artifactId>
    <version>1.30.0</version>
</dependency>
<dependency>
    <groupId>io.opentelemetry</groupId>
    <artifactId>opentelemetry-exporter-otlp</artifactId>
    <version>1.30.0</version>
</dependency>
<dependency>
    <groupId>io.opentelemetry.instrumentation</groupId>
    <artifactId>opentelemetry-spring-boot-starter</artifactId>
    <version>1.32.0</version>
</dependency>

Configure in application.yml:

management:
  otlp:
    metrics:
      export:
        enabled: true
        url: http://otel-collector:4318/v1/metrics
    tracing:
      export:
        enabled: true
        url: http://otel-collector:4318/v1/traces

spring:
  application:
    name: user-service

otel:
  exporter:
    otlp:
      endpoint: http://otel-collector:4318
  service:
    name: ${spring.application.name}
  resource:
    attributes:
      service.version: 1.0.0

Node.js Applications

Install these packages (and pray npm doesn't break something else):

npm install @opentelemetry/api \
           @opentelemetry/sdk-node \
           @opentelemetry/exporter-otlp-http \
           @opentelemetry/instrumentation-http \
           @opentelemetry/instrumentation-express

Warning: Node.js instrumentation seems to break hot reload - at least it did for me. Spent a whole afternoon convinced my Express app was fucked before realizing the OpenTelemetry HTTP instrumentation was making nodemon have a seizure every time I saved a file. The tracing library hooks into HTTP requests and apparently that confuses the hell out of nodemon's file watching. The Node.js instrumentation docs mention this gotcha, and there's a GitHub issue about performance slowdown that affects development too.

Create tracing.js:

const { NodeSDK } = require('@opentelemetry/sdk-node');
const { OTLPTraceExporter } = require('@opentelemetry/exporter-otlp-http');
const { OTLPMetricExporter } = require('@opentelemetry/exporter-otlp-http');
const { HttpInstrumentation } = require('@opentelemetry/instrumentation-http');
const { ExpressInstrumentation } = require('@opentelemetry/instrumentation-express');

const traceExporter = new OTLPTraceExporter({
  url: 'http://otel-collector:4318/v1/traces',
});

const metricExporter = new OTLPMetricExporter({
  url: 'http://otel-collector:4318/v1/metrics',
});

const sdk = new NodeSDK({
  traceExporter,
  metricExporter,
  instrumentations: [
    new HttpInstrumentation(),
    new ExpressInstrumentation(),
  ],
  serviceName: 'order-service',
  serviceVersion: '1.0.0',
});

sdk.start();

Import this file at the top of your main application file:

require('./tracing');
const express = require('express');
const app = express();

Python Applications

Install OpenTelemetry packages:

pip install opentelemetry-api \
           opentelemetry-sdk \
           opentelemetry-exporter-otlp \
           opentelemetry-instrumentation-flask \
           opentelemetry-instrumentation-requests

Gotcha: Python Flask auto-instrumentation works until you use async views, then it gets confused. FlaskInstrumentor doesn't handle async def route handlers well - at least in my experience. Burned 3 hours wondering why my async endpoints were invisible in traces - turns out you need manual span management for anything touching asyncio. Check the OpenTelemetry Python docs and instrumentation libraries guide for the latest async support.

Create instrumentation setup:

from opentelemetry import trace, metrics
from opentelemetry.sdk.trace import TracerProvider
from opentelemetry.sdk.metrics import MeterProvider
from opentelemetry.exporter.otlp.proto.http.trace_exporter import OTLPSpanExporter
from opentelemetry.exporter.otlp.proto.http.metric_exporter import OTLPMetricExporter
from opentelemetry.sdk.trace.export import BatchSpanProcessor
from opentelemetry.instrumentation.flask import FlaskInstrumentor
from opentelemetry.instrumentation.requests import RequestsInstrumentor

## Configure tracing
trace.set_tracer_provider(TracerProvider())
tracer = trace.get_tracer(__name__)

otlp_exporter = OTLPSpanExporter(
    endpoint="http://otel-collector:4318/v1/traces"
)
span_processor = BatchSpanProcessor(otlp_exporter)
trace.get_tracer_provider().add_span_processor(span_processor)

## Configure metrics
metrics.set_meter_provider(MeterProvider())
meter = metrics.get_meter(__name__)

## Instrument Flask and requests
FlaskInstrumentor().instrument()
RequestsInstrumentor().instrument()

Custom Metrics and Traces

Adding Business Metrics

Java example with custom metrics:

@RestController
public class OrderController {
    
    private final Counter orderCounter;
    private final Timer orderProcessingTime;
    
    public OrderController(MeterRegistry meterRegistry) {
        this.orderCounter = Counter.builder("orders.created")
            .description("Number of orders created")
            .tag("service", "order-service")
            .register(meterRegistry);
            
        this.orderProcessingTime = Timer.builder("order.processing.time")
            .description("Time taken to process orders")
            .register(meterRegistry);
    }
    
    @PostMapping("/orders")
    public ResponseEntity<Order> createOrder(@RequestBody Order order) {
        return orderProcessingTime.recordCallable(() -> {
            Order savedOrder = orderService.save(order);
            orderCounter.increment();
            return ResponseEntity.ok(savedOrder);
        });
    }
}

Adding Custom Spans

@Service
public class PaymentService {
    
    private final Tracer tracer;
    
    public PaymentService() {
        this.tracer = GlobalOpenTelemetry.getTracer("payment-service");
    }
    
    public PaymentResult processPayment(PaymentRequest request) {
        Span span = tracer.spanBuilder("payment.process")
            .setAttribute("payment.amount", request.getAmount())
            .setAttribute("payment.currency", request.getCurrency())
            .startSpan();
            
        try (Scope scope = span.makeCurrent()) {
            // Payment processing logic
            PaymentResult result = doPaymentProcessing(request);
            
            span.setStatus(StatusCode.OK);
            span.setAttribute("payment.result", result.getStatus());
            
            return result;
        } catch (Exception e) {
            span.recordException(e);
            span.setStatus(StatusCode.ERROR, "Payment processing failed");
            throw e;
        } finally {
            span.end();
        }
    }
}

Environment Configuration

Docker Environment Variables

services:
  user-service:
    environment:
      - OTEL_EXPORTER_OTLP_ENDPOINT=http://otel-collector:4318
      - OTEL_SERVICE_NAME=user-service
      - OTEL_SERVICE_VERSION=1.0.0
      - OTEL_RESOURCE_ATTRIBUTES=service.name=user-service,service.version=1.0.0

  order-service:
    environment:
      - OTEL_EXPORTER_OTLP_ENDPOINT=http://otel-collector:4318
      - OTEL_SERVICE_NAME=order-service
      - OTEL_SERVICE_VERSION=1.0.0

Kubernetes ConfigMap

apiVersion: v1
kind: ConfigMap
metadata:
  name: otel-config
data:
  OTEL_EXPORTER_OTLP_ENDPOINT: "http://otel-collector:4318"
  OTEL_SERVICE_VERSION: "1.0.0"
  OTEL_RESOURCE_ATTRIBUTES: "cluster=production,environment=prod"

Auto-instrumentation reality check:

  • Java Spring Boot starter works but tacks on 200ms to startup. Still worth it for not manually instrumenting everything.
  • Node.js auto-instrumentation grabs most HTTP calls but murders hot reload (cost me 4 hours of debugging)
  • Python Flask instrumentation is fine until you need custom spans or async views, then you're on your own
  • All of them vomit massive amounts of data in prod - set sampling rates or watch your AWS bill go insane (we generated crazy amounts of trace data - had to be 50TB or more the first month)

Production tips I wish someone told me earlier:

  • Use environment variables for config - hard-coding collector URLs is some junior-level bullshit
  • Set OTEL_SERVICE_NAME or all your traces show up as "unknown_service" and you'll want to delete everything
  • Set sampling rates or go bankrupt (1% for busy apps, 100% only for dev - bills jumped to like 3K or something before I figured this out)
  • Watch instrumentation overhead - this shit adds 50-100ms to every request (yes, monitoring makes your app slower)

Key references: OpenTelemetry Java SDK for implementation, sampling strategies to avoid bankruptcy, Baeldung's Spring Boot setup guide, the Aspecto troubleshooting checklist, and SigNoz instrumentation guide for production examples.

Shit That Will Break (And How to Fix It)

Q

Prometheus keeps showing "context deadline exceeded" errors

A

Your PromQL query is too expensive and timing out. This happens when you query high-cardinality metrics or use inefficient functions. Hit this error 20 times before I realized I was querying metrics with user IDs as labels.

What worked for me (sometimes):

  • Simplify your query or throw more RAM at it (I threw RAM at it, still timed out)
  • Bump --query.timeout from 2 minutes to 5 minutes - don't ask me why this helps
  • Create recording rules to pre-calculate the expensive shit (this actually saved my dashboard that was murdering Prometheus)
  • Stop using rate() on metrics with 10k+ series unless you enjoy waiting
  • Sometimes restarting Prometheus fixes it temporarily - no clue why

Example fix: Instead of rate(http_requests_total[5m]), create a recording rule that computes this every minute. Check the query performance guide and cardinality debugging.

Q

Can't curl the metrics endpoint and Prometheus shows "connection refused"

A

Your app isn't exposing metrics or Docker networking is fucked.

Shit to try:

  1. Can you actually curl that metrics endpoint from inside the container? (usually no)
  2. Are you using localhost instead of the service name? (Use app:8080, not localhost:8080) - made this mistake like 10 times
  3. Is the app even listening on the port you think it is? Check with netstat -ln or whatever

Command to test: docker exec -it prometheus curl http://your-app:port/metrics

Q

Grafana dashboards are completely blank

A

Check if your time range includes when your apps were actually running. Rookie mistake #1 that I made 5 different times. Spent 30 minutes debugging "broken" metrics when I was looking at data from last week.

Other causes:

  • Data source isn't configured (test the connection in Grafana)
  • You're querying metrics that don't exist (check in Prometheus UI first)
  • Network issues between Grafana and Prometheus

Pro tip: Always test queries in Prometheus UI (http://localhost:9090) before building Grafana dashboards. Use Grafana's query builder or check dashboard examples.

Q

Jaeger UI shows no traces

A

The collector is probably eating your traces. Check docker-compose logs otel-collector for errors.

Common fuckups:

  • Wrong endpoint URLs (4317 for gRPC, 4318 for HTTP)
  • Sampling is set too low (add OTEL_TRACES_SAMPLER=always_on for testing)
  • Apps aren't actually sending traces (check if instrumentation is enabled)
  • Collector can't reach Jaeger (wrong service name or port)
Q

Docker containers randomly crash with "killed"

A

You're out of memory. The OOM killer is terminating containers.

Quick check: docker stats to see memory usage. If anything is near 100%, that's your problem.

Fixes:

  • Give Docker Desktop more RAM allocation
  • Set memory limits on containers so they don't eat everything
  • Reduce metric retention or sampling rate
Q

OpenTelemetry Collector is in a crash loop

A

Usually a config file issue or resource limits.

Debug steps:

  1. Check the logs: docker-compose logs otel-collector
  2. Is the YAML syntax valid? Use yamllint if you're not sure
  3. Are all the service references correct? (jaeger-all-in-one, not jaeger)
  4. Are you hitting memory limits? Increase the memory_limiter processor
Q

Prometheus is eating 8GB RAM and still wants more

A

High cardinality labels are killing you. Someone used user IDs or timestamps as labels. I've seen this take down entire clusters - classic move by a junior dev who thought putting request IDs in metric labels was a good idea.

Nuclear option: Restart Prometheus with --storage.tsdb.max-bytes=4GB to cap memory usage. No idea why this works but it does.

Actual fix: Hunt down the shitty high-cardinality metrics and murder them. Find labels with thousands of unique values - usually some genius put session tokens or request IDs in labels. Took me like 2 days or more to track down the metric that was using session tokens as labels (yes, fucking session tokens). Use the cardinality explorer and follow metric naming best practices to avoid this nightmare.

Q

"Failed to connect to Docker daemon" when using docker-compose

A

Docker Desktop randomly stops working. Just restart it. This happens more on Windows/Mac.

If that doesn't work:

  • Check if Docker is actually running
  • Try docker ps to see if the daemon is responsive
  • Restart your entire machine (the nuclear option that works 90% of the time)

Additional troubleshooting resources:

Real Talk: Deployment Options

Aspect

Docker Compose

Kubernetes + Helm

Managed Services

Complexity

Easy if Docker works

Medium

  • YAML hell

Easy

  • until you need custom configs

Scalability

Single machine max

Infinite (if you have money)

Auto-scales (expensive)

Cost

Infrastructure only

Infrastructure + the DevOps engineer you'll need to hire

Like 3x more expensive but someone else's problem

Maintenance

You updating everything at 2am when security alerts hit

Automated if you set it up right

Provider handles it

Customization

Change anything you want

Helm overrides for most things

Limited to what they allow

Production Ready

Don't even think about it

Yes, but you need to know what you're doing

Yes, and they'll take the blame

Data Retention

Gone when container dies

Persistent if configured properly

Built-in backups and SLA

Multi-tenancy

One big mess

Namespaces work well

Proper isolation by default

High Availability

Ha, good luck

Works if you configure it right

Built-in redundancy

Resources That Don't Suck

Related Tools & Recommendations

integration
Similar content

Prometheus, Grafana, Alertmanager: Complete Monitoring Stack Setup

How to Connect Prometheus, Grafana, and Alertmanager Without Losing Your Sanity

Prometheus
/integration/prometheus-grafana-alertmanager/complete-monitoring-integration
100%
tool
Similar content

Datadog Security Monitoring: Good or Hype? An Honest Review

Is Datadog Security Monitoring worth it? Get an honest review, real-world implementation tips, and insights into its effectiveness as a SIEM alternative. Avoid

Datadog
/tool/datadog/security-monitoring-guide
43%
compare
Recommended

PostgreSQL vs MySQL vs MongoDB vs Cassandra - Which Database Will Ruin Your Weekend Less?

Skip the bullshit. Here's what breaks in production.

PostgreSQL
/compare/postgresql/mysql/mongodb/cassandra/comprehensive-database-comparison
39%
tool
Recommended

Google Kubernetes Engine (GKE) - Google's Managed Kubernetes (That Actually Works Most of the Time)

Google runs your Kubernetes clusters so you don't wake up to etcd corruption at 3am. Costs way more than DIY but beats losing your weekend to cluster disasters.

Google Kubernetes Engine (GKE)
/tool/google-kubernetes-engine/overview
33%
review
Recommended

Kubernetes Enterprise Review - Is It Worth The Investment in 2025?

integrates with Kubernetes

Kubernetes
/review/kubernetes/enterprise-value-assessment
33%
troubleshoot
Recommended

Fix Kubernetes Pod CrashLoopBackOff - Complete Troubleshooting Guide

integrates with Kubernetes

Kubernetes
/troubleshoot/kubernetes-pod-crashloopbackoff/crashloop-diagnosis-solutions
33%
integration
Recommended

ELK Stack for Microservices - Stop Losing Log Data

How to Actually Monitor Distributed Systems Without Going Insane

Elasticsearch
/integration/elasticsearch-logstash-kibana/microservices-logging-architecture
32%
tool
Similar content

Django Production Deployment Guide: Docker, Security, Monitoring

From development server to bulletproof production: Docker, Kubernetes, security hardening, and monitoring that doesn't suck

Django
/tool/django/production-deployment-guide
29%
troubleshoot
Recommended

Fix MongoDB "Topology Was Destroyed" Connection Pool Errors

Production-tested solutions for MongoDB topology errors that break Node.js apps and kill database connections

MongoDB
/troubleshoot/mongodb-topology-closed/connection-pool-exhaustion-solutions
24%
tool
Recommended

Datadog Production Troubleshooting - When Everything Goes to Shit

Fix the problems that keep you up at 3am debugging why your $100k monitoring platform isn't monitoring anything

Datadog
/tool/datadog/production-troubleshooting-guide
24%
tool
Recommended

Datadog Setup and Configuration Guide - From Zero to Production Monitoring

Get your team monitoring production systems in one afternoon, not six months of YAML hell

Datadog
/tool/datadog/setup-and-configuration-guide
24%
tool
Recommended

Grafana - The Monitoring Dashboard That Doesn't Suck

integrates with Grafana

Grafana
/tool/grafana/overview
23%
tool
Recommended

Prometheus - Scrapes Metrics From Your Shit So You Know When It Breaks

Free monitoring that actually works (most of the time) and won't die when your network hiccups

Prometheus
/tool/prometheus/overview
23%
integration
Recommended

How to Actually Connect Cassandra and Kafka Without Losing Your Shit

integrates with Apache Cassandra

Apache Cassandra
/integration/cassandra-kafka-microservices/streaming-architecture-integration
22%
integration
Recommended

Connecting ClickHouse to Kafka Without Losing Your Sanity

Three ways to pipe Kafka events into ClickHouse, and what actually breaks in production

ClickHouse
/integration/clickhouse-kafka/production-deployment-guide
22%
troubleshoot
Recommended

Your Elasticsearch Cluster Went Red and Production is Down

Here's How to Fix It Without Losing Your Mind (Or Your Job)

Elasticsearch
/troubleshoot/elasticsearch-cluster-health-issues/cluster-health-troubleshooting
22%
troubleshoot
Recommended

Fix Docker Daemon Connection Failures

When Docker decides to fuck you over at 2 AM

Docker Engine
/troubleshoot/docker-error-during-connect-daemon-not-running/daemon-connection-failures
22%
troubleshoot
Recommended

Docker Container Won't Start? Here's How to Actually Fix It

Real solutions for when Docker decides to ruin your day (again)

Docker
/troubleshoot/docker-container-wont-start-error/container-startup-failures
22%
troubleshoot
Recommended

Docker Permission Denied on Windows? Here's How to Fix It

Docker on Windows breaks at 3am. Every damn time.

Docker Desktop
/troubleshoot/docker-permission-denied-windows/permission-denied-fixes
22%
tool
Recommended

OpenTelemetry - Finally, Observability That Doesn't Lock You Into One Vendor

Because debugging production issues with console.log and prayer isn't sustainable

OpenTelemetry
/tool/opentelemetry/overview
20%

Recommendations combine user behavior, content similarity, research intelligence, and SEO optimization