What OpenTelemetry Actually Is (Skip the Marketing BS)

OpenTelemetry exists because observability vendors charge enterprise prices for basic functionality. It's a framework that collects traces, metrics, and logs without forcing you to take out a second mortgage to pay Datadog.

You've got microservices spread across God knows how many containers, and when everything crashes at 2am, you need to know which service started the cascade failure. OpenTelemetry gives you three ways to figure this out:

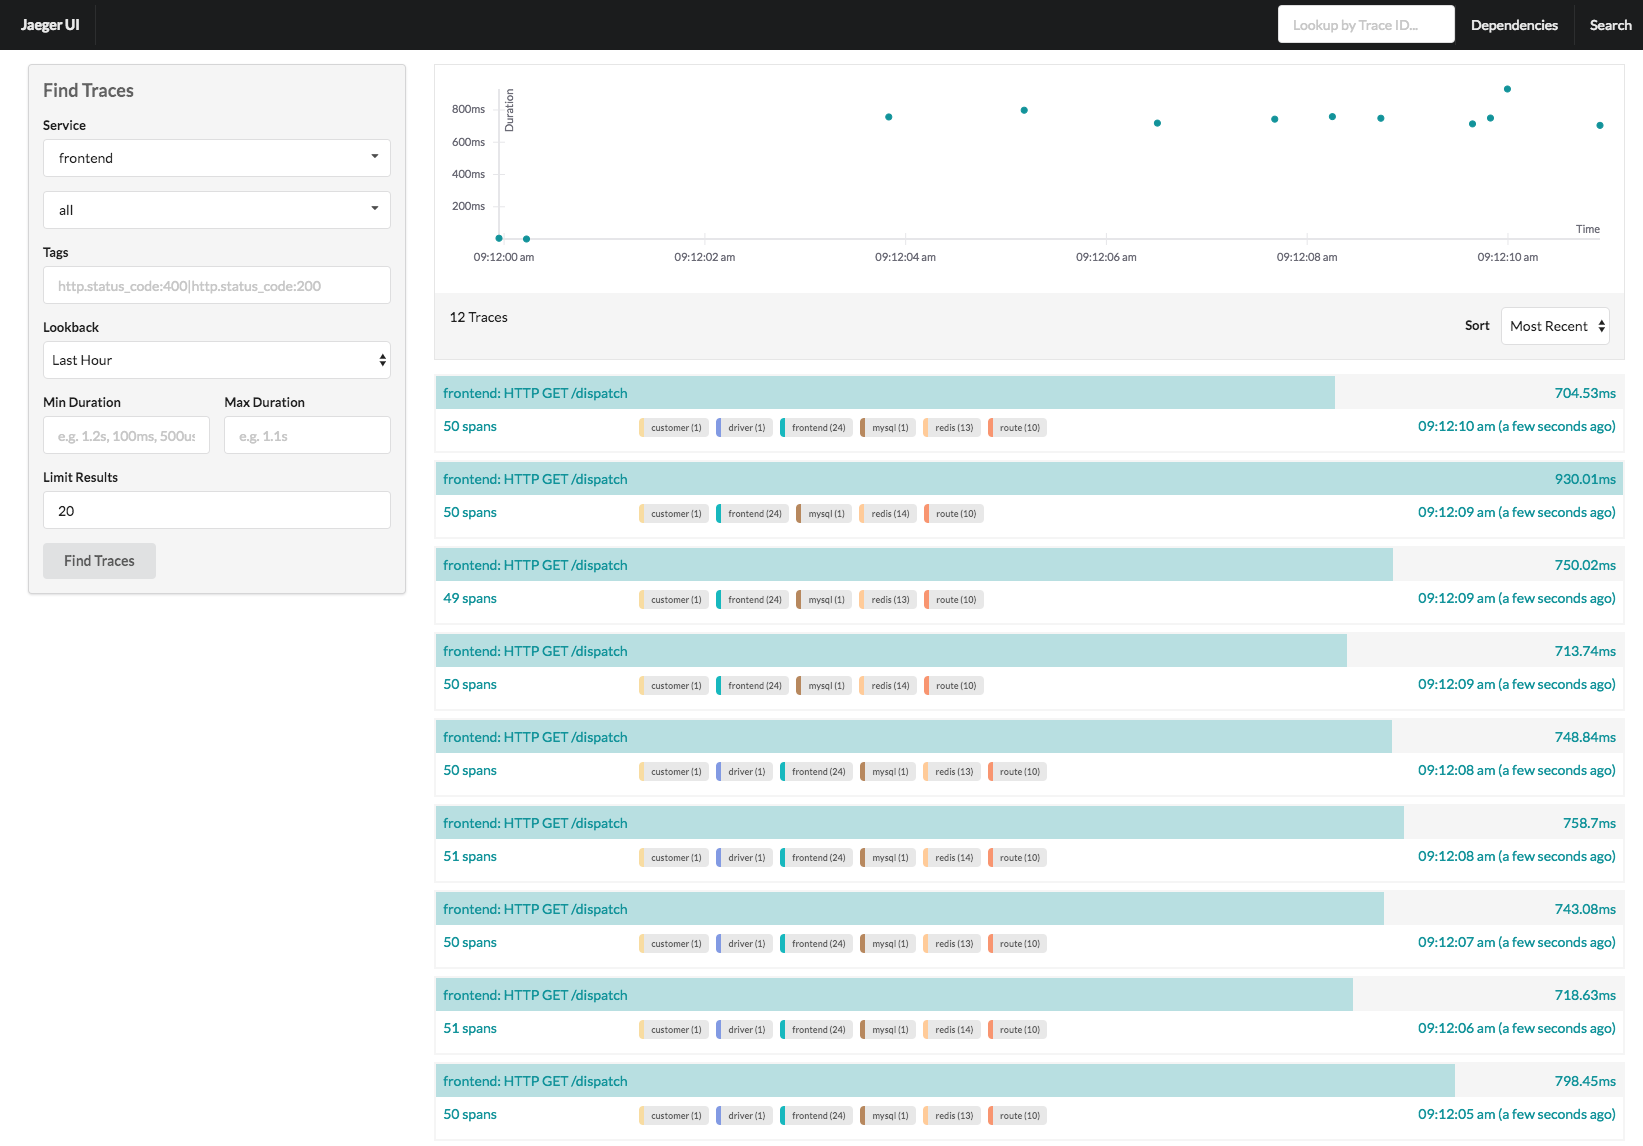
Distributed Tracing (AKA "Follow the Breadcrumbs")

Traces show you exactly where your request went to die. Each span is like a GPS coordinate for your failing API call. Works great until you realize you set sampling to 0.001% and the one error you needed to debug wasn't captured.

Jaeger Tracing Interface

Real talk: Traces are beautiful when they work, but prepare to spend hours debugging why spans randomly disappear into the void. Network timeouts, collector crashes, and misconfigured exporters will make traces vanish faster than your weekend plans.

Metrics (Numbers That Actually Matter)

Metrics tell you your API is slow as molasses before your customers start complaining. Counters, gauges, histograms - the holy trinity of "oh shit, something's wrong."

Jaeger Service Performance Monitoring

Pro tip: Start with basic RED metrics (Rate, Errors, Duration) or your Prometheus storage will explode from high cardinality metrics. Yes, user IDs as labels will kill your database.

Dashboard hell is real - you'll spend more time arguing about dashboard colors and layout than fixing the actual performance issues that are killing your app.

Logs (The Backup Plan)

Logs are still logs, but now they're correlated with traces. Sounds fancy until you realize most log correlation requires manual work and proper trace context propagation.

Vendor Neutrality (The $100k Lesson)

This is the real reason OpenTelemetry exists. When observability vendors jack up prices (and they always do), companies that used OpenTelemetry can switch to Grafana Cloud or self-host Jaeger + Prometheus. Companies locked into proprietary agents? They pay the ransom.

The beauty of this approach? OpenTelemetry works across 20+ languages with the same APIs. Your Python Flask app and Go microservice send traces the same way, which is less painful than learning different instrumentation for every service. One standard, infinite backends - that's the promise.

OpenTelemetry Reference Architecture

OpenTelemetry vs Your Other (Expensive) Options

Feature

OpenTelemetry

Datadog/New Relic

Prometheus + Jaeger

DIY Hell

Vendor Lock-in

Zero (the whole point)

Tighter than handcuffs

Minimal if you can handle ops

You own everything (and all the 3am pages)

Setup Complexity

Moderate (2-3 days of your life)

Easy (just add agent and credit card)

High (prepare for config hell)

Extreme (good luck)

Monthly Bill

Free + storage costs (~$500/month)

$15k-$50k+/month for real usage

Infrastructure costs (~$200-1k/month)

Engineer turnover costs

Learning Curve

Steep but worthwhile

Gentle (until you hit limits)

Very steep (3 different tools)

PhD in distributed systems

Production Reality

Works when Mercury isn't in retrograde

Just works (until you see the bill)

Works if you live in YAML hell

Engineer turnover rate: 100%

When Shit Breaks

GitHub issues and Stack Overflow

Support tickets (if you pay enough)

You're on your own

You debug everything while crying

Language Support

20+ languages (some better than others)

Good coverage

Per-language clients

Build your own

Escape Hatch

Switch backends without changing code

Rewrite all instrumentation

Manageable migration

Start over

How This Stuff Actually Works (And Where It All Goes to Hell)

OpenTelemetry has too many moving parts that need to work together without eating your entire CPU budget. When everything aligns, it's beautiful. When it doesn't, you'll spend Tuesday debugging why the collector is using 4GB RAM to process 100 spans.

The Moving Parts That Break

SDKs (What You Actually Touch)

Java: Actually works. The auto-instrumentation agent is solid - just add -javaagent:opentelemetry-javaagent.jar and pray. Breaks with custom classloaders and specific Spring Boot 3.2.x versions where they fucked up actuator endpoints.

Python: Reliable until it isn't. Auto-instrumentation conflicts with gevent in ways that make no sense. Manual instrumentation with Flask/Django is straightforward if you enjoy adding spans everywhere.

Node.js: Chaos incarnate. Auto-instrumentation works until you touch ESM modules, then everything breaks. The Express instrumentation is solid, everything else is Russian roulette.

Go: Manual instrumentation only because Go developers love doing everything the hard way. At least the API is clean and predictable.

The Collector (Your Data Processing Bottleneck)

The OpenTelemetry Collector is where your telemetry goes to get processed. Deploy it as a sidecar, gateway, or agent - each has different failure modes:

OpenTelemetry Collector Pipeline Architecture

Sidecar Mode: Each pod gets its own collector. Works great until it eats 200MB RAM per pod and your cluster bill doubles. Collector 0.89.0 has memory leak issues with tail sampling processor (GitHub issue #32551) - skip directly to 0.90.0+.

Setup Time Reality: "2-3 days" is optimistic bullshit. Plan for a week minimum, two weeks if you have custom requirements or legacy services that refuse to cooperate.

Gateway Mode: Central collectors that everyone sends to. Scales better but creates a single point of failure. Use load balancers or accept that Tuesday's outage will take down observability too.

Agent Mode: Runs on each node. Good middle ground until host networking breaks in some Kubernetes CNI configurations.

Semantic Conventions (The Naming Rules)

Semantic Conventions try to stop everyone from naming spans differently. As of September 2025:

  • HTTP spans: Stable and widely adopted (finally)
  • Database operations: Stabilized in 2025 with consistent attribute names
  • RPC calls: Working towards stability but not there yet (despite optimistic roadmaps)

Real talk: Half the ecosystem still uses old naming conventions, so expect http.method and http.request.method to coexist forever. Yes, it's as annoying as it sounds when you're writing queries.

Instrumentation Reality Check

Auto-Instrumentation (When It Works)

Auto-magic instrumentation sounds great until Spring Security breaks it, or your custom HTTP client isn't supported, or that one specific MongoDB driver version causes duplicate spans.

Copy this for Java: java -javaagent:opentelemetry-javaagent.jar -jar your-app.jar

For Python: opentelemetry-bootstrap && opentelemetry-instrument python app.py

Manual Instrumentation (The Reliable Way)

When auto-instrumentation fails, you instrument by hand. More work but you control exactly what gets traced:

from opentelemetry import trace

tracer = trace.get_tracer(__name__)

with tracer.start_as_current_span("custom_operation"):
    # Your business logic here
    pass

The Production Gotchas

Sampling Configuration: Start with 1% sampling (trace_id_ratio_based: 0.01) or your storage costs will bankrupt you. Head-based sampling means important errors might not be captured.

Memory Usage: Java agents use ~50MB overhead. Python auto-instrumentation adds ~30MB. Collector baseline is 200MB but grows with throughput. Monitor memory usage or pods will OOMKill randomly.

Network Failures: Configure retry policies because networks fail. Default timeouts are optimistic. Exponential backoff is your friend.

CNCF Landscape

Integration Ecosystem (90+ Ways to Spend Money)

OpenTelemetry sends data to 90+ backend vendors:

Prometheus Monitoring Architecture

  • Jaeger + Prometheus: Self-hosted, total control, operational burden. Expect storage tuning and capacity planning.
  • Grafana Cloud: Managed Prometheus/Jaeger/Loki. Reasonable pricing until you hit their data ingestion limits.
  • AWS X-Ray: Native AWS support but sampling rules are confusing as hell and costs add up with high-traffic applications.
  • Commercial APM: Most support OTLP ingestion now. Check if they charge extra for OpenTelemetry data vs their native agents.

The Questions You Actually Want to Ask

Q

Why does my collector keep dying?

A

Memory leaks. Always memory leaks. Collector 0.89.0 was particularly fucked

  • upgrade to 0.90.0+. If it's still dying, you probably forgot the memory_limiter processor and it's eating all available RAM until the OOMKiller saves your ass.Also check if you're processing 50k spans/second on 2 CPU cores like an idiot. Scale horizontally or optimize the pipeline.
Q

How do I debug missing spans when everything looks configured correctly?

A

It's probably sampling.

It's always fucking sampling. Check your sampling configuration

  • if you set trace_id_ratio_based: 0.001, you're only capturing 0.1% of traces.

That error you're looking for probably wasn't sampled.Jaeger Trace Detail ViewThe other 10%:

Network timeouts between your app and collector, collector → backend export failures, or context propagation broke somewhere in your service chain.Enable debug logging on the collector: service.telemetry.logs.level: debug.

Warning: This will generate a shitload of logs.

Q

What's the real performance impact?

A

"1-5% overhead" is marketing bullshit.

Real impact depends on your configuration:

  • Java agent with default settings: ~3-8% CPU overhead on our API that handles 10k req/sec
  • Python auto-instrumentation:

Added 23ms average latency to our Flask app (15ms baseline to 38ms)

  • Collector as sidecar: 200MB RAM baseline, 50-100MB additional per 1k spans/sec throughput

High-frequency operations (database calls, HTTP requests) create more overhead. We saw 15% performance hit instrumenting a tight loop that made 1000 Redis calls per request. Don't instrument everything like an idiot.

Q

Why is my observability bill still expensive if OpenTelemetry is "free"?

A

Open

Telemetry is free like a puppy is free.

The framework costs nothing, but storage and processing will destroy your budget:

  • Jaeger storage:

Our 50-service microservices architecture generates 2TB traces/month. That's $500/month in S3 + compute costs.

  • High-cardinality metrics: Adding user IDs to metrics labels created 2M unique time series.

Prometheus storage exploded to 500GB because we're dumbasses.

  • Commercial backends: Grafana Cloud charges by data ingestion. Our OpenTelemetry setup sends 10GB/day = $300/month. Still cheaper than Datadog's $3k/month.
Q

How do I fix "context deadline exceeded" errors?

A

Network timeouts between your app and the collector. Default OTLP exporter timeout is 10 seconds, which is optimistic as hell on a busy Kubernetes cluster.For Java: otel.exporter.otlp.timeout=30000For Python: OTEL_EXPORTER_OTLP_TIMEOUT=30000Also check if your collector is overwhelmed. If it's processing 50k spans/second on 2 CPU cores, it's going to drop data. Scale horizontally or optimize the pipeline.

Q

Does OpenTelemetry work with Spring Boot 3.x?

A

Mostly. The Java agent works with Spring Boot 3.0+ but has issues with Spring Security 6 and some WebFlux configurations.Spring Boot 3.2.0 specifically breaks with custom actuator endpoints. Upgrade to 3.2.1+ or use manual instrumentation for custom endpoints.

Q

Why is Node.js auto-instrumentation so flaky?

A

Because JavaScript is chaos and OpenTelemetry tries to impose order. ESM modules break auto-instrumentation, newer Node versions change internal APIs, and some libraries use monkey-patching that conflicts with OTel's monkey-patching.Stick to CommonJS if possible, or accept that you'll be manually instrumenting half your dependencies. The Express instrumentation is solid, but custom middleware can break trace context.

Q

How do I prevent high-cardinality metrics from exploding my storage?

A

Remove user IDs, request IDs, and timestamps from metric labels.

Use metric views to drop high-cardinality labels:```yaml# Collector configurationprocessors: filter/drop_user_ids: metrics: metric:

  • 'user.id'```Better: Design metrics for aggregation, not individual tracking. Track "requests per endpoint" not "requests per user per endpoint." Learn this before you bankrupt your startup.
Q

Why does it work perfectly on my machine but crash in production?

A

Because your machine has 32GB RAM and production pods have 512MB. Because your machine doesn't have 47 other services fighting for CPU. Because localhost networking is magic compared to Kubernetes CNI.Deployment Reality: This will fail 3 times before it works. Docker networking will break inexplicably, environment variables will be wrong, and the collector config will have one typo that takes 2 hours to find.Check your resource limits, sampling rates, and collector configuration. What works on a single-service development setup dies horribly in a real distributed environment.The Kubernetes Problem: Works perfectly in docker-compose, explodes in K8s because of course it does. CNI networking, resource limits, and service mesh sidecars will all conspire against your collector.

Q

How do I explain to management why observability costs more than the actual servers?

A

Show them the cost of downtime. That 3-hour outage last month because you couldn't debug a performance issue? That cost more than 2 years of observability tooling.Monitoring the Monitor: Your observability system will go down during the exact outage you need it most. Murphy's Law applies double to monitoring infrastructure.Or just lie and call it "infrastructure optimization" instead of "observability." Management loves that shit. Works every time.The Update Trap: Don't update collector versions on Friday. Or Monday. Or really any day ending in 'y'. Something will break and you'll spend the weekend rolling back.

Stuff That Actually Helps When You're Debugging at 3am

Related Tools & Recommendations

howto
Similar content

Set Up Microservices Observability: Prometheus & Grafana Guide

Stop flying blind - get real visibility into what's breaking your distributed services

Prometheus
/howto/setup-microservices-observability-prometheus-jaeger-grafana/complete-observability-setup
100%
tool
Similar content

Jaeger: Distributed Tracing for Microservices - Overview

Stop debugging distributed systems in the dark - Jaeger shows you exactly which service is wasting your time

Jaeger
/tool/jaeger/overview
79%
tool
Similar content

Grafana: Monitoring Dashboards, Observability & Ecosystem Overview

Explore Grafana's journey from monitoring dashboards to a full observability ecosystem. Learn about its features, LGTM stack, and how it empowers 20 million use

Grafana
/tool/grafana/overview
79%
integration
Similar content

Prometheus, Grafana, Alertmanager: Complete Monitoring Stack Setup

How to Connect Prometheus, Grafana, and Alertmanager Without Losing Your Sanity

Prometheus
/integration/prometheus-grafana-alertmanager/complete-monitoring-integration
76%
integration
Similar content

OpenTelemetry, Jaeger, Grafana, Kubernetes: Observability Stack

Stop flying blind in production microservices

OpenTelemetry
/integration/opentelemetry-jaeger-grafana-kubernetes/complete-observability-stack
75%
tool
Similar content

Datadog Production Troubleshooting Guide: Fix Agent & Cost Issues

Fix the problems that keep you up at 3am debugging why your $100k monitoring platform isn't monitoring anything

Datadog
/tool/datadog/production-troubleshooting-guide
74%
tool
Similar content

Prometheus Monitoring: Overview, Deployment & Troubleshooting Guide

Free monitoring that actually works (most of the time) and won't die when your network hiccups

Prometheus
/tool/prometheus/overview
70%
tool
Similar content

Datadog Setup & Config Guide: Production Monitoring in One Afternoon

Get your team monitoring production systems in one afternoon, not six months of YAML hell

Datadog
/tool/datadog/setup-and-configuration-guide
69%
tool
Similar content

Elastic Observability: Reliable Monitoring for Production Systems

The stack that doesn't shit the bed when you need it most

Elastic Observability
/tool/elastic-observability/overview
66%
tool
Similar content

New Relic Overview: App Monitoring, Setup & Cost Insights

New Relic tells you when your apps are broken, slow, or about to die. Not cheap, but beats getting woken up at 3am with no clue what's wrong.

New Relic
/tool/new-relic/overview
57%
tool
Similar content

Datadog Security Monitoring: Good or Hype? An Honest Review

Is Datadog Security Monitoring worth it? Get an honest review, real-world implementation tips, and insights into its effectiveness as a SIEM alternative. Avoid

Datadog
/tool/datadog/security-monitoring-guide
54%
tool
Similar content

Elastic APM Overview: Monitor & Troubleshoot Application Performance

Application performance monitoring that won't break your bank or your sanity (mostly)

Elastic APM
/tool/elastic-apm/overview
53%
tool
Similar content

Kibana - Because Raw Elasticsearch JSON Makes Your Eyes Bleed

Stop manually parsing Elasticsearch responses and build dashboards that actually help debug production issues.

Kibana
/tool/kibana/overview
41%
tool
Similar content

Alertmanager - Stop Getting 500 Alerts When One Server Dies

Learn how Alertmanager processes alerts from Prometheus, its advanced features, and solutions for common issues like duplicate alerts. Get an overview of its pr

Alertmanager
/tool/alertmanager/overview
41%
tool
Similar content

Datadog Monitoring: Features, Cost & Why It Works for Teams

Finally, one dashboard instead of juggling 5 different monitoring tools when everything's on fire

Datadog
/tool/datadog/overview
39%
tool
Similar content

Open Policy Agent (OPA): Centralize Authorization & Policy Management

Stop hardcoding "if user.role == admin" across 47 microservices - ask OPA instead

/tool/open-policy-agent/overview
32%
integration
Similar content

Kafka, MongoDB, K8s, Prometheus: Event-Driven Observability

When your event-driven services die and you're staring at green dashboards while everything burns, you need real observability - not the vendor promises that go

Apache Kafka
/integration/kafka-mongodb-kubernetes-prometheus-event-driven/complete-observability-architecture
26%
tool
Similar content

ArgoCD Production Troubleshooting: Debugging & Fixing Deployments

The real-world guide to debugging ArgoCD when your deployments are on fire and your pager won't stop buzzing

Argo CD
/tool/argocd/production-troubleshooting
26%
tool
Similar content

Datadog Enterprise Deployment Guide: Control Costs & Sanity

Real deployment strategies from engineers who've survived $100k+ monthly Datadog bills

Datadog
/tool/datadog/enterprise-deployment-guide
25%
tool
Similar content

Datadog Cost Management Guide: Optimize & Reduce Your Monitoring Bill

Master Datadog costs with our guide. Understand pricing, billing, and implement proven strategies to optimize spending, prevent bill spikes, and manage your mon

Datadog
/tool/datadog/cost-management-guide
24%

Recommendations combine user behavior, content similarity, research intelligence, and SEO optimization