Why Microservices Observability Is A Nightmare

Microservices turned debugging into archaeology. One request touches 15 services, fails in the 12th one, and good luck figuring out why. Traditional monitoring tools shit the bed with this complexity.

Microservices Complexity Diagram

I've spent years building observability stacks that work in production. Here's what I learned: you need OpenTelemetry for instrumentation (because vendor SDKs are trash), Jaeger for tracing (because following requests across services manually is hell), and Grafana for visualization (because readable dashboards matter).

What This Stack Actually Does

OpenTelemetry collects traces, metrics, and logs from your apps without tying you to any vendor. It's the CNCF's way of saying "fuck proprietary instrumentation." Version 1.0 dropped in 2021 and it's been solid since.

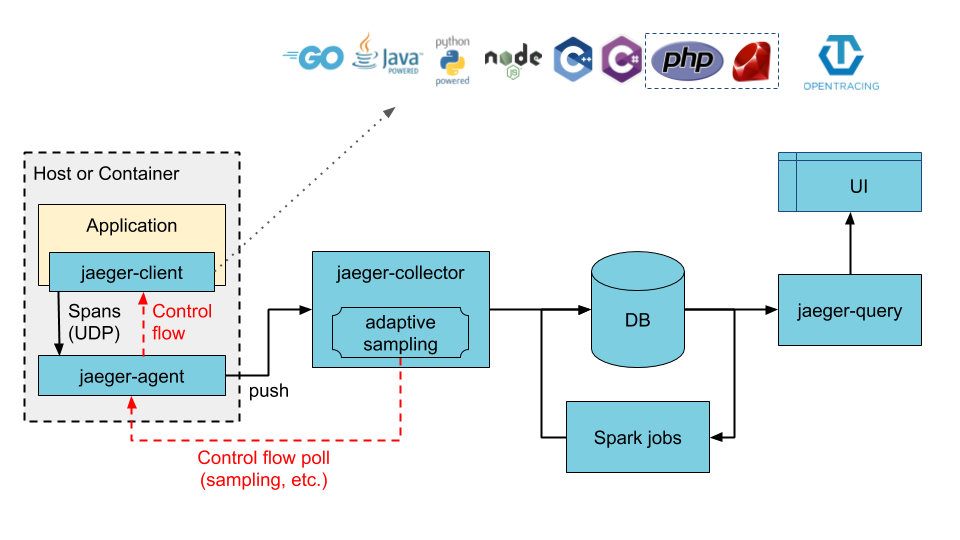
Jaeger stores and searches your traces. V2 just came out (November 2024) and it's built on OpenTelemetry Collector, which means native OTLP support and way less configuration hell. V2 supports ClickHouse, Elasticsearch, and Cassandra as storage backends, with gRPC and HTTP ingestion endpoints that actually work under load.

Grafana turns your data into dashboards people can actually read. Grafana's had trace-to-metrics since 9.1, but 11.0 improved the TraceQL integration, which is crucial when you're debugging cascading failures.

Kubernetes runs it all and provides service discovery that actually works (most of the time).

Why This Integration Doesn't Suck

Unlike most monitoring stacks that make you choose between vendor lock-in or configuration hell, this combination actually works:

OpenTelemetry standardizes everything - traces, metrics, logs all use the same format. No more vendor-specific data formats or proprietary SDKs that break every update.

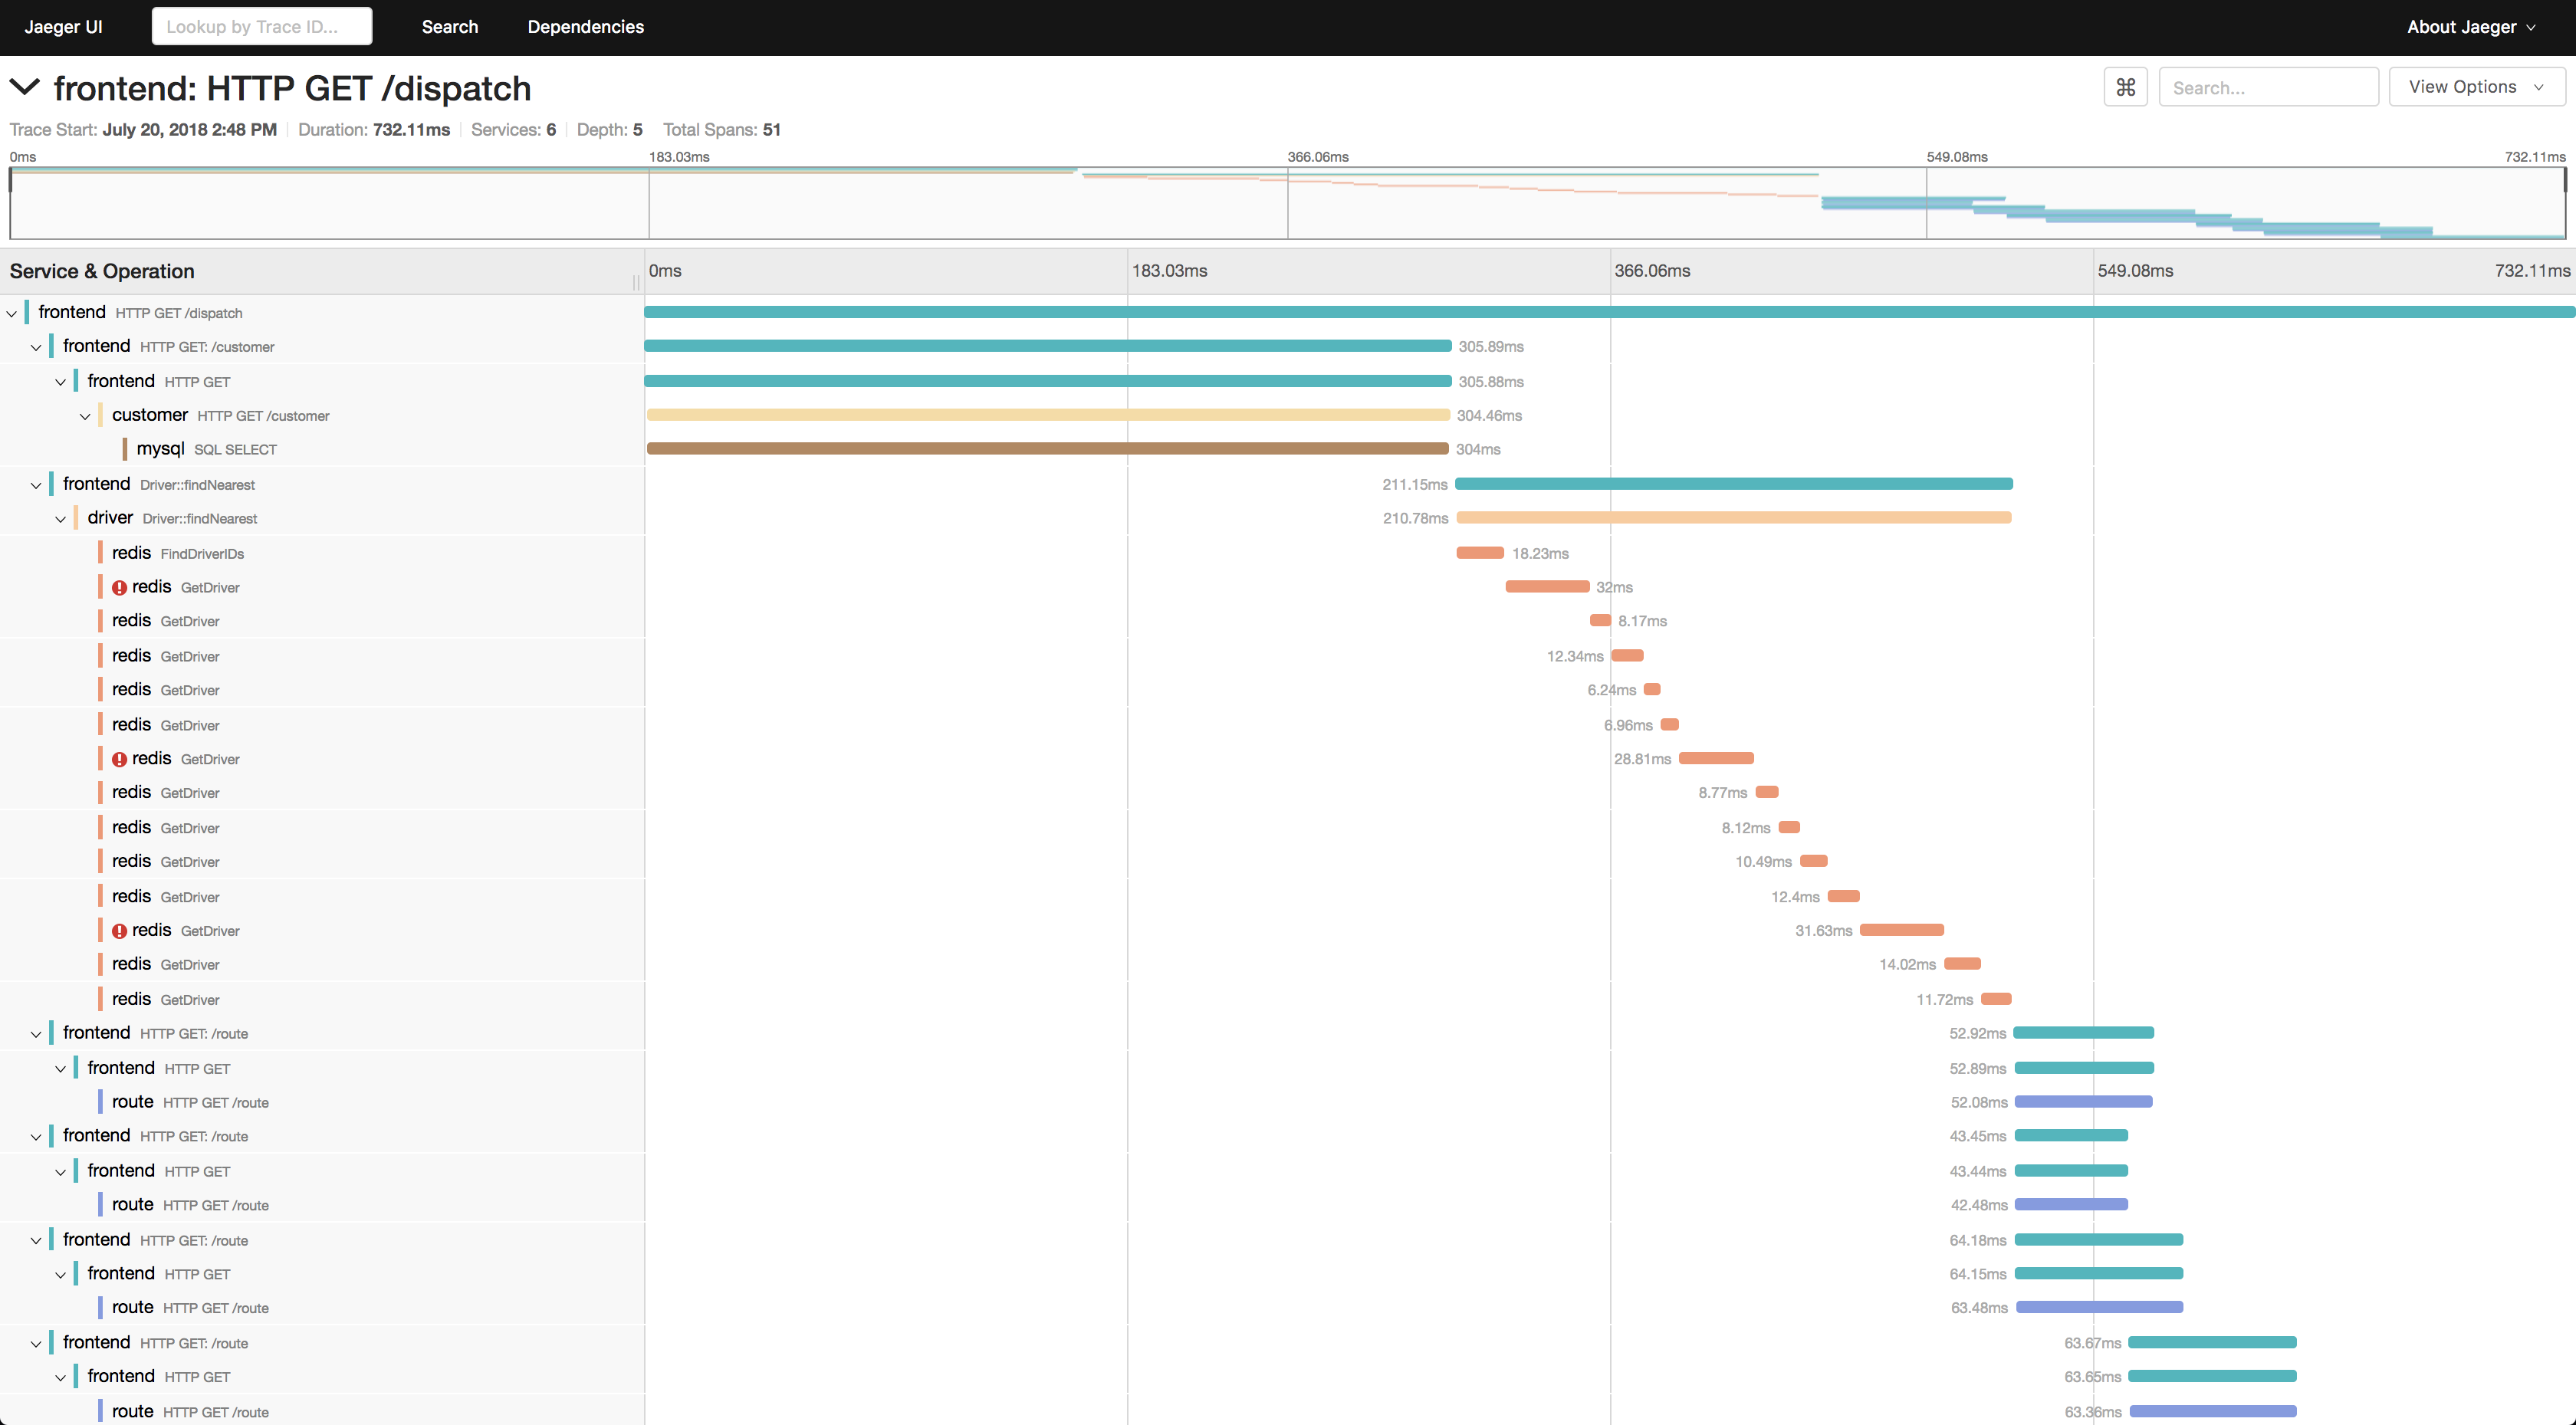
Request tracing that actually works - W3C trace context flows through your entire stack. A request failing in service 12 gets tracked back to the originating API call, with timing for every hop.

Distributed Tracing Flow

Zero-code Kubernetes integration - The OpenTelemetry Operator injects sidecar collectors automatically. Your pods get instrumented without touching application code.

Netflix-scale for free - They process 2+ trillion spans daily using this architecture. That's enterprise scale without the enterprise price tag that makes your CFO cry.

Kubernetes Architecture

Grafana Logo

The best part? It's all open source. No surprise licensing fees, no vendor account managers calling you every week, no \"contact sales for pricing\" bullshit.

Deployment Reality - What Actually Works

Now that you understand why this stack makes sense, let's talk about actually deploying it. This is where good intentions meet production reality. Here's how to do it without losing your sanity.

Component Architecture That Won't Break

OpenTelemetry Collector runs two ways: agents on every node (DaemonSets) and central gateways (Deployments). Agents forward app data, gateways do the heavy lifting. Resource requirements: agents usually eat around 150MB, sometimes 300MB if you're unlucky, gateways can be anywhere from 500MB to "holy shit it's using 4GB again" (the docs say 50MB, they're wrong).

OpenTelemetry Collector Architecture

Jaeger v2 simplified everything by building on OpenTelemetry Collector. One binary, native OTLP, and storage backends that don't crash under load. Use ClickHouse for storage unless you enjoy paying Elasticsearch licensing fees.

Grafana needs maybe 250MB RAM for basic setups, maybe 2GB if you have data sources that timeout constantly. The unified alerting actually works now, unlike the old system that failed silently.

Kubernetes Integration Horror Stories

Operators vs. Helm vs. Manual Deployment:

  • Operators: Work great until you need custom configs, then you're editing CRDs
  • Helm: Fast setup but customization is YAML hell
  • Manual: Takes forever but you understand what breaks

Kubernetes Deployment Options

Jaeger Architecture Diagram

Resource Requirements (Real Numbers):

  • OpenTelemetry Collector agents: usually around 150MB, sometimes spikes to 400MB when processing gets weird
  • Gateway collectors: anywhere from 1GB to "why is this using 8GB" depending on traffic spikes
  • Jaeger: 500MB minimum, but I've seen it balloon to 3GB (storage backend dependent)
  • Grafana: starts at 400MB, grows to 1.5GB+ if your dashboards are complex

Security That Doesn't Break Everything:

What Actually Breaks During Deployment

Everything. The Helm charts assume default configs work (they don't). Resource limits kill collectors silently. Service mesh configs conflict with OpenTelemetry configs. Storage backends timeout under load.

I've deployed this 12 times and here's what actually breaks: Version 1.2.3 of the operator broke our entire deployment because of a memory leak in the webhook, spent 6 hours debugging why collectors were dying - turned out to be memory limits set too low.

Plan for however long it takes - maybe a few hours if nothing breaks, maybe a week if everything does. And when collectors die, they die silently and your traces disappear. Monitor collector health religiously.

Integration Approaches Comparison

Integration Method

Complexity

Performance Impact

Vendor Lock-in

Enterprise Readiness

Use Case

OpenTelemetry + Jaeger + Grafana

Took us 3 weeks but we're slow (Moderate)

Low (2-5% overhead)

None

High

Complete observability stack

Proprietary APM Solutions

Low (but $$$)

Medium (5-15% overhead)

High (good luck leaving)

High

When budget > time

ELK Stack + APM

High (YAML nightmare)

Medium (3-10% overhead)

Medium

Medium

If you love Elasticsearch pain

Prometheus + Custom Tracing

High (DIY everything)

Low (1-3% overhead)

Low

Medium

Metrics-first masochists

Cloud Provider Solutions

Low (until you customize)

Variable (black box)

High (vendor hugs)

High

Cloud-native convenience

FAQ - The Shit Nobody Tells You

Q

What's the real performance overhead?

A

Open

Telemetry adds 2-5% CPU overhead in normal cases. Configure it wrong and it's 50%. I've seen poorly configured collectors eat entire CPU cores. Memory overhead is usually 50-200MB per collector, but with memory leaks you're looking at gigabytes.The overhead scales with trace volume

  • 100% sampling works for toy apps, kills production. Use 1-10% sampling for high-traffic services or your collectors will die. For context, we process 10M+ spans/day with 5% sampling and it runs on 2 CPU cores, 4GB RAM per gateway collector.
Q

Does Jaeger v2 actually fix anything?

A

Yes, but it's not magic. V2 (November 2024) rebuilt everything on OpenTelemetry Collector, which means native OTLP and less configuration hell. Migration from v1 is mostly config changes, but you get better performance and fewer moving parts.

Q

Does this work with service mesh?

A

Istio + OpenTelemetry works but the configuration is a pain in the ass. You get automatic network-level tracing, which is great, but troubleshooting requires understanding both Istio and OpenTelemetry configs. When it works, it's magic. When it breaks, you're fucked.

Q

What's the recommended approach for handling high-cardinality metrics?

A

OpenTelemetry provides metric cardinality limits and sampling strategies. Use metric aggregation at collection time, implement attribute filtering, and leverage exemplars to link high-cardinality events to specific traces.

Q

How much does storage actually cost?

A

Traces are expensive to store. Detailed traces for 7 days, aggregated metrics for 6 months, trends forever. Budget $500-5000/month for storage depending on scale. ClickHouse is cheapest, Elasticsearch is most expensive, object storage is slowest but unlimited.

Q

What security considerations are important for production deployment?

A

Enable mutual TLS for OTLP communications, implement RBAC for Grafana access, and use Kubernetes network policies to restrict component communication. Consider data sanitization processors to remove sensitive information from telemetry data.

Q

How do you monitor the monitoring?

A

You instrument the observability stack itself or you're flying blind. OpenTelemetry Collector metrics, Jaeger health checks, Grafana operational dashboards. Set alerts for pipeline health because you won't notice until everything's broken.When collectors die, they die silently and your traces disappear. Monitor collector health religiously.

Q

What's the migration path from proprietary APM solutions?

A

Start with dual deployment

  • run OpenTelemetry alongside existing solutions.

Use OpenTelemetry's automatic instrumentation to minimize code changes. Gradually migrate dashboards and alerts to Grafana while maintaining existing tooling until full confidence is achieved.

Q

How do you handle multi-cluster or multi-cloud deployments?

A

Deploy OpenTelemetry Collector gateways as aggregation points for each cluster. Use remote write for metrics federation and centralized Jaeger deployment with multi-tenant configuration. Configure cross-cluster service discovery for complete request tracing.

Q

What are the resource requirements for production deployment?

A

For medium-scale deployments (1000+ pods): OpenTelemetry Collectors require 2-4 CPU cores and 4-8GB RAM for gateway mode, Jaeger components need 1-2 CPU cores and 2-4GB RAM, and Grafana requires 0.5-1 CPU core and 1-2GB RAM. Storage requirements depend on retention policies but typically start at 100GB for trace storage.

Q

How do you implement custom business metrics alongside infrastructure metrics?

A

Use OpenTelemetry's custom metrics API to create business-specific instruments. Implement semantic conventions for consistent attribute naming. Create Grafana dashboards that combine business metrics with infrastructure data for comprehensive observability.

Q

What's the recommended sampling strategy for high-traffic applications?

A

Implement probabilistic head-based sampling (1-10%) for normal traffic and tail-based sampling to always retain error traces and slow requests. Use adaptive sampling to maintain consistent trace volume while capturing important events.

Q

What breaks during deployment?

A

Everything. The Helm charts assume default configs work (they don't). Resource limits kill collectors silently. Service mesh configs conflict with OpenTelemetry configs. Storage backends timeout under load. Plan for 2-3x longer than the optimistic timeline.Specific failures I've seen: trace volume killed Elasticsearch in production, OpenTelemetry auto-instrumentation broke authentication headers, and Grafana ate 32GB RAM rendering one dashboard.

Q

How do you troubleshoot when shit breaks?

A

Check collector logs first (they're usually the problem). Verify OTLP endpoints are actually reachable. Enable debug logging but turn it off fast or you'll fill your disk.The dumb thing to check first: are your collectors actually running? Resource limits kill them silently and you won't notice until traces disappear.

Resources That Don't Suck

Related Tools & Recommendations

howto
Similar content

Set Up Microservices Observability: Prometheus & Grafana Guide

Stop flying blind - get real visibility into what's breaking your distributed services

Prometheus
/howto/setup-microservices-observability-prometheus-jaeger-grafana/complete-observability-setup
100%
integration
Similar content

Prometheus, Grafana, Alertmanager: Complete Monitoring Stack Setup

How to Connect Prometheus, Grafana, and Alertmanager Without Losing Your Sanity

Prometheus
/integration/prometheus-grafana-alertmanager/complete-monitoring-integration
79%
tool
Similar content

Prometheus Monitoring: Overview, Deployment & Troubleshooting Guide

Free monitoring that actually works (most of the time) and won't die when your network hiccups

Prometheus
/tool/prometheus/overview
49%
tool
Similar content

Grafana: Monitoring Dashboards, Observability & Ecosystem Overview

Explore Grafana's journey from monitoring dashboards to a full observability ecosystem. Learn about its features, LGTM stack, and how it empowers 20 million use

Grafana
/tool/grafana/overview
45%
tool
Similar content

Jaeger: Distributed Tracing for Microservices - Overview

Stop debugging distributed systems in the dark - Jaeger shows you exactly which service is wasting your time

Jaeger
/tool/jaeger/overview
34%
tool
Similar content

Datadog Setup & Config Guide: Production Monitoring in One Afternoon

Get your team monitoring production systems in one afternoon, not six months of YAML hell

Datadog
/tool/datadog/setup-and-configuration-guide
31%
tool
Similar content

New Relic Overview: App Monitoring, Setup & Cost Insights

New Relic tells you when your apps are broken, slow, or about to die. Not cheap, but beats getting woken up at 3am with no clue what's wrong.

New Relic
/tool/new-relic/overview
31%
tool
Similar content

Datadog Production Troubleshooting Guide: Fix Agent & Cost Issues

Fix the problems that keep you up at 3am debugging why your $100k monitoring platform isn't monitoring anything

Datadog
/tool/datadog/production-troubleshooting-guide
30%
integration
Recommended

ELK Stack for Microservices - Stop Losing Log Data

How to Actually Monitor Distributed Systems Without Going Insane

Elasticsearch
/integration/elasticsearch-logstash-kibana/microservices-logging-architecture
29%
tool
Similar content

OpenTelemetry Overview: Observability Without Vendor Lock-in

Because debugging production issues with console.log and prayer isn't sustainable

OpenTelemetry
/tool/opentelemetry/overview
29%
compare
Recommended

PostgreSQL vs MySQL vs MongoDB vs Cassandra - Which Database Will Ruin Your Weekend Less?

Skip the bullshit. Here's what breaks in production.

PostgreSQL
/compare/postgresql/mysql/mongodb/cassandra/comprehensive-database-comparison
28%
tool
Similar content

Elastic APM Overview: Monitor & Troubleshoot Application Performance

Application performance monitoring that won't break your bank or your sanity (mostly)

Elastic APM
/tool/elastic-apm/overview
25%
tool
Recommended

Google Kubernetes Engine (GKE) - Google's Managed Kubernetes (That Actually Works Most of the Time)

Google runs your Kubernetes clusters so you don't wake up to etcd corruption at 3am. Costs way more than DIY but beats losing your weekend to cluster disasters.

Google Kubernetes Engine (GKE)
/tool/google-kubernetes-engine/overview
23%
review
Recommended

Kubernetes Enterprise Review - Is It Worth The Investment in 2025?

integrates with Kubernetes

Kubernetes
/review/kubernetes/enterprise-value-assessment
23%
troubleshoot
Recommended

Fix Kubernetes Pod CrashLoopBackOff - Complete Troubleshooting Guide

integrates with Kubernetes

Kubernetes
/troubleshoot/kubernetes-pod-crashloopbackoff/crashloop-diagnosis-solutions
23%
tool
Similar content

Kibana - Because Raw Elasticsearch JSON Makes Your Eyes Bleed

Stop manually parsing Elasticsearch responses and build dashboards that actually help debug production issues.

Kibana
/tool/kibana/overview
23%
troubleshoot
Recommended

Fix Docker Daemon Connection Failures

When Docker decides to fuck you over at 2 AM

Docker Engine
/troubleshoot/docker-error-during-connect-daemon-not-running/daemon-connection-failures
23%
troubleshoot
Recommended

Docker Container Won't Start? Here's How to Actually Fix It

Real solutions for when Docker decides to ruin your day (again)

Docker
/troubleshoot/docker-container-wont-start-error/container-startup-failures
23%
troubleshoot
Recommended

Docker Permission Denied on Windows? Here's How to Fix It

Docker on Windows breaks at 3am. Every damn time.

Docker Desktop
/troubleshoot/docker-permission-denied-windows/permission-denied-fixes
23%
tool
Similar content

Helm: Simplify Kubernetes Deployments & Avoid YAML Chaos

Package manager for Kubernetes that saves you from copy-pasting deployment configs like a savage. Helm charts beat maintaining separate YAML files for every dam

Helm
/tool/helm/overview
22%

Recommendations combine user behavior, content similarity, research intelligence, and SEO optimization