Introduction

Kibana exists because parsing Elasticsearch JSON by hand will drive you fucking insane. You know those curl responses with like 800+ lines of nested JSON that make your eyes bleed? Yeah, Kibana turns that nightmare into a chart that actually shows you what's broken.
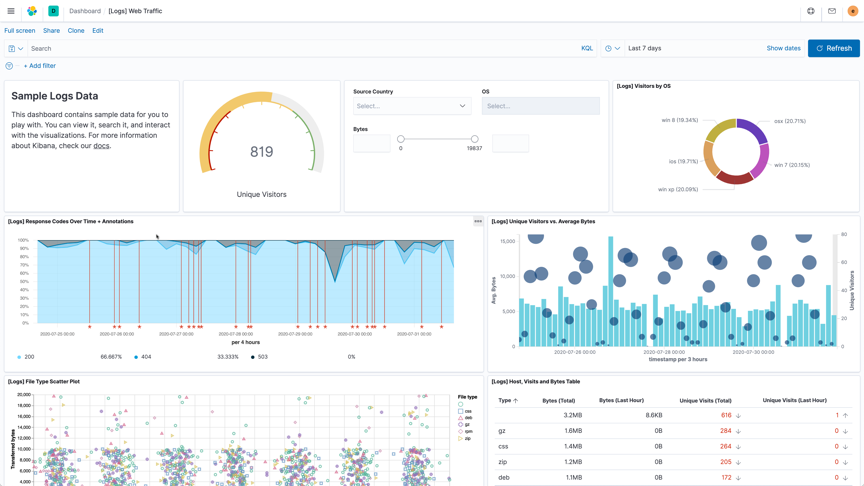
The Problem Kibana Solves
Elasticsearch finds your data fast, but good luck making sense of the JSON responses it spits out. Before Kibana, analyzing logs meant becoming a curl wizard or building dashboards that looked like they were designed in 1999. I spent hours writing Query DSL that looked like someone's fever dream.
Kibana fixes this with drag-and-drop tools that don't hate you. Unlike Tableau where creating a pie chart requires a PhD and three weeks of training, Kibana's interface actually makes sense. You drag fields around, pick chart types, and suddenly you have something useful showing what's broken in production.
What Makes It Different From Other Tools
What makes it fast is the direct Elasticsearch integration. You can search through billions of log entries in seconds, not minutes. Try that with SQL Server Reporting Services and you'll be waiting longer than a Windows 95 boot sequence.
ES|QL: The Query Language That Doesn't Suck
The new ES|QL (Elasticsearch Query Language) is actually readable, unlike the JSON query DSL that looks like it was designed by someone who hates developers. You write queries that look like SQL but work with Elasticsearch's speed. Finally, a query language that doesn't make you want to quit programming.
Fair warning though: ES|QL is still evolving, so don't bet your entire monitoring strategy on advanced features yet. I learned this the hard way when ES|QL's GROUP BY broke on us in version 8.9 after working fine in 8.8. Check the ES|QL limitations and stick to the basics until they work out the kinks.
Real-World Usage (The Good and Bad)
Netflix burns through Kibana clusters like kindling, but they have 40+ engineers dedicated to keeping the ELK stack from imploding. Uber has customized Kibana so heavily it's basically a different product at this point.
For us mere mortals, Kibana works great for:
- Log analysis: When your application is throwing errors and you need to figure out why
- Infrastructure monitoring: Watching your servers slowly die under load
- Security monitoring: Catching the script kiddies before they cause real damage
- Business metrics: Proving to management that your system actually works most of the time
The Technical Reality
Kibana is a Node.js application that talks to Elasticsearch via REST APIs. This means if you hate JavaScript memory leaks, you're going to have a bad time. Expect to restart Kibana occasionally when it decides to eat all your RAM.
The 3am debugging reality: When Kibana starts throwing ECONNRESET errors connecting to Elasticsearch, 90% of the time it's because your Elasticsearch cluster is overloaded, not because Kibana is broken. I spent 3 hours last month restarting Kibana services before remembering to check cluster health with GET /_cluster/health. Don't be me - check cluster status first.
The good news is it scales horizontally if you know what you're doing. The bad news is most people don't configure it properly and wonder why their dashboards are slow.
Switch to dark mode or you'll go blind debugging at 2am. Trust me on this one. Also, the plugin architecture is surprisingly well-designed if you need custom functionality.
One more thing: integration with Beats and Logstash is smooth when it works, but debugging data pipeline issues will test your patience. Make sure your data parsing is bulletproof before it hits Elasticsearch.
Ready to get started? The official installation guide covers the basics, but for real production setups, you'll want the Docker setup. When things break (and they will), the community forum and GitHub repo have the real solutions.