I've been running Prometheus in production for 4 years. Here's what the docs won't tell you and why you'll want to throw your laptop out the window.
![]()
Prometheus is a monitoring system that scrapes HTTP endpoints for metrics every 15 seconds by default. SoundCloud built it in 2012 because existing tools sucked, and it became the second CNCF project after Kubernetes.
The pull model actually works. Instead of agents pushing metrics everywhere, Prometheus visits your /metrics endpoints and grabs everything. This means when your network is fucked, you don't lose historical data sitting in some agent's buffer.
What You Actually Get
Prometheus Server - This is the thing that eats your memory. It scrapes metrics, stores them in local TSDB files, and runs alerts. No clustering bullshit, no distributed complexity. One server, one problem to debug.
Service Discovery - Automatically finds things to monitor in Kubernetes, AWS, or whatever. Works great until you fat-finger a selector and suddenly you're scraping 10,000 pods instead of 10.
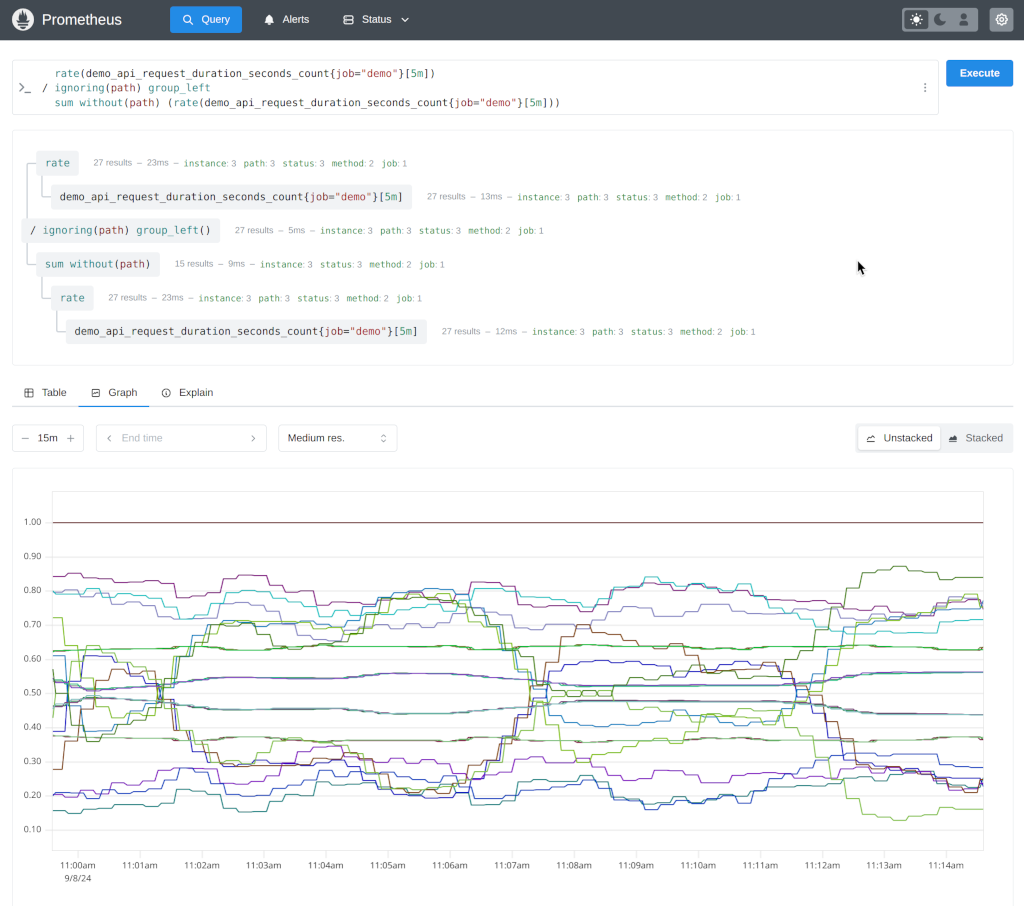
PromQL Query Language - Like SQL but designed by someone who actually uses time series data. Learning curve is steep but once you get it, you can query anything:
## Your app's error rate (actually useful)
rate(http_requests_total{status=~"5.."}[5m]) / rate(http_requests_total[5m])

## Memory usage that triggers alerts you care about
container_memory_working_set_bytes / container_spec_memory_limit_bytes > 0.8
Alertmanager - Handles alert routing and deduplication. The config syntax will make you want to quit programming, but it works once you figure it out.

The Memory Problem Everyone Hits
Here's the bullshit the docs skip: Prometheus uses roughly 3KB per time series in memory. Sounds innocent until you realize that http_requests_total{method="GET", handler="/", status="200"} and http_requests_total{method="POST", handler="/", status="200"} are completely different series. And that 3KB? Total fucking lie in production.

I learned this the hard way when our Prometheus went from 2GB to 16GB overnight. Some genius added a user_id label to request metrics. With 50,000 users, that single fucking metric became 50,000 series. The cardinality explosion killed our monitoring right when our payment system started failing. Spent 3 hours debugging payments while our monitoring was dead. Good times.
Reality check: 1 million series = anywhere from 3GB to 20GB RAM depending on how fucked your labels are. Hit 10 million series? Your server dies a slow, painful death swapping to disk. That's when you throw in the towel and migrate to VictoriaMetrics like you should have done months ago.
What's New in Version 3.0+ (And the 2025 Updates)
Prometheus 3.0 finally dropped in November 2024 after 7 years. The big changes:
- New UI - Thank fuck, the old one looked like it was designed in 2005
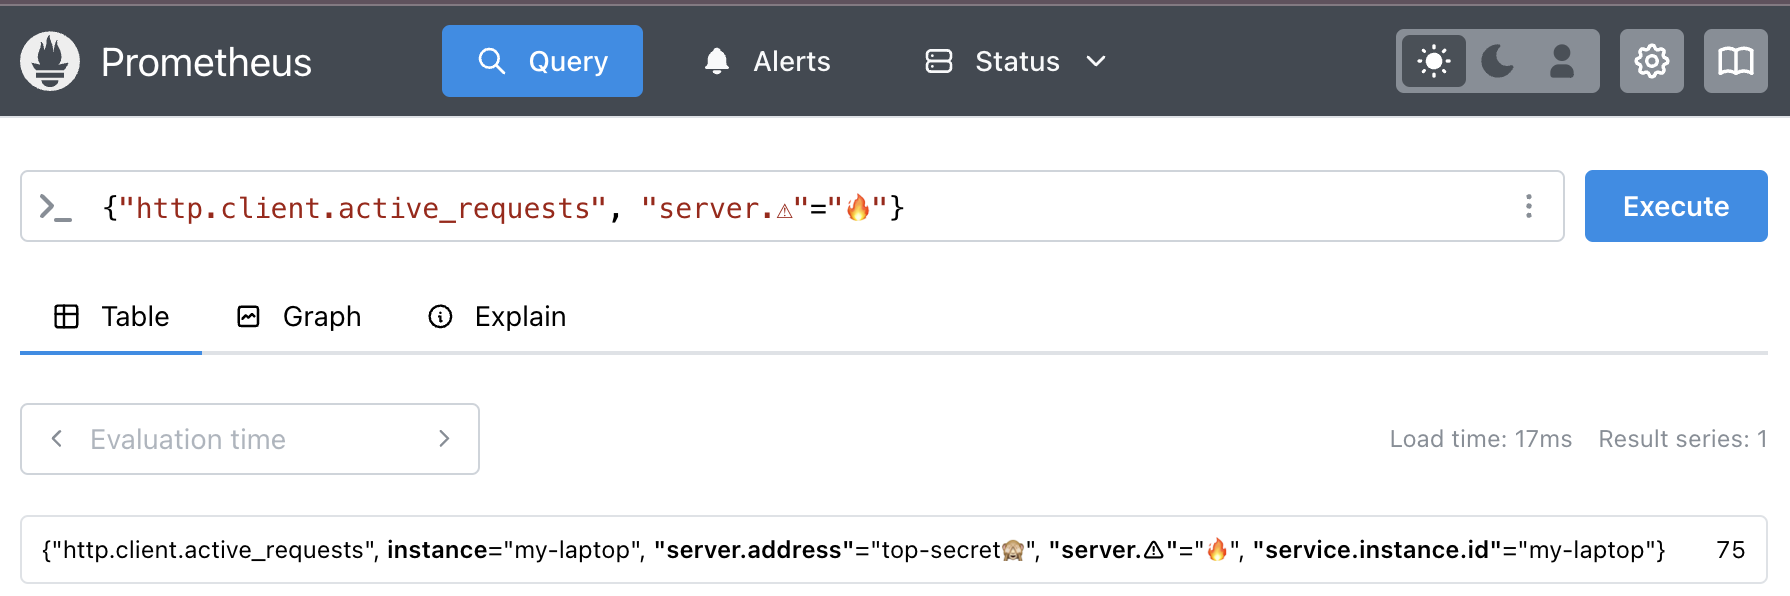
- UTF-8 support - You can finally use Unicode in metric names (why this took 12 years, I don't know)
- Better OpenTelemetry - Native OTLP support at
/api/v1/otlp/v1/metrics - Remote Write 2.0 - Better compression, metadata support, handles partial writes properly
- Native Histograms - More efficient than classic histograms, but still experimental
The upgrade from 2.x is "mostly painless" according to the docs. Reality: we broke 3 recording rules and our main SLI dashboard during the 3.0 upgrade. Test EVERYTHING first. Native histograms are still experimental in 3.0, so expect some changes as they mature.


 Debug checklist: