Your traditional APM tools are completely useless when it comes to event-driven architectures. When a user clicks "submit order" and that triggers a dozen microservices through Kafka topics, and one of them dies 30 seconds later, good luck figuring out which one shit the bed.
I learned this lesson after we spent about 4 hours debugging an order processing failure on a Tuesday night, only to discover that the payment service was dying because MongoDB connection pooling was set to some ridiculously low default - I think it was like 10 connections or something. The user got charged, but their order vanished. Try explaining that disaster to the business team in the morning.
The Real Problems Nobody Talks About
Async Hell: When everything is asynchronous, debugging becomes pure guesswork. Your logs are scattered across services with different timestamps - some in UTC, some in EST because someone forgot to fix that one service - and maybe correlation IDs if you're lucky. I watched a team waste 3 days trying to trace a single failed event through their system because nobody bothered implementing distributed tracing properly.
Kafka's "At Least Once" Bullshit: Kafka's "at least once" delivery is code for "we'll duplicate your shit and you deal with it." We had customers getting charged twice for the same order because duplicate payment events went through and our monitoring was too stupid to catch it. Only found out when customer support started getting death threats via email.
State Synchronization Nightmare: Each service has its own MongoDB database, and keeping track of global state across services is like herding cats. When the user service thinks an account is active but the billing service thinks it's suspended, who's right? Your monitoring better have an answer. This is where event sourcing patterns and CQRS can help, but they introduce their own complexity.
The Late-Night Debugging Reality: Picture this - your phone buzzes because users can't buy anything. You stumble to your laptop, log into your Kubernetes dashboard, see that all the pods are green, check Prometheus and see normal CPU/memory usage. Everything looks fine, but orders are still failing and people are starting to ask questions. This is exactly why you need actual event-driven observability, not just pretty green circles in Grafana.
Distributed Debugging Challenge: Unlike monoliths where you can step through code, event-driven systems make you trace events across multiple services, databases, and message queues to figure out what the hell happened. Tools like Jaeger and Zipkin help with this, but you need to instrument everything properly or they're useless.
Why This Stack Actually Works (When Configured Right)

After breaking production way too many times, I finally figured out that Kafka + MongoDB + Kubernetes + Prometheus actually gives you the visibility you need to keep your job. But every vendor conveniently forgets to mention all the gotchas that will screw you.
Kafka Event Tracing: Kafka 2.8+ includes trace headers that let you track events across the entire system. But here's the part that will make you want to quit - you have to manually propagate correlation IDs through every single service in your event chain. Miss ONE fucking service and your beautiful tracing becomes useless. OpenTracing or OpenTelemetry can automate this, but plan on spending a week debugging why service #17 isn't passing headers correctly. The W3C Trace Context specification helps standardize this across different tools.
MongoDB Change Streams for State Tracking: MongoDB Change Streams can publish database changes as events, which is brilliant for keeping track of state changes. But here's where MongoDB will bite you in the ass - change streams will absolutely flood your Kafka cluster if you don't filter them properly. We accidentally pushed... fuck, I think it was like 70-something GB of change events per day? Maybe 80GB? Could have been more - I stopped looking at the disk usage graph after our storage costs hit $400 that week and the ops team started asking uncomfortable questions.
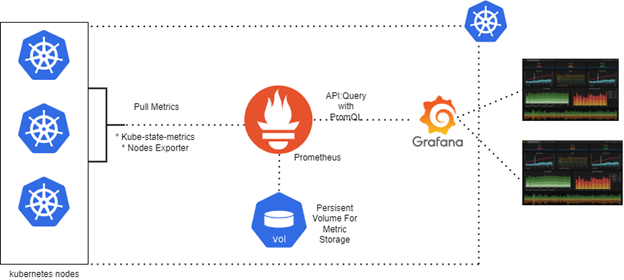
Prometheus for Everything Else: Prometheus excels at collecting metrics from all these components. The JMX exporter gives you Kafka broker metrics, MongoDB exporter handles database metrics, and kube-state-metrics covers Kubernetes. But Prometheus will eat your entire disk if you're not careful with retention - some asshole on our team added user IDs as metric labels and murdered our entire monitoring stack. I think it was consuming like 180GB? Maybe 220GB? The disk filled up so fast I couldn't even check the exact number before everything crashed. That was a fun 2am conversation with the infrastructure team.
Kubernetes Service Discovery: Kubernetes service discovery automatically configures Prometheus to scrape new services. This works great until you have 200 microservices and Prometheus starts choking on all the scraping. Prometheus recording rules become mandatory or your dashboards will timeout and make you look like an idiot in front of the whole team.
The Cost Reality Check
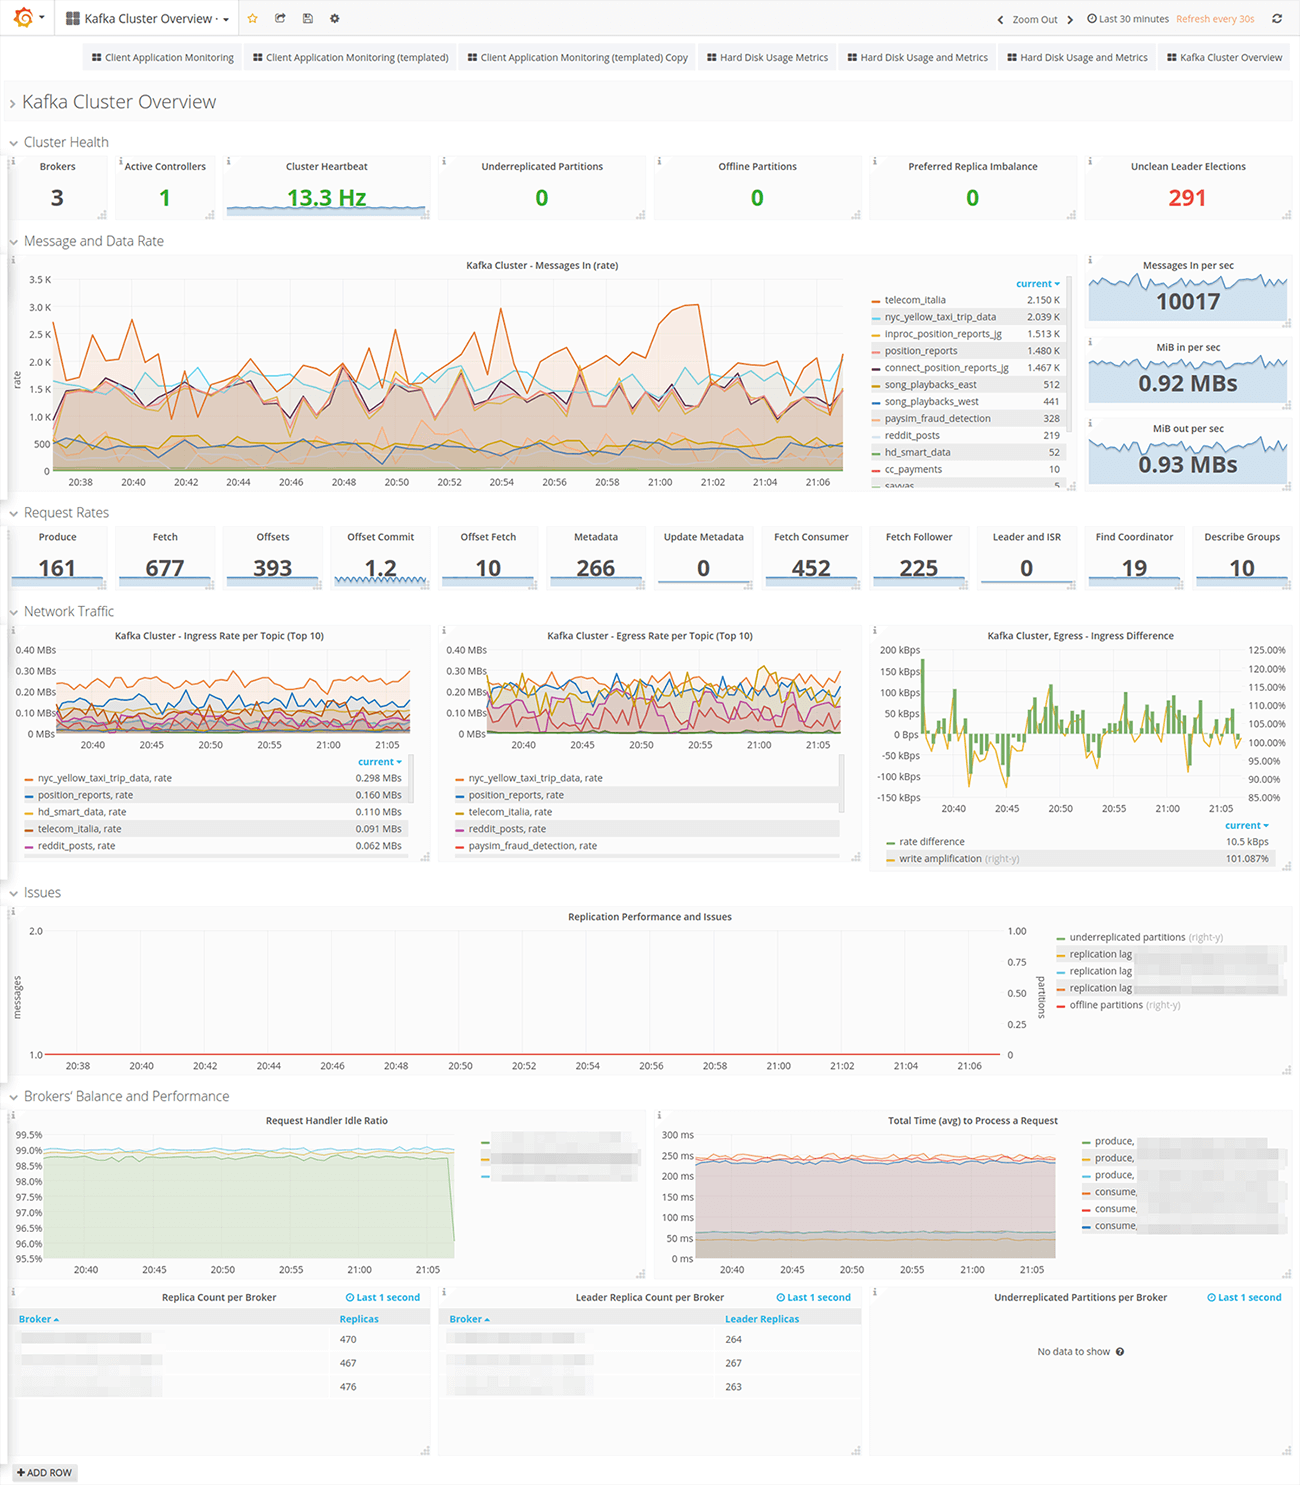
Production Monitoring Reality: A typical Kafka monitoring dashboard shows broker health, consumer lag, throughput rates, and error counts across dozens of topics and consumer groups - essential visibility that standard APM tools miss completely.
Before you get a hard-on for this stack, let me crush your dreams with the actual cost:
- Kafka: Expect $500-1500/month for a production 3-broker cluster on AWS, depending on throughput
- MongoDB: 3-node replica set with 32GB RAM each = $800-2000/month
- Prometheus: 16GB RAM minimum for serious workloads, 32GB if you want decent retention
- Kubernetes: Add 30-50% overhead for pod scheduling, networking, and monitoring
Total monthly cost for a medium-scale deployment: somewhere between $2000-5000/month, though our last AWS bill was closer to $6200 because of some egress charges we didn't see coming. Your manager will shit themselves when they see this bill and start asking what the hell you're spending money on.
Version Compatibility Hell
Here's what actually works together as of 2025-09-04:
- Kafka 3.5.x: Stable, avoid 3.6.0 - consumer group stability issues will crash your brokers under load
- MongoDB 7.0.x: Works well, but the Percona MongoDB exporter 0.40.0 breaks with auth enabled - use 0.39.0
- Kubernetes 1.28+: Required for recent Prometheus operator features
- Prometheus 2.47+: Needed for native histogram support
Don't mix and match randomly - these specific versions have been battle-tested in production environments.
What Nobody Tells You About Implementation
Start Small: Don't try to monitor everything day one. Begin with basic Kafka consumer lag and MongoDB connection counts. Add complexity gradually or you'll drown in metrics noise. The Four Golden Signals from Google SRE are a good framework: latency, traffic, errors, and saturation.
Correlation IDs are King: Every event needs a correlation ID that flows through your entire system. Generate them at the API gateway and log them everywhere. This single change will save you hours of debugging.
Alert Fatigue is Real: We started with 50+ alerts and got pages every hour. Now we have 5 critical alerts that actually matter: Kafka consumer lag > 10k messages, MongoDB replica set degraded, any service error rate > 5%, Kubernetes node not ready, Prometheus server OOM. Everything else is a dashboard metric.
Resource Planning: Prometheus will eat all available memory if you let it. MongoDB will cache everything in RAM. Kafka needs fast disks for log segments. Plan for 2x the resources you think you need, especially for storage.
The real secret: this stack works great once you get through the initial configuration hell and learn from your production failures.