What is Grafana?

Torkel Ödegaard started Grafana in 2014 because he was tired of Graphite's shitty web interface. Now it's 2025 and somehow this thing has 20 million users - from your homelab Raspberry Pi to Goldman Sachs production servers.

Grafana Logo

Grafana connects to basically anything that spits out data. Monitoring Prometheus metrics? Yep. Digging through Elasticsearch logs? Check. Making your CEO's quarterly dashboard look less depressing? It'll do that too.

Core Capabilities

Grafana connects to basically everything - 100+ data sources and growing. PostgreSQL, MongoDB, Prometheus, your legacy Oracle database that everyone's afraid to touch, random APIs - if it spits out data, Grafana can probably chart it. No vendor lock-in bullshit.

The visualization options are actually pretty solid - time series, heatmaps, geomaps, whatever. You can make your dashboards look professional or go completely overboard with flashy charts. Your call.

Grafana Dashboard Interface

The alerting system used to be hot garbage, but they rewrote it and now it actually works. Still takes forever to configure properly though. Recent versions have better alert management, but you'll still spend hours getting PagerDuty to play nice with your notification policies.

Pro tip from someone who learned this the hard way: Major version upgrades break custom plugins every fucking time. The alerting system migration usually works, but budget time for manual fixes when it doesn't. And for the love of all that's holy, set GRAFANA_LOG_LEVEL=debug when things get weird, but remember to turn it off or your logs will fill up faster than your disk space.

Grafana Graph Visualization

User management works like you'd expect - teams, roles, SSO integration for when your IT department insists on SAML. The audit logging is there for compliance boxes you need to tick. Role-based access control lets you lock down who can see what, and team management keeps your org chart happy. Check the docs when you need specific setup details for user provisioning or folder permissions.

Grafana vs Leading Observability Platforms

Feature

Grafana

Datadog

New Relic

Elastic Stack

Pricing Model

Open source + paid cloud

SaaS only

SaaS only

Open core + paid features

Data Sources

100+ plugins

Built-in + limited integrations

Built-in + limited integrations

Primarily Elasticsearch ecosystem

Cost Reality

$19/month (Pro plan)

$15/host/month minimum

$349/month (Pro plan)

DIY = time = money

Company Status

Doing well

Huge

Established

Well-funded

Visualization Types

20+ types

15+ types

12+ types

10+ types

Alerting

Advanced multi-channel

Comprehensive

Advanced

Basic to advanced

Open Source

✅ Core platform

❌ Proprietary

❌ Proprietary

✅ Limited (basic features)

Self-Hosted

✅ Full featured

❌ SaaS only

❌ SaaS only

✅ Available

Cloud Offering

✅ Grafana Cloud

✅ Primary model

✅ Primary model

✅ Elastic Cloud

Community

20M+ users

Large enterprise focus

Enterprise focus

Developer focused

Learning Curve

Steep (PromQL is a bitch)

Easy

Easy

Fucking nightmare

Vendor Lock-in

Low (open source)

High

High

Medium

The Grafana Observability Ecosystem

Grafana went from "just dashboards" to trying to be your entire observability stack with LGTM (Loki, Grafana, Tempo, Mimir). It mostly works, but good luck explaining why you need four different systems to see if your website is up.

Grafana LGTM Architecture

The LGTM Stack Components

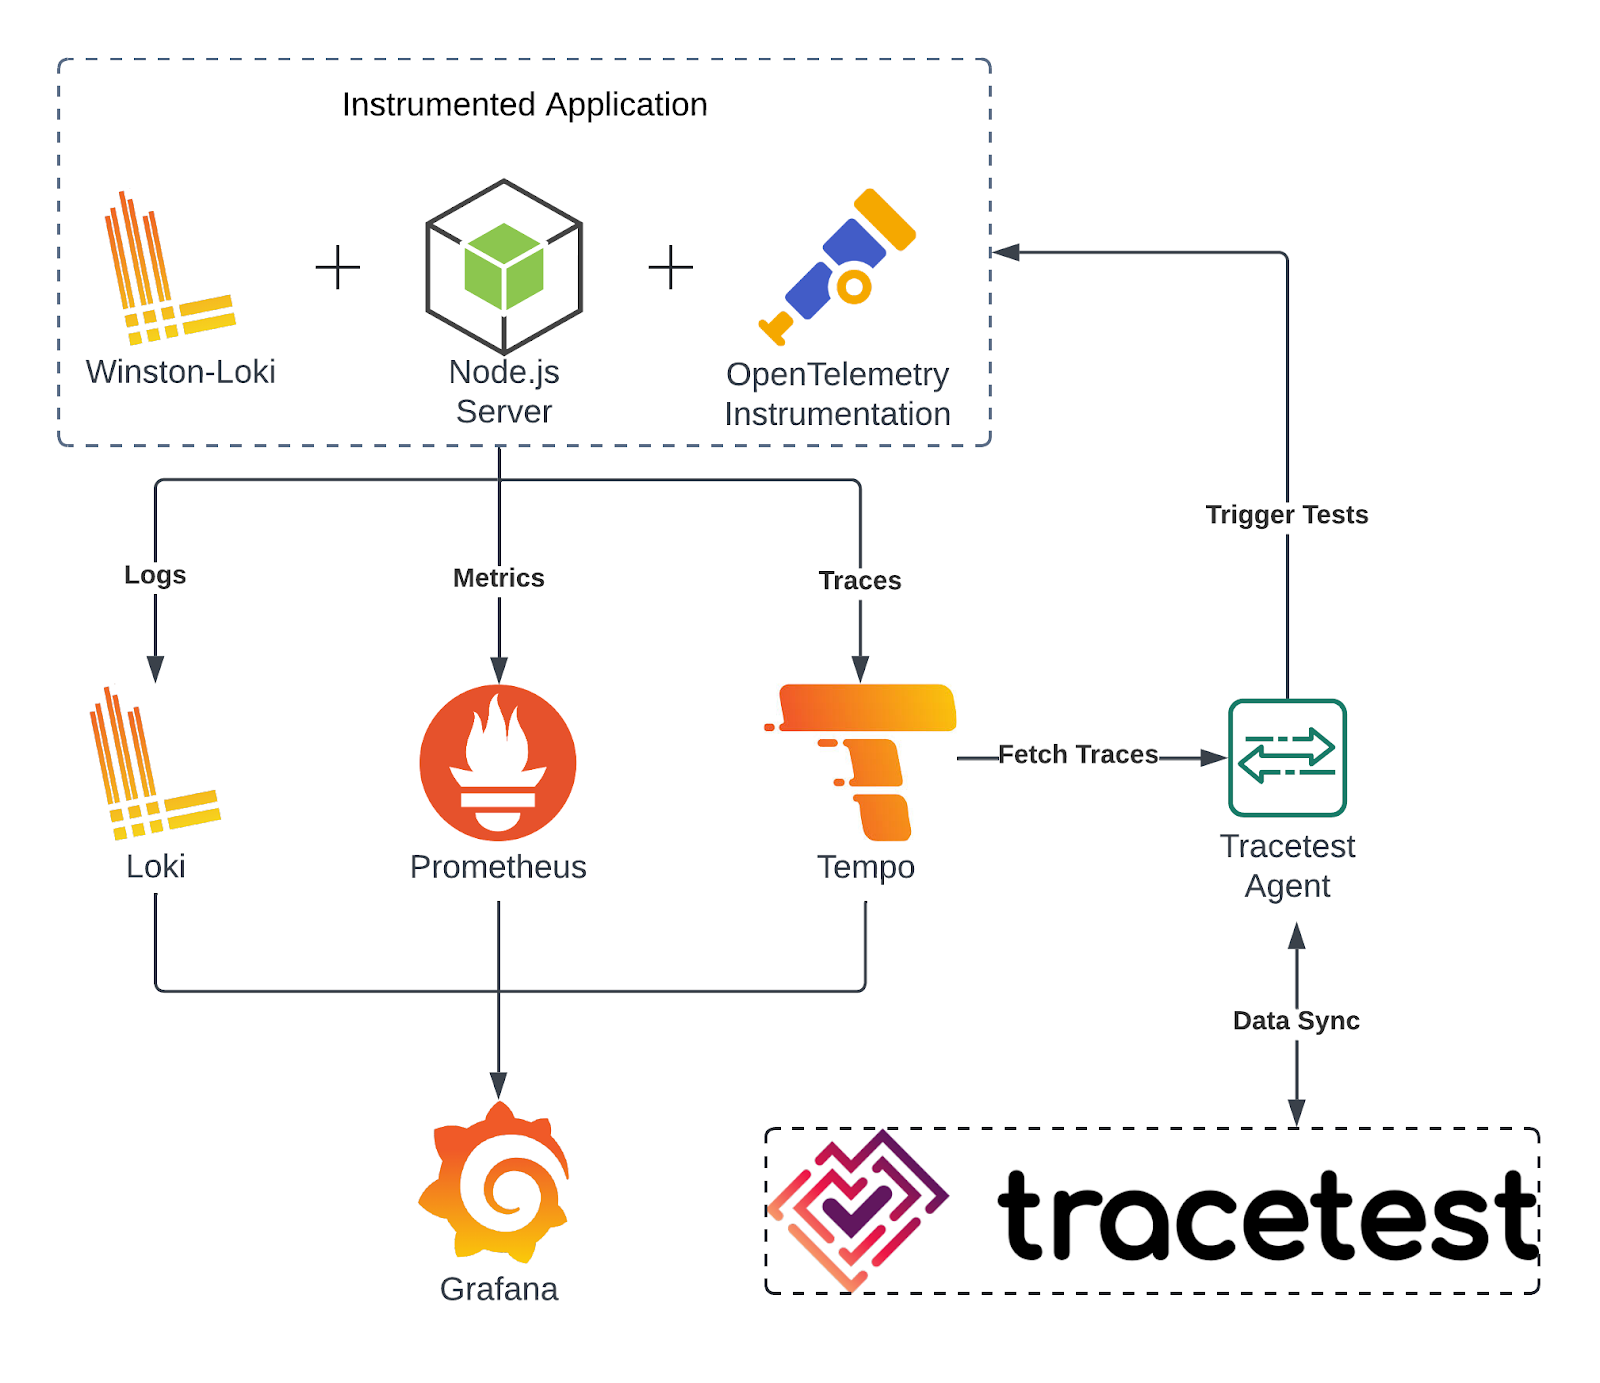
Loki is basically "what if Prometheus but for logs?" It's cheaper than Elasticsearch because it doesn't index everything, which is great until you need to search for something specific and realize you should have just used ELK stack. Loki's lack of full-text search will bite you when some manager asks "find all logs containing customer ID 12345" and you realize you need to know the exact timestamp.

Redis Dashboard Example

Tempo handles distributed tracing so you can figure out which microservice fucked up your request. Supports OpenTelemetry, Jaeger, Zipkin - all the usual suspects. When it works, tracing is magic. When it doesn't, you're debugging the tracing system instead of your actual problem. Tempo is great until you have one service generating 10x more spans than everything else and your storage costs explode.

Redis Streaming Visualization

Mimir is what you use when Prometheus falls over from too much data. Horizontal scaling, multi-tenancy, all that enterprise stuff. Still uses PromQL, so your existing queries work. Assuming you can figure out PromQL in the first place.

Grafana Alloy (formerly Grafana Agent) handles telemetry collection and forwarding. The config is actually readable, unlike most other collectors. Check their docs when you need specific deployment patterns - the community forums are where you'll end up when the docs don't cover your edge case.

Production War Stories (Learn From My Pain)

We had Grafana running for 2 years before realizing our Postgres datasource was timing out every query over 30 seconds. The default MySQL timeout is too short for large queries - bump it to 300 seconds or you'll hate your life.

The disk filled up with Grafana's SQLite database and took down monitoring during a production incident. Because nothing says "professional monitoring setup" like your monitoring dying when you need it most.

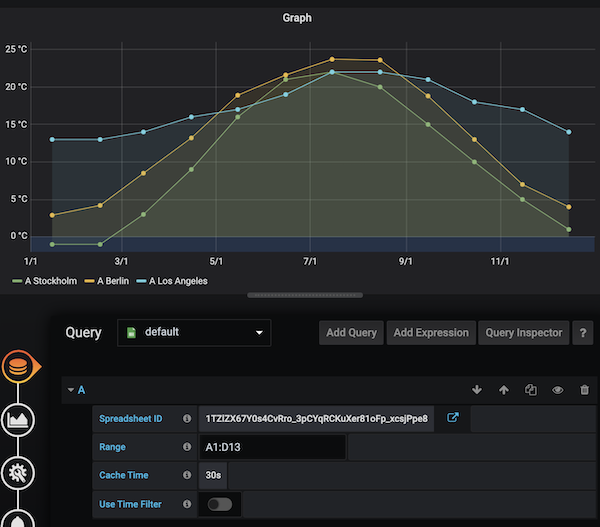
Spent 3 days debugging why dashboards were slow, turned out to be one rogue query scanning 6 months of data. Use the query inspector (that little inspect button) - it's your best friend for seeing why your PromQL is returning weird results.

Undocumented behaviors you'll discover at 3am: Grafana's auto-refresh stops working if you have the tab in the background for more than 10 minutes. Dashboard links break if you change the dashboard name, even though they should use UIDs. The 'Explore' feature is way faster than building test panels for debugging queries - use it.

Business Impact and Adoption

Grafana Labs is doing pretty well - they're not going anywhere, which matters when you're betting your monitoring stack on them. Not bad for a company that started because someone hated Graphite's UI.

Big companies like Salesforce, Bloomberg, and JP Morgan use this stuff because it works and doesn't cost as much as Datadog. Bloomberg probably has a team of 20 people just maintaining their Grafana cluster, but at least they can see all 50,000 metrics in one place.

Open Source vs Enterprise Offerings

Open source Grafana is actually pretty generous - unlimited everything, just no fancy enterprise features. Community support means Stack Overflow and hoping someone on GitHub Issues had your exact problem 3 years ago.

Grafana Cloud has a decent free tier - 10k metrics, 50GB logs/traces/profiles. You'll probably hit the limits faster than you think once you start monitoring real stuff, but it's way better than Datadog's "3 hosts and good luck" free plan.

Grafana Enterprise is what you buy when your compliance team won't shut up about SAML and audit logs. Priority support means they'll actually respond to your tickets in days instead of months, and won't immediately close them as "works on my machine."

Our Loki instance hit 95% disk usage and started dropping logs silently. No error messages, no alerts, just missing logs during our biggest outage of the year. Remember to monitor your monitoring system, because it will fail when you need it most.

Frequently Asked Questions

Q

What is the difference between Grafana OSS and Grafana Cloud?

A

Grafana OSS is the "I'll run this myself, thank you" version

  • self-hosted, open source, and completely free. Grafana Cloud is the "just make it work" SaaS version with automatic updates and the full LGTM stack baked in. Cloud's free tier is actually decent
  • 10k metrics and 50GB of logs/traces before they start charging you.
Q

How much does Grafana cost?

A

Grafana OSS is completely free. Grafana Cloud starts with a meaningful free tier and scales with consumption-based pricing: $15-55/month per active user, $8-16 per 1,000 metrics series, $0.40/GB for logs, and $0.50/GB for traces. Enterprise pricing is available for organizations requiring advanced features and support.

Q

Can Grafana replace Datadog or New Relic?

A

Grafana can replace them, but migration is a pain in the ass. Plan on spending weeks recreating dashboards because nothing imports cleanly. Your alerting rules will need to be rebuilt from scratch. Datadog's UI is more polished, but their pricing is insane.

The Grafana to Datadog dashboard converter doesn't exist, so plan on rebuilding everything from scratch. What looks like a 2-week migration turns into 6 weeks when you realize half your queries use proprietary functions that don't exist in the new platform.

Q

What data sources does Grafana support?

A

Grafana supports over 100 data source plugins, including Prometheus, InfluxDB, Elasticsearch, PostgreSQL, MySQL, AWS CloudWatch, Azure Monitor, Google Cloud Monitoring, Datadog, New Relic, and many others. The plugin architecture allows custom data source development.

Grafana Spreadsheet Integration

Q

Is Grafana suitable for business intelligence and non-technical users?

A

While Grafana excels at technical monitoring, recent versions have improved usability for business users. They've added better currency formatting and business-focused visualizations, but honestly, dedicated BI tools are still better for complex business analytics. Grafana's strength is operational data, not quarterly revenue reports.

Q

How does Grafana handle authentication and security?

A

Grafana supports multiple authentication methods including built-in users, LDAP, OAuth (Google, GitHub, Azure), and SAML. Grafana Enterprise adds advanced security features like audit logging, enhanced RBAC, and team-based permissions. Setting up SAML is still a pain in the ass, but at least it works once you get it configured.

Q

What's new in the latest Grafana version?

A

Recent versions keep improving the alerting interface (finally getting usable), added some useful transformations for trend analysis, and better cloud provider integrations. Azure auth used to be completely broken, now it just mostly works.

Version upgrade gotchas: New features often need feature toggles enabled in OSS. Major version changes break variable syntax in annotations every fucking time. Always test upgrades in staging first - learned this the hard way when 11.x broke half our production dashboards.

Q

How do I migrate from other monitoring tools to Grafana?

A

Every migration I've done has been a nightmare. Spent 6 weeks moving off Datadog last year

  • their proprietary query language doesn't translate to Prom

QL, so you're rewriting every fucking dashboard query from scratch. Your alerting rules? Completely different webhook formats, none of them compatible. I budgeted 3 weeks, it took 6.

Q

Can Grafana handle large-scale enterprise deployments?

A

It scales fine if you know what you're doing. Big companies like PayPal and eBay make it work, but they probably have dedicated teams just for maintaining their monitoring stack. Self-hosted means you're on the hook for high availability, database clustering, all that fun ops work.

Q

What programming skills are needed to use Grafana effectively?

A

Basic dashboards are point-and-click, which lasts about 5 minutes until you need actual useful data. Then you're writing Prom

QL queries, and PromQL is like regex had a baby with SQL and forgot to make it intuitive. LogQL exists too

  • it's PromQL's even weirder cousin that nobody talks about. I've been using this shit for 3 years and still Google the syntax for rate() vs increase() every damn time.

Related Tools & Recommendations

integration
Similar content

ELK Stack for Microservices Logging: Monitor Distributed Systems

How to Actually Monitor Distributed Systems Without Going Insane

Elasticsearch
/integration/elasticsearch-logstash-kibana/microservices-logging-architecture
100%
integration
Similar content

Prometheus, Grafana, Alertmanager: Complete Monitoring Stack Setup

How to Connect Prometheus, Grafana, and Alertmanager Without Losing Your Sanity

Prometheus
/integration/prometheus-grafana-alertmanager/complete-monitoring-integration
96%
tool
Similar content

Kibana - Because Raw Elasticsearch JSON Makes Your Eyes Bleed

Stop manually parsing Elasticsearch responses and build dashboards that actually help debug production issues.

Kibana
/tool/kibana/overview
93%
tool
Similar content

Prometheus Monitoring: Overview, Deployment & Troubleshooting Guide

Free monitoring that actually works (most of the time) and won't die when your network hiccups

Prometheus
/tool/prometheus/overview
93%
tool
Similar content

New Relic Overview: App Monitoring, Setup & Cost Insights

New Relic tells you when your apps are broken, slow, or about to die. Not cheap, but beats getting woken up at 3am with no clue what's wrong.

New Relic
/tool/new-relic/overview
86%
compare
Recommended

PostgreSQL vs MySQL vs MongoDB vs Cassandra - Which Database Will Ruin Your Weekend Less?

Skip the bullshit. Here's what breaks in production.

PostgreSQL
/compare/postgresql/mysql/mongodb/cassandra/comprehensive-database-comparison
71%
pricing
Similar content

Datadog, New Relic, Sentry Enterprise Pricing & Hidden Costs

Observability pricing is a shitshow. Here's what it actually costs.

Datadog
/pricing/datadog-newrelic-sentry-enterprise/enterprise-pricing-comparison
61%
tool
Similar content

Alertmanager - Stop Getting 500 Alerts When One Server Dies

Learn how Alertmanager processes alerts from Prometheus, its advanced features, and solutions for common issues like duplicate alerts. Get an overview of its pr

Alertmanager
/tool/alertmanager/overview
59%
pricing
Similar content

Datadog Enterprise Pricing: Real Costs & Hidden Fees Analysis

The Real Numbers Behind Datadog's "Starting at $23/host" Bullshit

Datadog
/pricing/datadog/enterprise-cost-analysis
58%
tool
Similar content

Django Production Deployment Guide: Docker, Security, Monitoring

From development server to bulletproof production: Docker, Kubernetes, security hardening, and monitoring that doesn't suck

Django
/tool/django/production-deployment-guide
39%
tool
Similar content

KrakenD Production Troubleshooting - Fix the 3AM Problems

When KrakenD breaks in production and you need solutions that actually work

Kraken.io
/tool/kraken/production-troubleshooting
39%
tool
Similar content

Alpaca Trading API Production Deployment Guide & Best Practices

Master Alpaca Trading API production deployment with this comprehensive guide. Learn best practices for monitoring, alerts, disaster recovery, and handling real

Alpaca Trading API
/tool/alpaca-trading-api/production-deployment
39%
tool
Similar content

Azure OpenAI Service: Production Troubleshooting & Monitoring Guide

When Azure OpenAI breaks in production (and it will), here's how to unfuck it.

Azure OpenAI Service
/tool/azure-openai-service/production-troubleshooting
39%
tool
Similar content

TaxBit Enterprise Production Troubleshooting: Debug & Fix Issues

Real errors, working fixes, and why your monitoring needs to catch these before 3AM calls

TaxBit Enterprise
/tool/taxbit-enterprise/production-troubleshooting
39%
tool
Similar content

PostgreSQL Performance Optimization: Master Tuning & Monitoring

Optimize PostgreSQL performance with expert tips on memory configuration, query tuning, index design, and production monitoring. Prevent outages and speed up yo

PostgreSQL
/tool/postgresql/performance-optimization
35%
tool
Similar content

Falco - Linux Security Monitoring That Actually Works

The only security monitoring tool that doesn't make you want to quit your job

Falco
/tool/falco/overview
35%
tool
Similar content

Fix gRPC Production Errors - The 3AM Debugging Guide

Fix critical gRPC production errors: 'connection refused', 'DEADLINE_EXCEEDED', and slow calls. This guide provides debugging strategies and monitoring solution

gRPC
/tool/grpc/production-troubleshooting
35%
tool
Similar content

Node.js Production Deployment - How to Not Get Paged at 3AM

Optimize Node.js production deployment to prevent outages. Learn common pitfalls, PM2 clustering, troubleshooting FAQs, and effective monitoring for robust Node

Node.js
/tool/node.js/production-deployment
35%
tool
Similar content

Aqua Security Troubleshooting: Resolve Production Issues Fast

Real fixes for the shit that goes wrong when Aqua Security decides to ruin your weekend

Aqua Security Platform
/tool/aqua-security/production-troubleshooting
35%
tool
Similar content

Interactive Brokers TWS API Production Deployment Guide

Three years of getting fucked by production failures taught me this

Interactive Brokers TWS API
/tool/interactive-brokers-api/production-deployment-guide
35%

Recommendations combine user behavior, content similarity, research intelligence, and SEO optimization