The OpenTelemetry Collector is basically a proxy that sits between your apps and whatever monitoring backend you're paying too much for this month. Instead of instrumenting your code to send data directly to Datadog/New Relic/whatever, you send it to the Collector and let it figure out where to route it.
I've been running this in production for two years after getting a $18k monthly Datadog bill that made our VP cry. The Collector saved our ass by letting us ship 90% of our data to cheaper backends while keeping critical alerts in Datadog.
How this piece of shit actually works

The Collector has three types of components that form a pipeline:

- Receivers: Accept data in various formats (OTLP, Jaeger, Zipkin, Prometheus). OTLP works, the others... sometimes.
- Processors: Mess with your data (sampling, filtering, enrichment). This is where you save money.
- Exporters: Ship processed data to backends. Half of them work, the other half need weird config tweaks.
Current version bullshit
As of September 2025, we're at v0.135.0 for the core. Avoid v0.89.0 - it had memory issues that caused frequent crashes. Learned that the hard way during a Black Friday deployment.
The "stability" ratings are marketing. "Alpha" means it'll randomly break. "Beta" means it breaks predictably. "Stable" means it only breaks when you update.
Two ways to deploy this nightmare
Agent Pattern (sidecar or daemon):
- Deploy next to each application
- Lower latency since data doesn't travel far
- Uses more resources but fails independently
- We use this for critical services
Gateway Pattern (centralized):
- One big collector serving multiple apps
- Cheaper on resources, harder to debug when it shits itself
- Single point of failure that'll take down your entire observability
- Great for non-critical services
Why we actually use this thing
Escaping vendor lock-in: We were stuck paying Datadog $18k/month because switching would mean rewriting instrumentation in 47 microservices. With the Collector, we switched backends in 2 hours by changing one config file.
Cost savings: We now send 90% of our data to Grafana Cloud (much cheaper) and only keep high-value data in Datadog. Cut our observability costs by 73%.
Data processing: The Collector can sample traces, filter out noisy metrics, and redact PII before it leaves your network. Direct exporters can't do this shit.
Reliability: The Collector has built-in retries and buffering. When your backend goes down (and it will), you don't lose data. Direct exports just fail silently and you're fucked.
Shit that actually helped me:
- Release notes - check before upgrading anything
- Troubleshooting docs - only useful docs when collector breaks
- Community Slack - real engineers who've seen your exact problem
- OpenTelemetry docs - the source of truth when shit breaks
- Collector architecture guide - explains why this thing is designed the way it is
- SignOz production guide - practical deployment advice that works
- Performance issues tracker - known performance gotchas
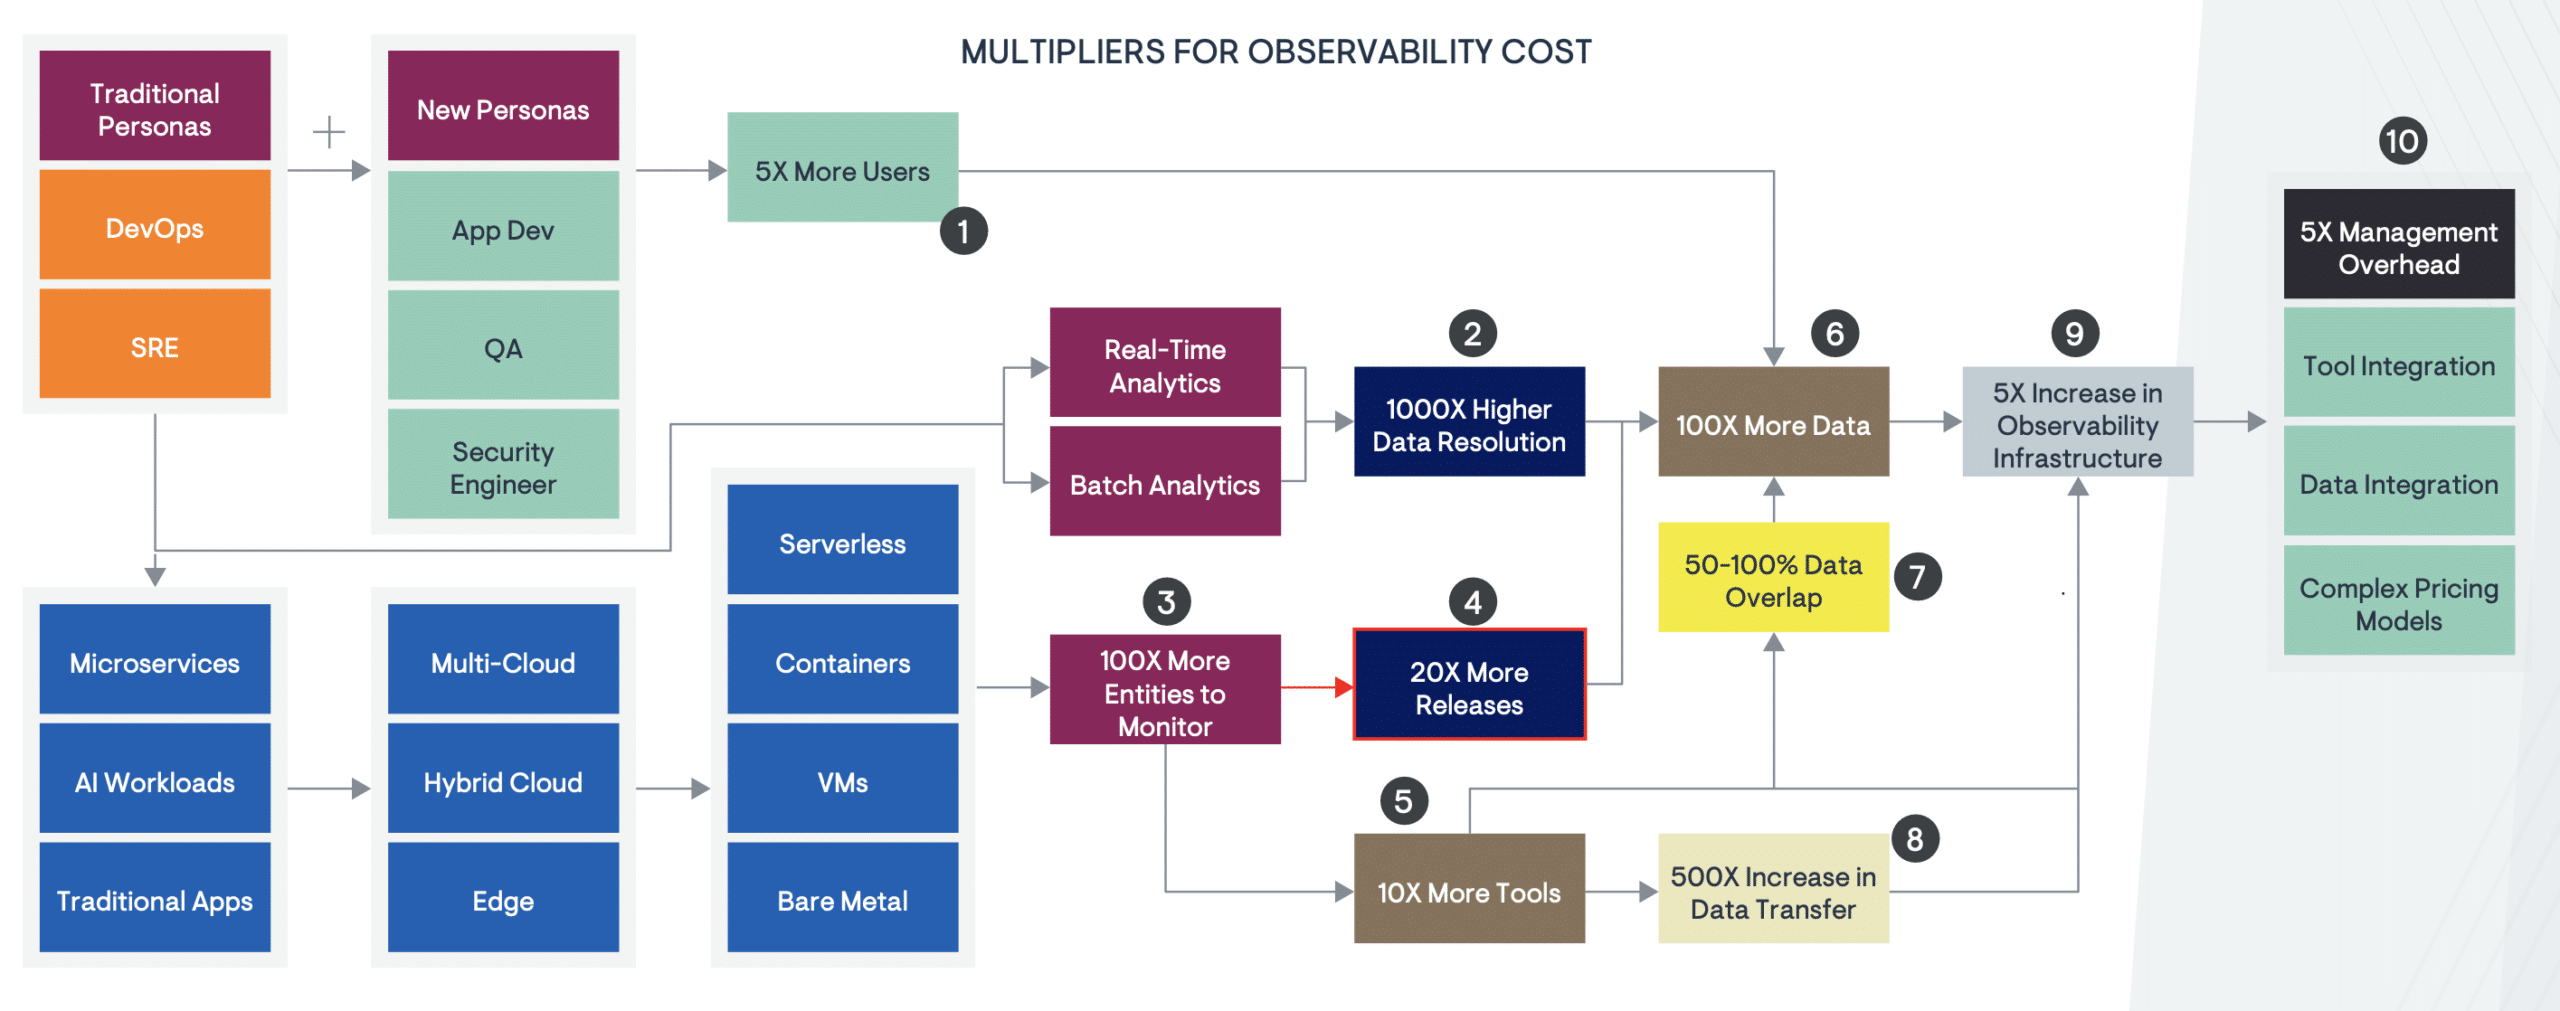
- Pricing trap analysis - why vendor bills explode
- Cost comparison spreadsheet - real pricing data for budgeting
- Datadog vs New Relic costs - helps justify switching to cheaper backends