AWS X-Ray shows you exactly which microservice is making your API slow as molasses. When your distributed system turns into a debugging nightmare at 3am because users are complaining about timeouts, X-Ray tells you exactly where the bottleneck is hiding.
But here's the kicker: AWS announced in August 2025 that X-Ray SDKs and daemon reach end-of-support on February 25, 2027. They're pushing everyone to migrate to OpenTelemetry, so if you're starting fresh, skip X-Ray entirely and go straight to AWS Distro for OpenTelemetry.

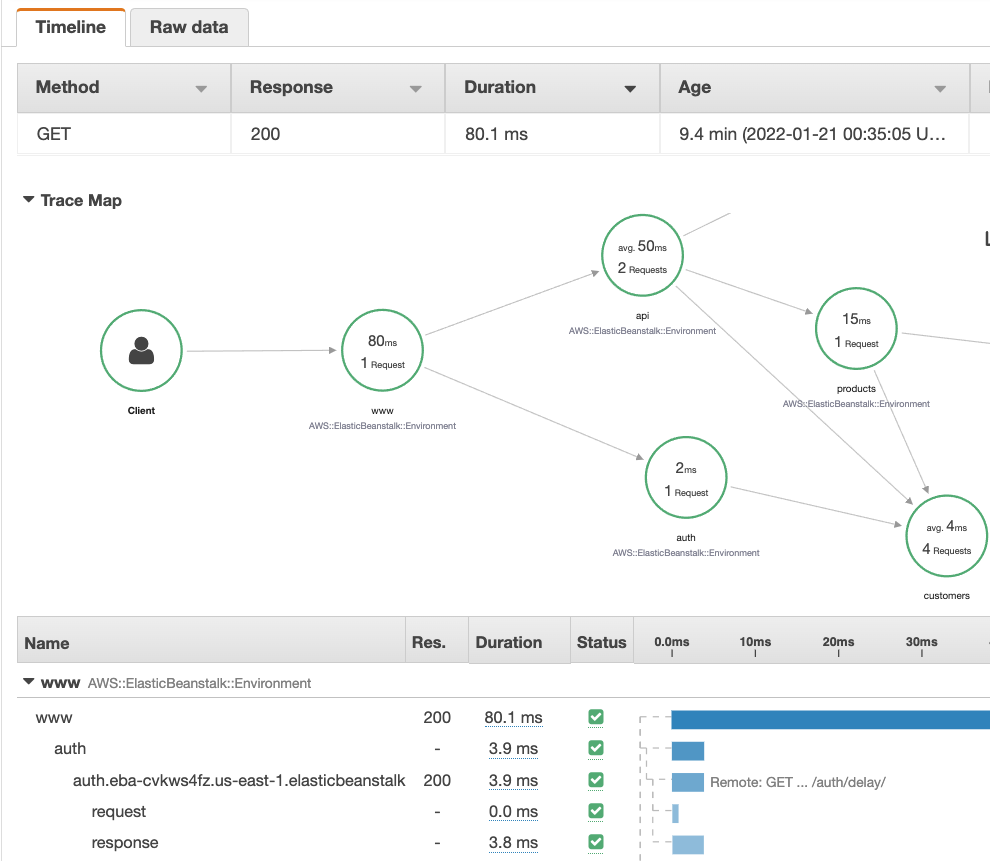
Instead of playing guess-the-bottleneck with your 40-something microservices, X-Ray traces requests from frontend to database and every hop in between. It captures how long each service takes to respond, which ones are throwing errors, and exactly where your performance is going to hell.
Your app sends trace data to the X-Ray daemon via UDP. Yes, UDP - what could go wrong? But surprisingly, it works pretty well most of the time.
How This Thing Actually Works
The X-Ray daemon runs on port 2000 UDP and collects trace segments from your apps. If the daemon crashes, you lose traces - learned that one the hard way during a production incident where we couldn't figure out why our checkout flow was timing out.
Good news: the daemon comes pre-installed on Elastic Beanstalk and Lambda. Bad news: everywhere else you need to install and manage it yourself. Pro tip: run it as a systemd service or you'll forget it's there until traces stop showing up.
What AWS Services Actually Work With X-Ray
X-Ray auto-instruments most AWS services you actually use: RDS, DynamoDB, SQS, SNS, and ElastiCache. The magic happens through the AWS SDK - when your code makes calls to these services, X-Ray automatically creates subsegments showing how long each database query or queue operation took.
Here's the stuff that actually works out of the box:
- SQL query execution times (finally, proof that your JOIN is the problem)
- DynamoDB read/write latency
- SQS message processing delays
- HTTP calls to external APIs (including the ones that randomly timeout)
The bad news? If you're running multi-cloud or on-premises, X-Ray is AWS-only. Jaeger or Zipkin might be better choices if you need portability.
Language Support (And What Actually Works)
The official SDKs cover the usual suspects:
- Java: Works great with Spring Boot, less great with everything else
- Node.js: Decent Express.js integration, manual work for anything fancy
- Python: Flask and Django support, but you'll spend time wrestling with middleware
- .NET: ASP.NET Core works fine, Framework support exists but is janky
- Go: Basic support, expect to write some boilerplate
- Ruby: Rails integration exists, documentation could be better

Pro tip: OpenTelemetry support means you're not completely locked into AWS if you need to switch observability backends later. The AWS Distro for OpenTelemetry works with X-Ray but adds another layer of complexity.
Why X-Ray Actually Helps (When It Works)
Finding the Slow Shit: Instead of guessing which service is the bottleneck, X-Ray shows you the exact milliseconds each component takes. Spoiler alert: it's usually the database query you wrote six months ago and forgot about.
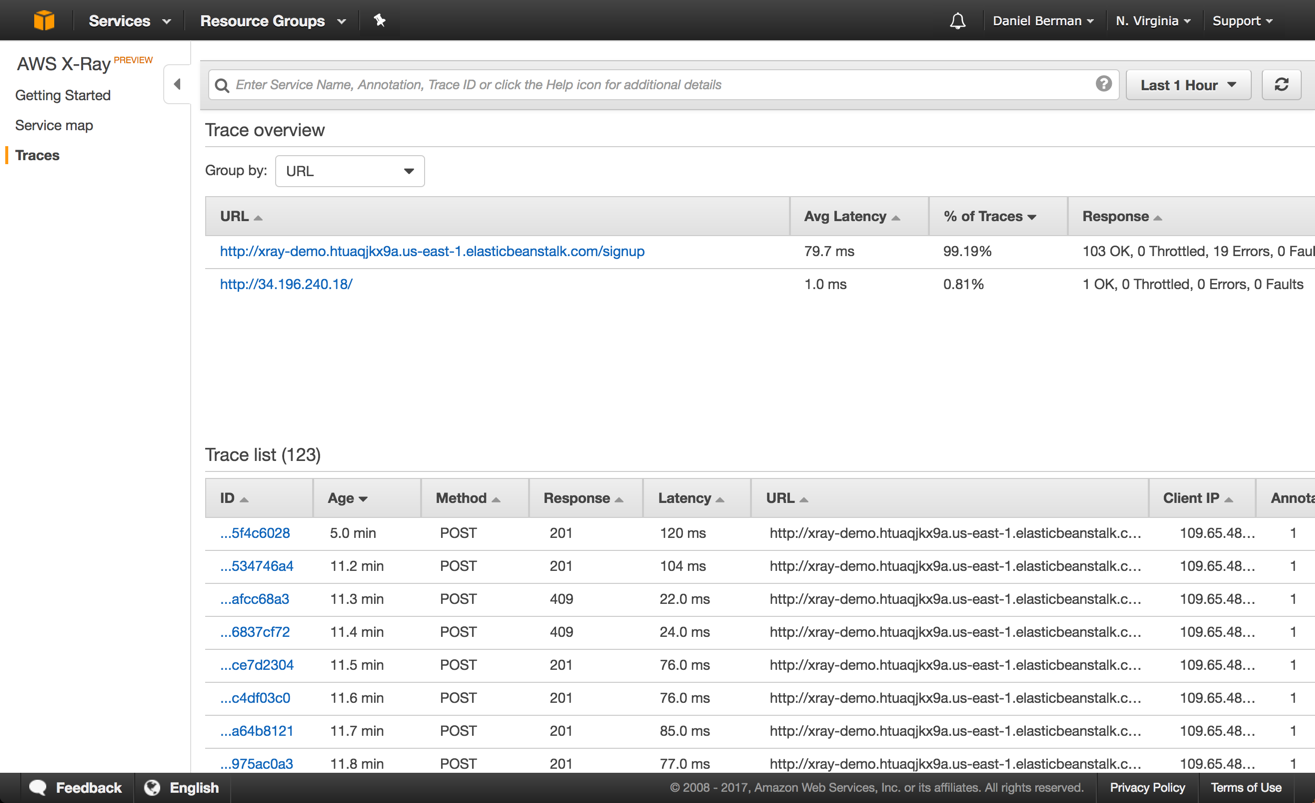
Debugging Production Disasters: When your API starts throwing 500s at 2am, X-Ray traces show you exactly which service failed and why. Stack traces, error context, and the full request path - everything you need to fix it without waking up the entire team.

Capacity Planning That's Not Guesswork: X-Ray shows you which services get hammered during peak traffic. Finally, data-driven decisions about where to throw more EC2 instances instead of just scaling everything and hoping for the best.
Real Example: We discovered our checkout service was spending something like 3.2 seconds waiting for a rate-limiting API call that could've been cached. One Redis implementation later, checkout latency dropped 70%. X-Ray paid for itself in the first month.
The Migration Reality: AWS is being generous with the timeline - you have until February 2027 to migrate off X-Ray SDKs. That sounds like forever until you realize you'll need to rewrite instrumentation code across dozens of services, test everything in staging, and coordinate deployments. Start your OpenTelemetry migration planning now, not in 2026 when everyone else panics.


 Pro tip: Start with 1% sampling and increase only if you need more data.
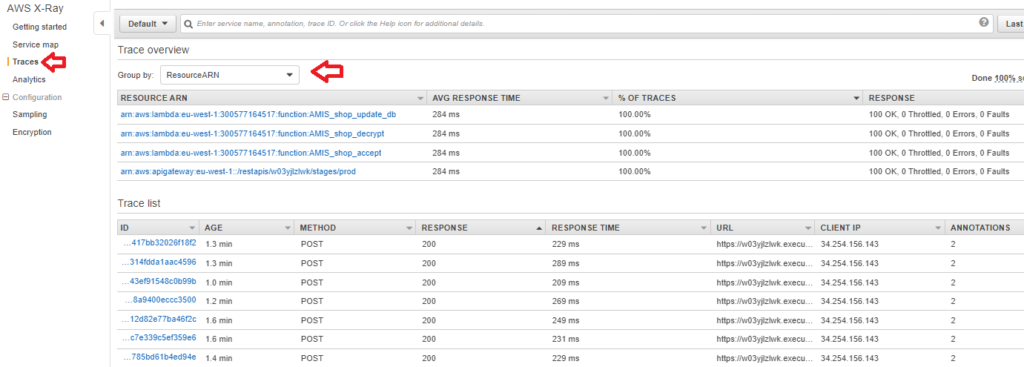
 Pro tip: Add custom error annotations so you can filter by error type instead of digging through stack traces.