Currently viewing the human version
Switch to AI version

Why Your Vector Database Runs Like Garbage

Vector DB performance issues are like debugging a distributed system designed by someone who hates you. Everything affects everything else, and the error messages tell you absolutely nothing useful.

HNSW: Fast But Hungry
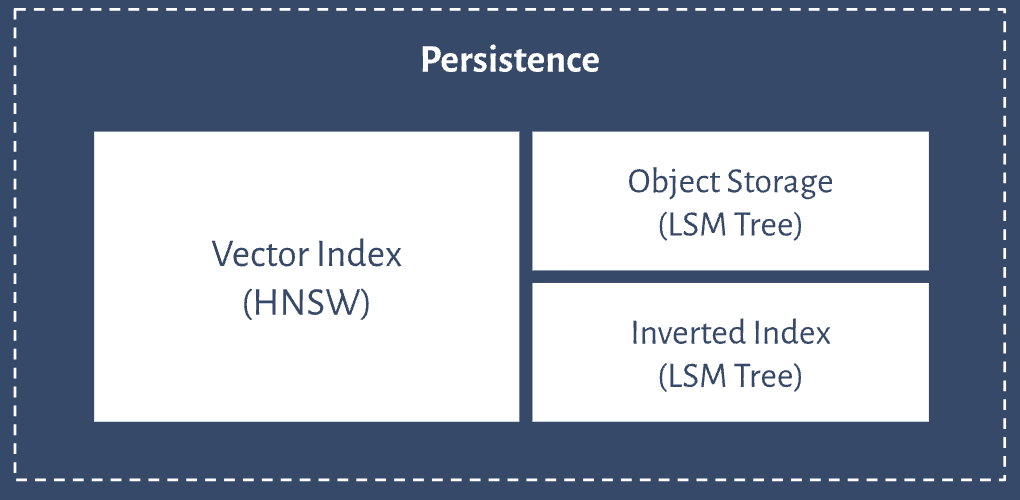
Vector Database Architecture

HNSW promises fast searches but will eat your RAM for breakfast. I think I'm running like... a million-ish 1536-dimensional vectors? Maybe 1.2 million? Anyway, it's using something like 6.2GB of memory - most of that is just storing the vectors, but the index overhead adds up fast. When you run out of RAM, performance doesn't just slow down, it falls off a fucking cliff because everything starts swapping to disk.

Pinecone's docs explain the theory if you want to dig deeper (though their examples assume you have infinite memory). Brendan Gregg wrote about why CPU metrics lie during memory pressure - turned out that's exactly what was happening to us.

I learned this the hard way during a product demo where queries went from like 8-10ms to... Jesus, I think it was around 25-30 seconds? Something ridiculously slow. Turns out we hit the memory limit and Linux started swapping. The demo was a complete disaster and I looked like a fucking idiot in front of the whole engineering team.

The Linux kernel docs have good info on memory management concepts, and Redis has solid guidance on vector performance optimization.

IVF: Clustering Hell
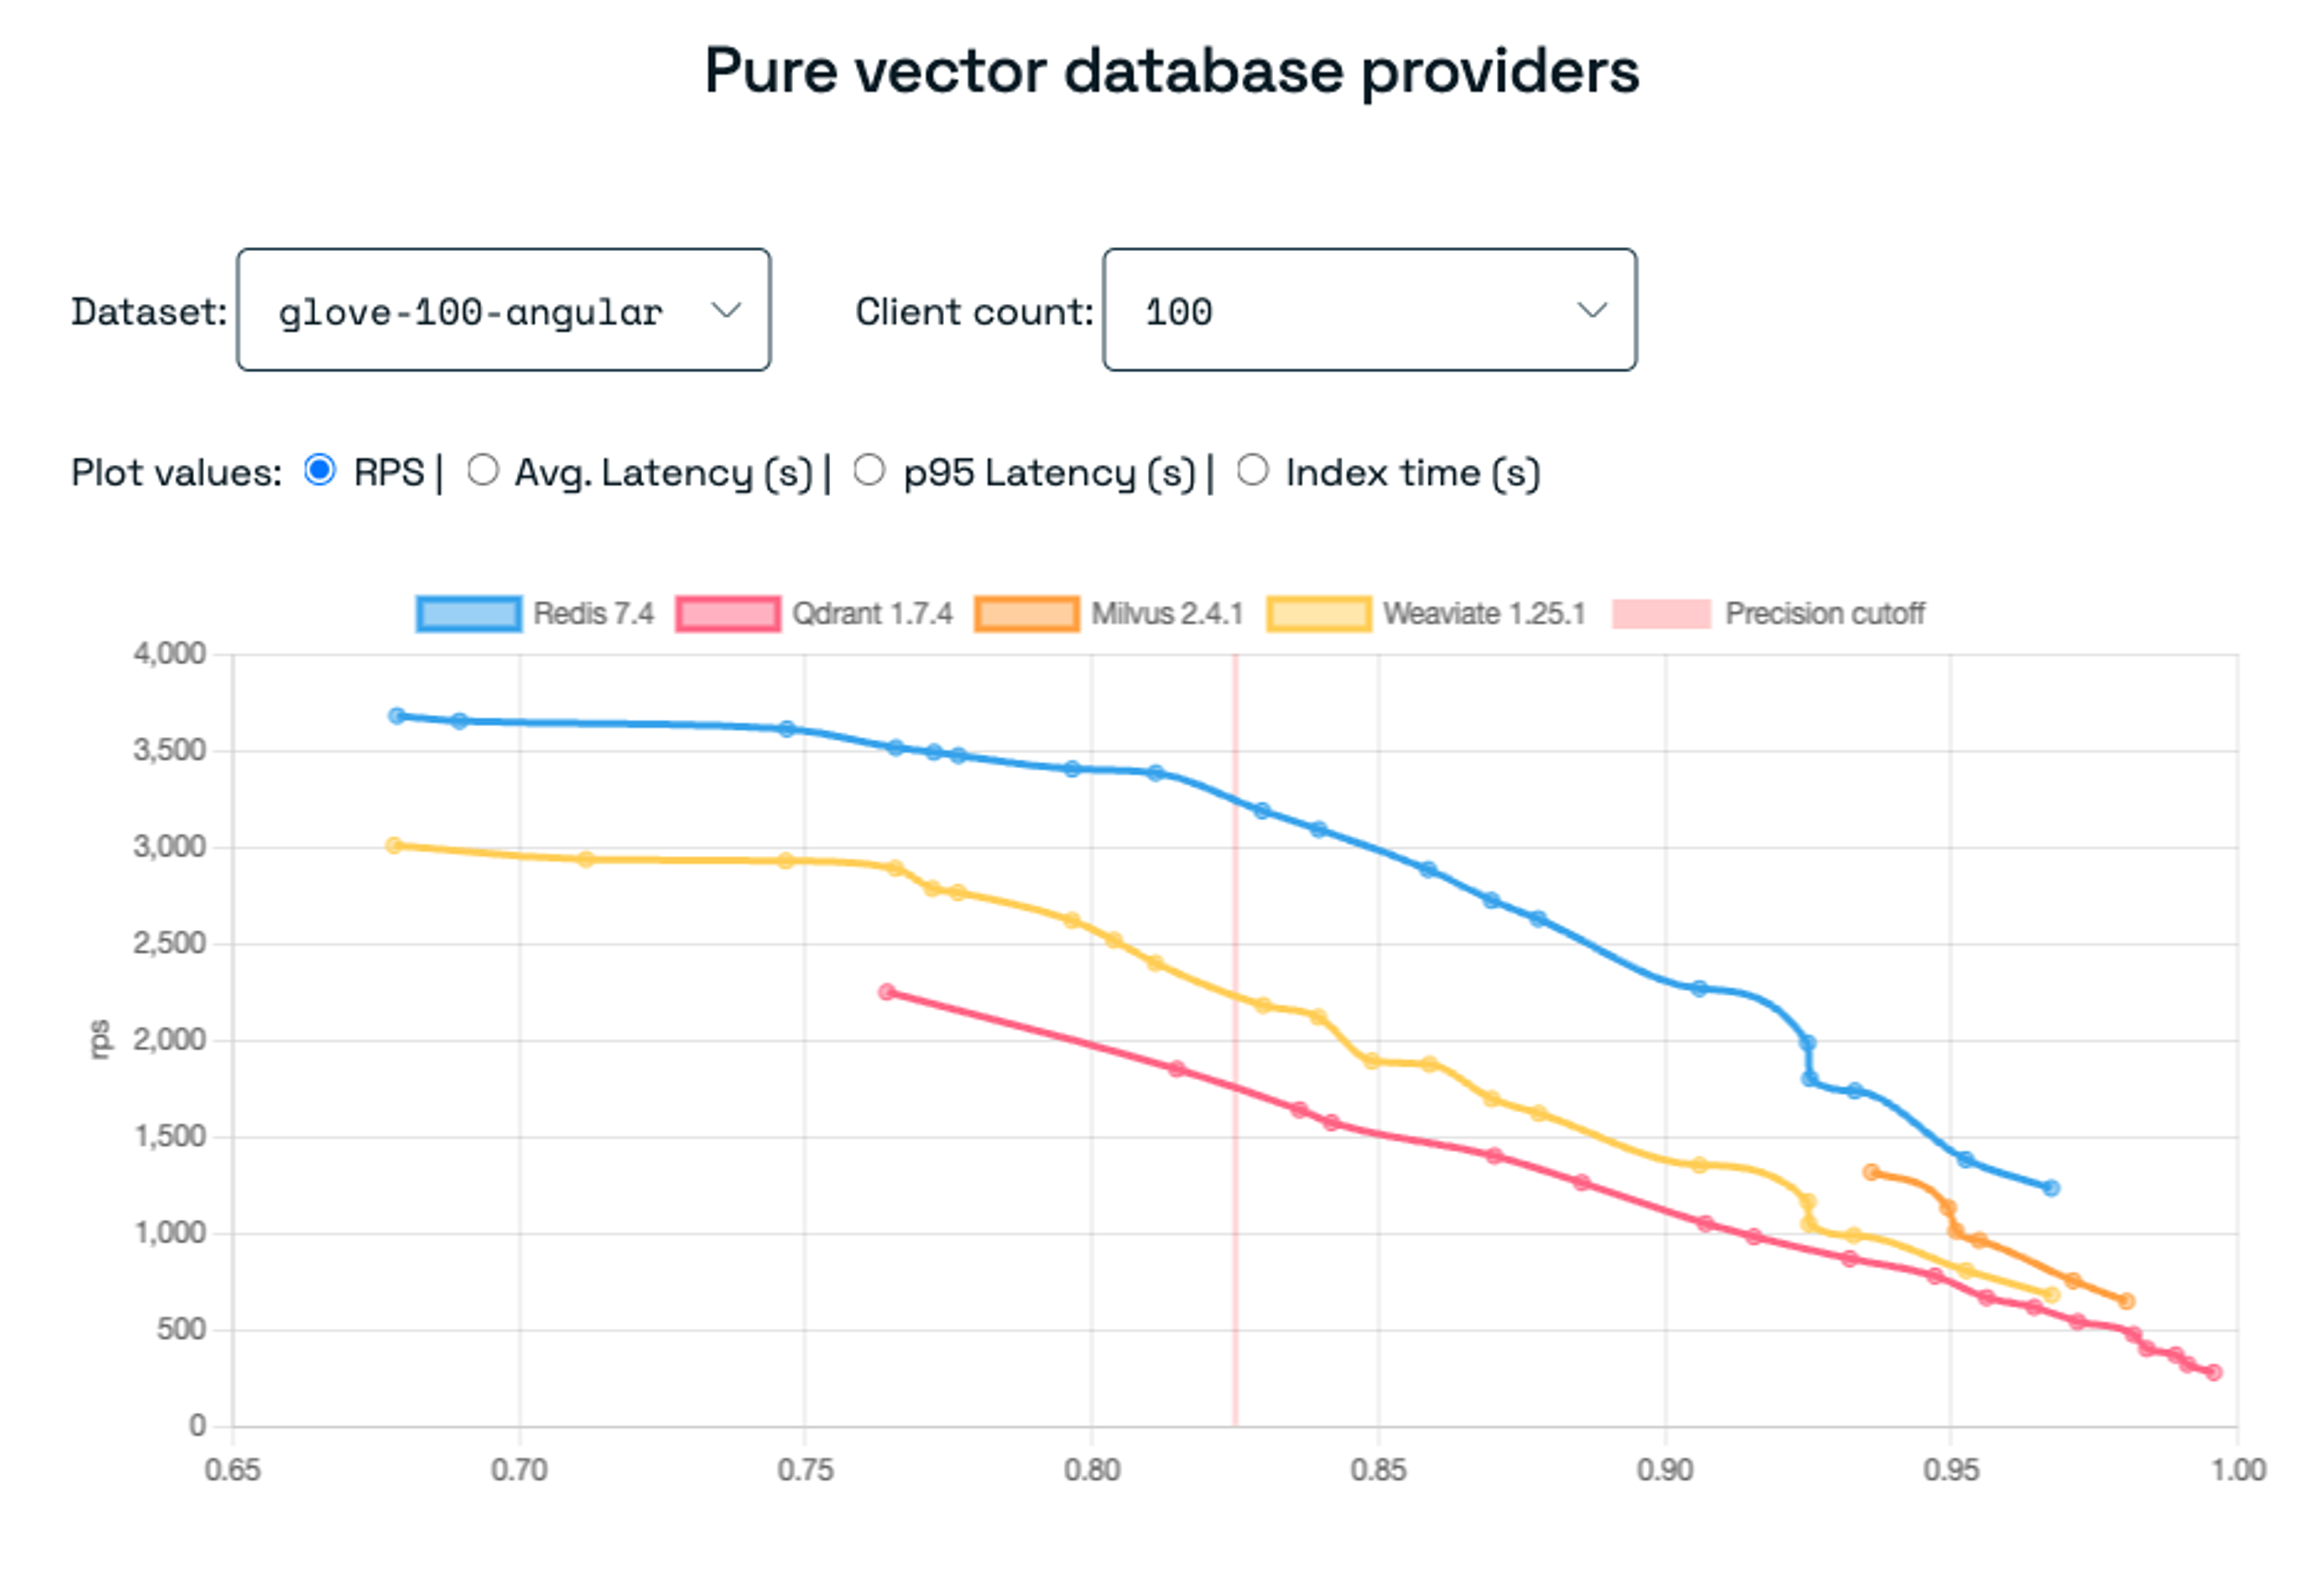
Vector Database Architecture Comparison

IVF indexes are supposed to be smart - they cluster your vectors and only search the relevant clusters. The theory says use √N clusters, but real data doesn't give a shit about theory.

Text embeddings cluster in completely fucked up ways. I had this dataset where like... shit, I think 70-something percent of vectors ended up in just 3 or 4 clusters? Maybe it was 75%? Hard to remember exactly, but it was bad. They were all similar content so of course they clustered together. Queries to those clusters were slow as hell while empty clusters did nothing. Ended up using way more clusters than the theory said we needed.

OpenAI has some blog posts about their embedding improvements (though they never mention the clustering problems). There's research on cluster imbalance but it's pretty academic.

Product Quantization: Lossy But Necessary

PQ compresses vectors massively - like 90-95% compression ratios. A 1536-dimensional vector that takes 6KB becomes something like... I don't know, 150-200 bytes? Maybe less. Sounds great until you realize the accuracy hit might not be worth it.

Facebook Engineering has some FAISS compression posts (the math is a nightmare). FAISS docs cover the basics if you want to suffer through them.

Spent like 3 days, maybe 4, optimizing PQ parameters only to find out our similarity thresholds were completely fucked for the compressed data. Users were getting garbage results and we had to roll back the "optimization." That was a fun conversation with the product team.

GPU Lies and Marketing Bullshit
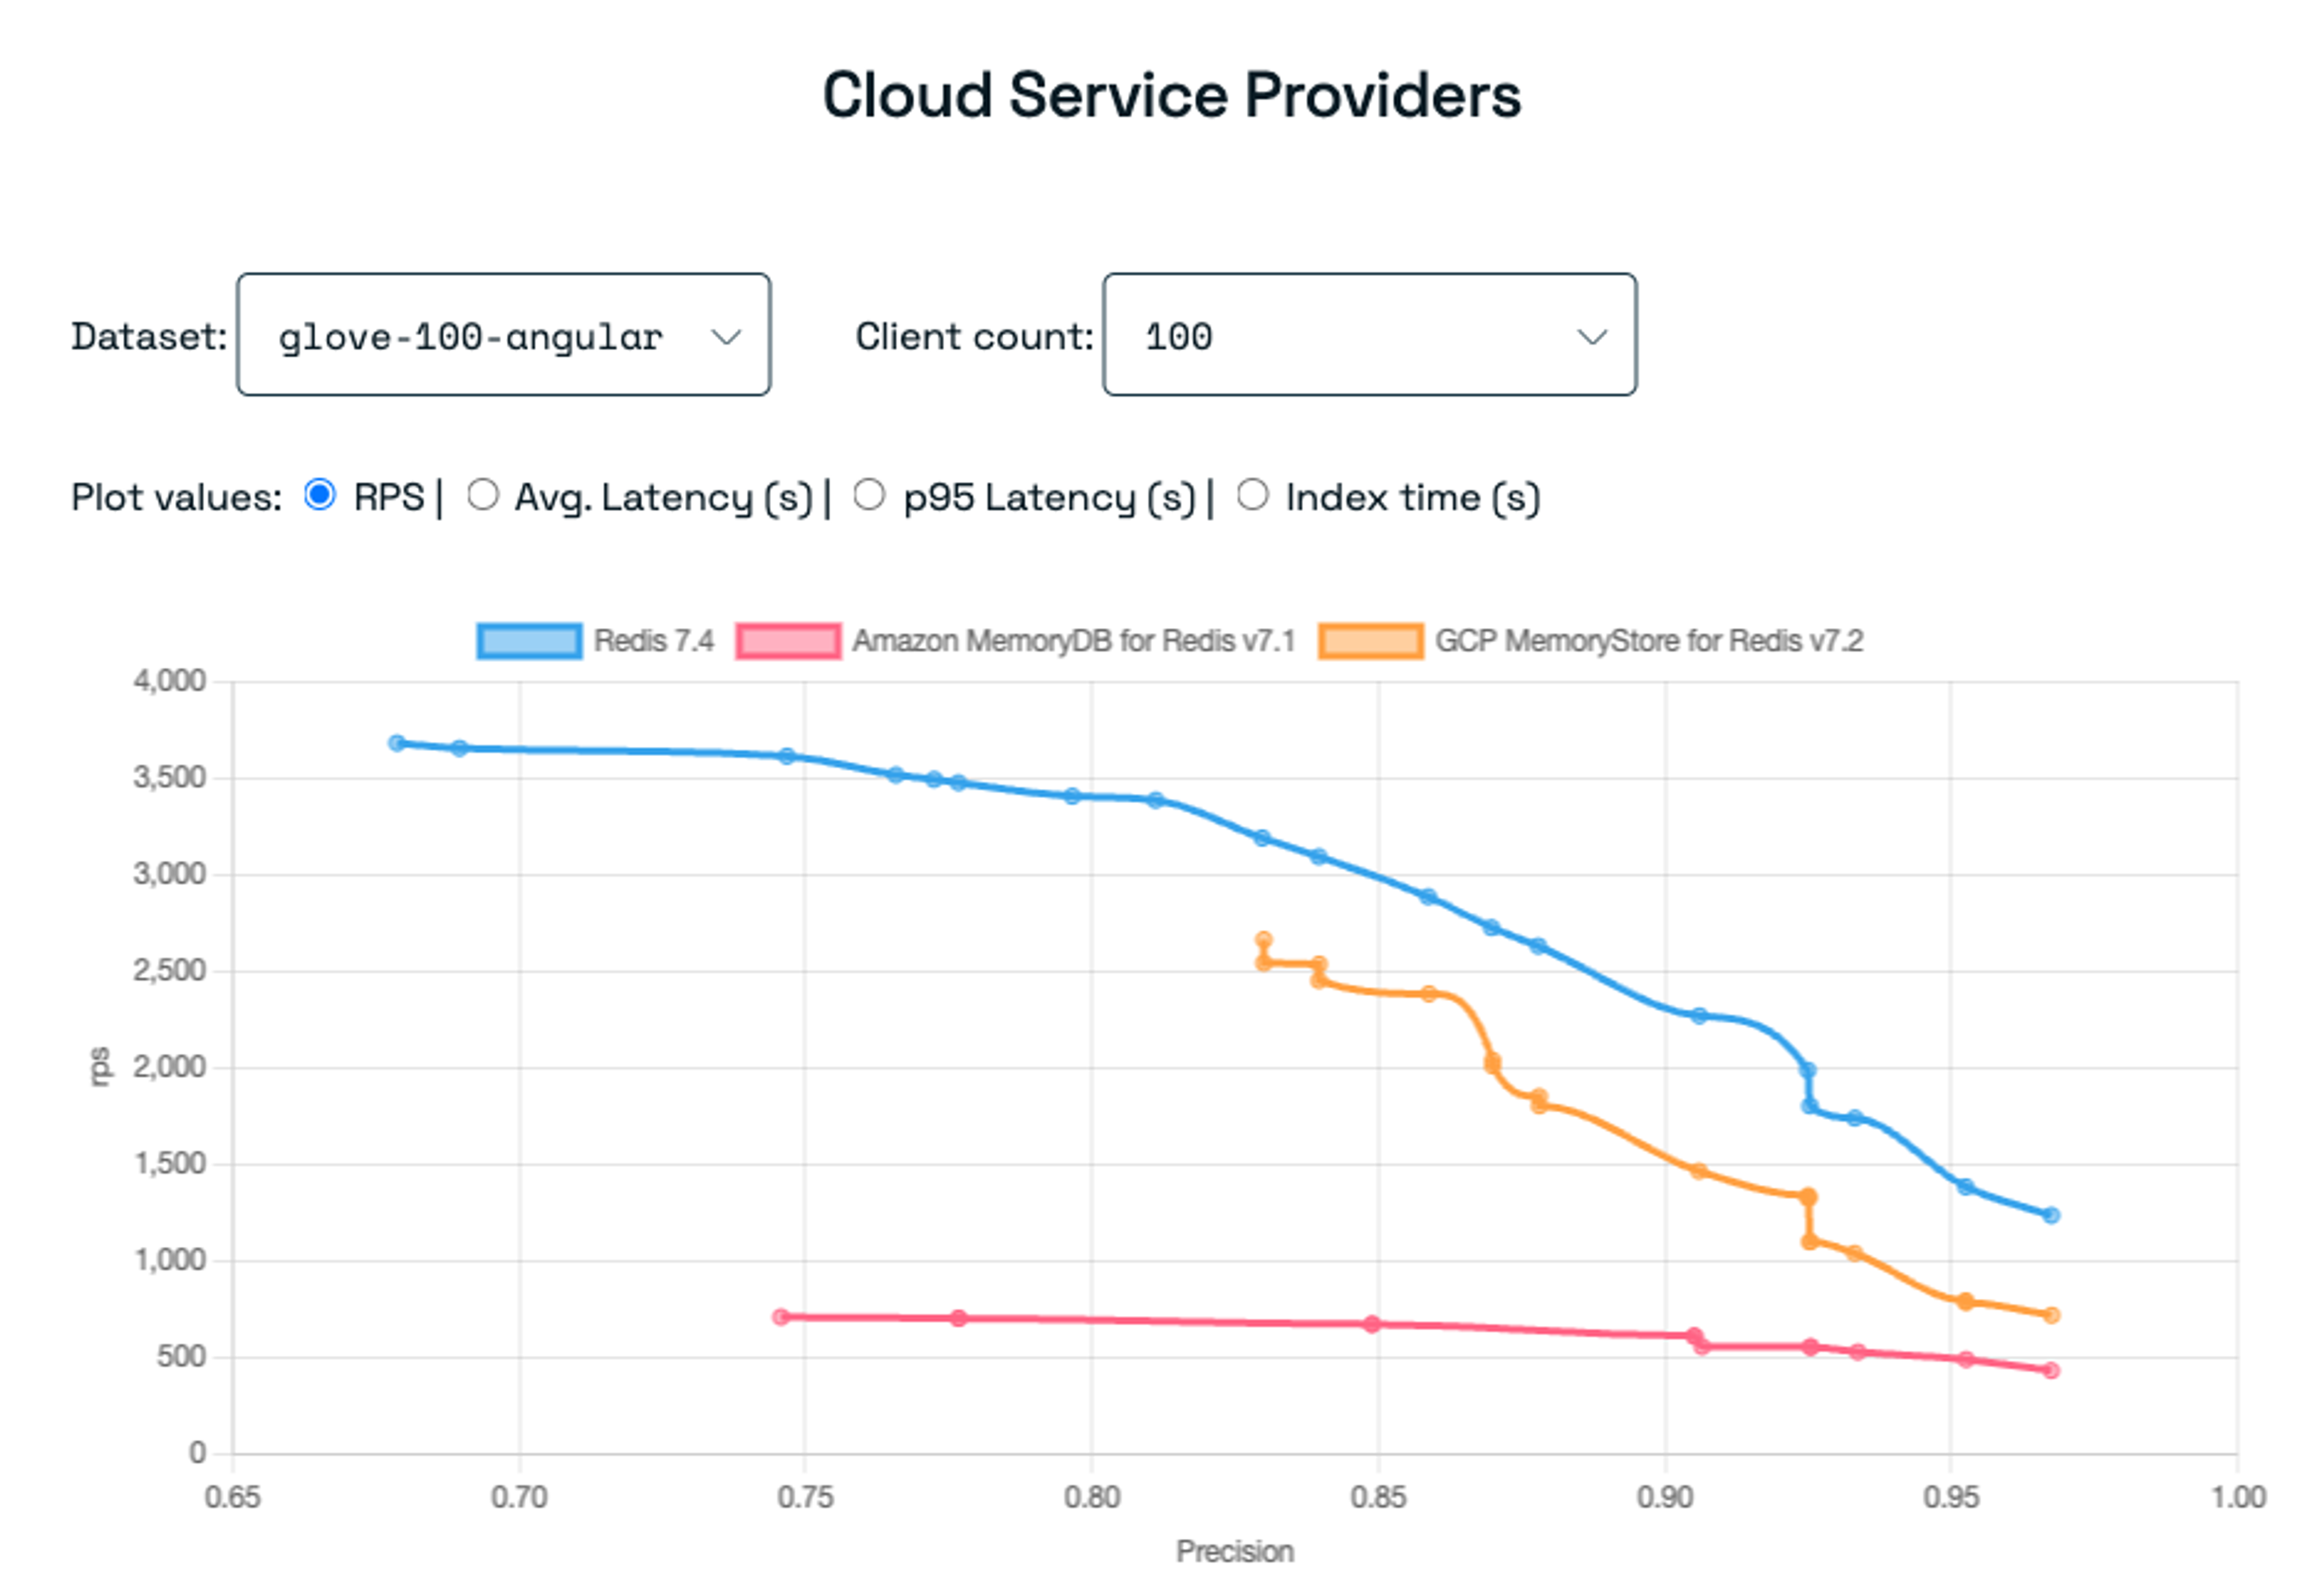
GPU vs CPU Vector Database Performance

Everyone told me GPU acceleration would make everything faster. Spoiler alert: it doesn't, at least not for single queries. The overhead of moving data to the GPU eats up any speed gains unless you're processing hundreds of queries at once.

Single queries on our A100 were actually slower than CPU because of the PCIe transfer time. Only batch queries over... I think it was like 64 or 128? Either way, only big batches showed real improvements. And batch processing doesn't help when users want real-time responses.

NVIDIA's marketing is all "GPU acceleration!" but they don't mention the PCIe tax. Their CUDA docs explain the memory bottlenecks if you can wade through the marketing bullshit.

Memory vs Disk: The 1000x Problem

When your index fits in RAM, queries are fast. When it doesn't, they're slow as fuck. There's no middle ground.

RAM access takes nanoseconds, NVMe SSDs take microseconds - that's a 1000x difference that shows up directly in your query times. Memory-based searches finish in a few milliseconds, disk-based ones can take hundreds of milliseconds.

The Dimensionality Curse

Here's something nobody tells you: high-dimensional vectors are weird. Once you get above 1000 dimensions, all vectors start looking equally similar. The curse of dimensionality isn't just theory - it actually breaks similarity search.

I've seen embeddings where the "closest" match was barely closer than a random vector. OpenAI's 1536-dimensional embeddings are total overkill for most use cases. Reducing to 768 or even 384 dimensions often gives better results with way less computation. Wish I'd known that before we deployed the 1536 version to prod.

Distance Metric Performance Gotchas

Cosine similarity without pre-normalized vectors is a performance killer. If you're computing the magnitude every time, you're doing 3x more work than necessary.

Pre-normalize your vectors during ingestion and cosine similarity becomes as cheap as dot product. This optimization was huge for us - like 40-50% faster queries? Maybe more? Definitely felt stupid for not doing it from the start.

Real Performance Killers

Connection pools: When your pool runs out, queries start queuing. Latency goes to shit even though your CPU and memory look fine. Monitor active connections, not just system resources.

Memory fragmentation: HNSW indexes get slower over time as memory gets fragmented. We had to restart our service every week just to defragment memory and get performance back.

Bad query patterns: Random access patterns destroy cache performance. If your queries are all over the place, you're guaranteed to have cache misses and slow searches.

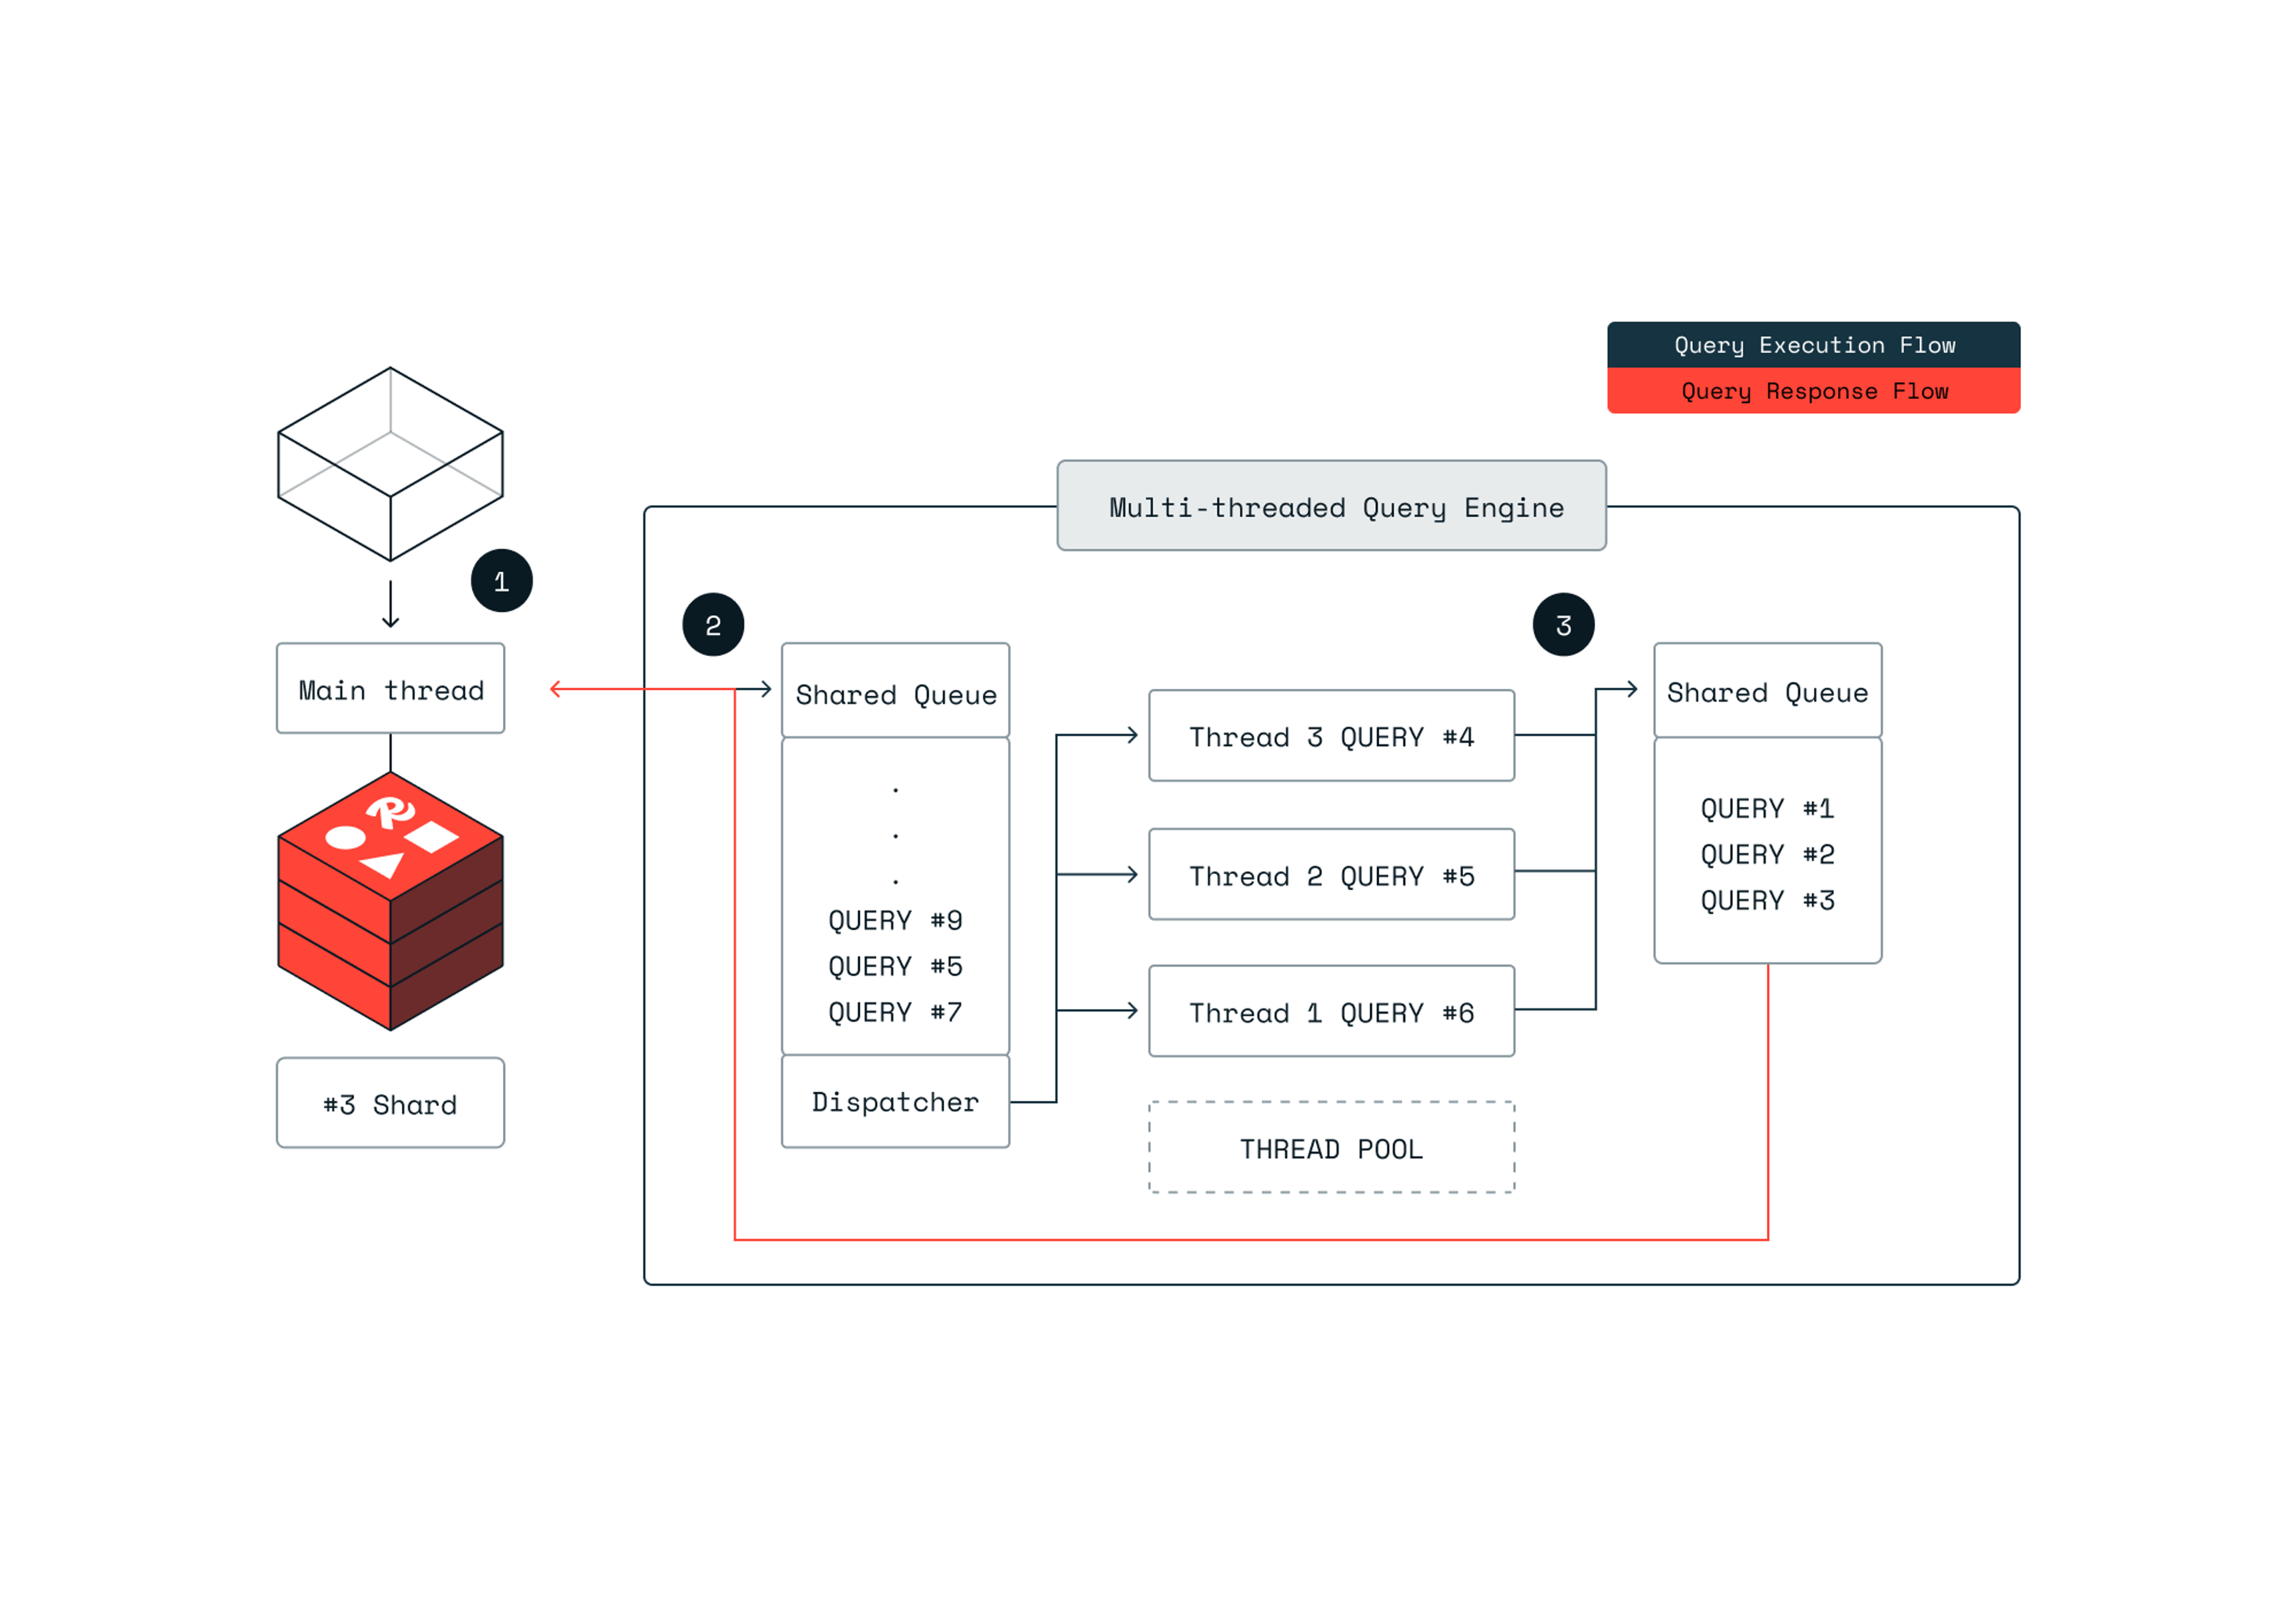
Concurrent queries: Most vector DBs suck at concurrent searches. They'll serialize on some internal data structure and your multi-core machine performs like a single-core potato.

The real lesson? Every optimization comes with tradeoffs, and marketing benchmarks are complete bullshit. Test everything with your actual data or you'll get burned.
What Actually Fixes Vector DB Performance (From Someone Who's Been There)

Forget the textbook approaches. Here's what actually worked when I was debugging vector DB performance at 3am during production outages.

The Nuclear Option (Try This First)

Pre-normalize your fucking vectors. I spent like 2 weeks, maybe more, optimizing HNSW parameters while computing vector magnitudes on every single query like an idiot. Pre-normalizing was huge - cut query time in half, maybe more. Definitely should have done this first.

## Instead of computing cosine similarity the expensive way
## Do this once during ingestion:
normalized_vector = vector / np.linalg.norm(vector)

Check if you're actually using vectorized instructions. Your fancy vector DB might be running scalar operations like it's 1995. I found our Milvus instance wasn't using AVX-512 because of some Docker base image bullshit. Fixed the image, distance calculations went way faster - like 5-6x improvement? Maybe more on certain operations.

Fix your batch sizes or suffer. Single queries are for demos, not production. We went from something like 45-50ms single queries to maybe 4-5ms by batching 32 queries together. GPU acceleration is useless unless you're batching 100+ queries - learned that after buying an expensive A100 that sat there doing jack shit.

Milvus docs have some tuning tips (though half of them are outdated).

Memory: The Performance Destroyer

Performance Profiling Flamegraph Example

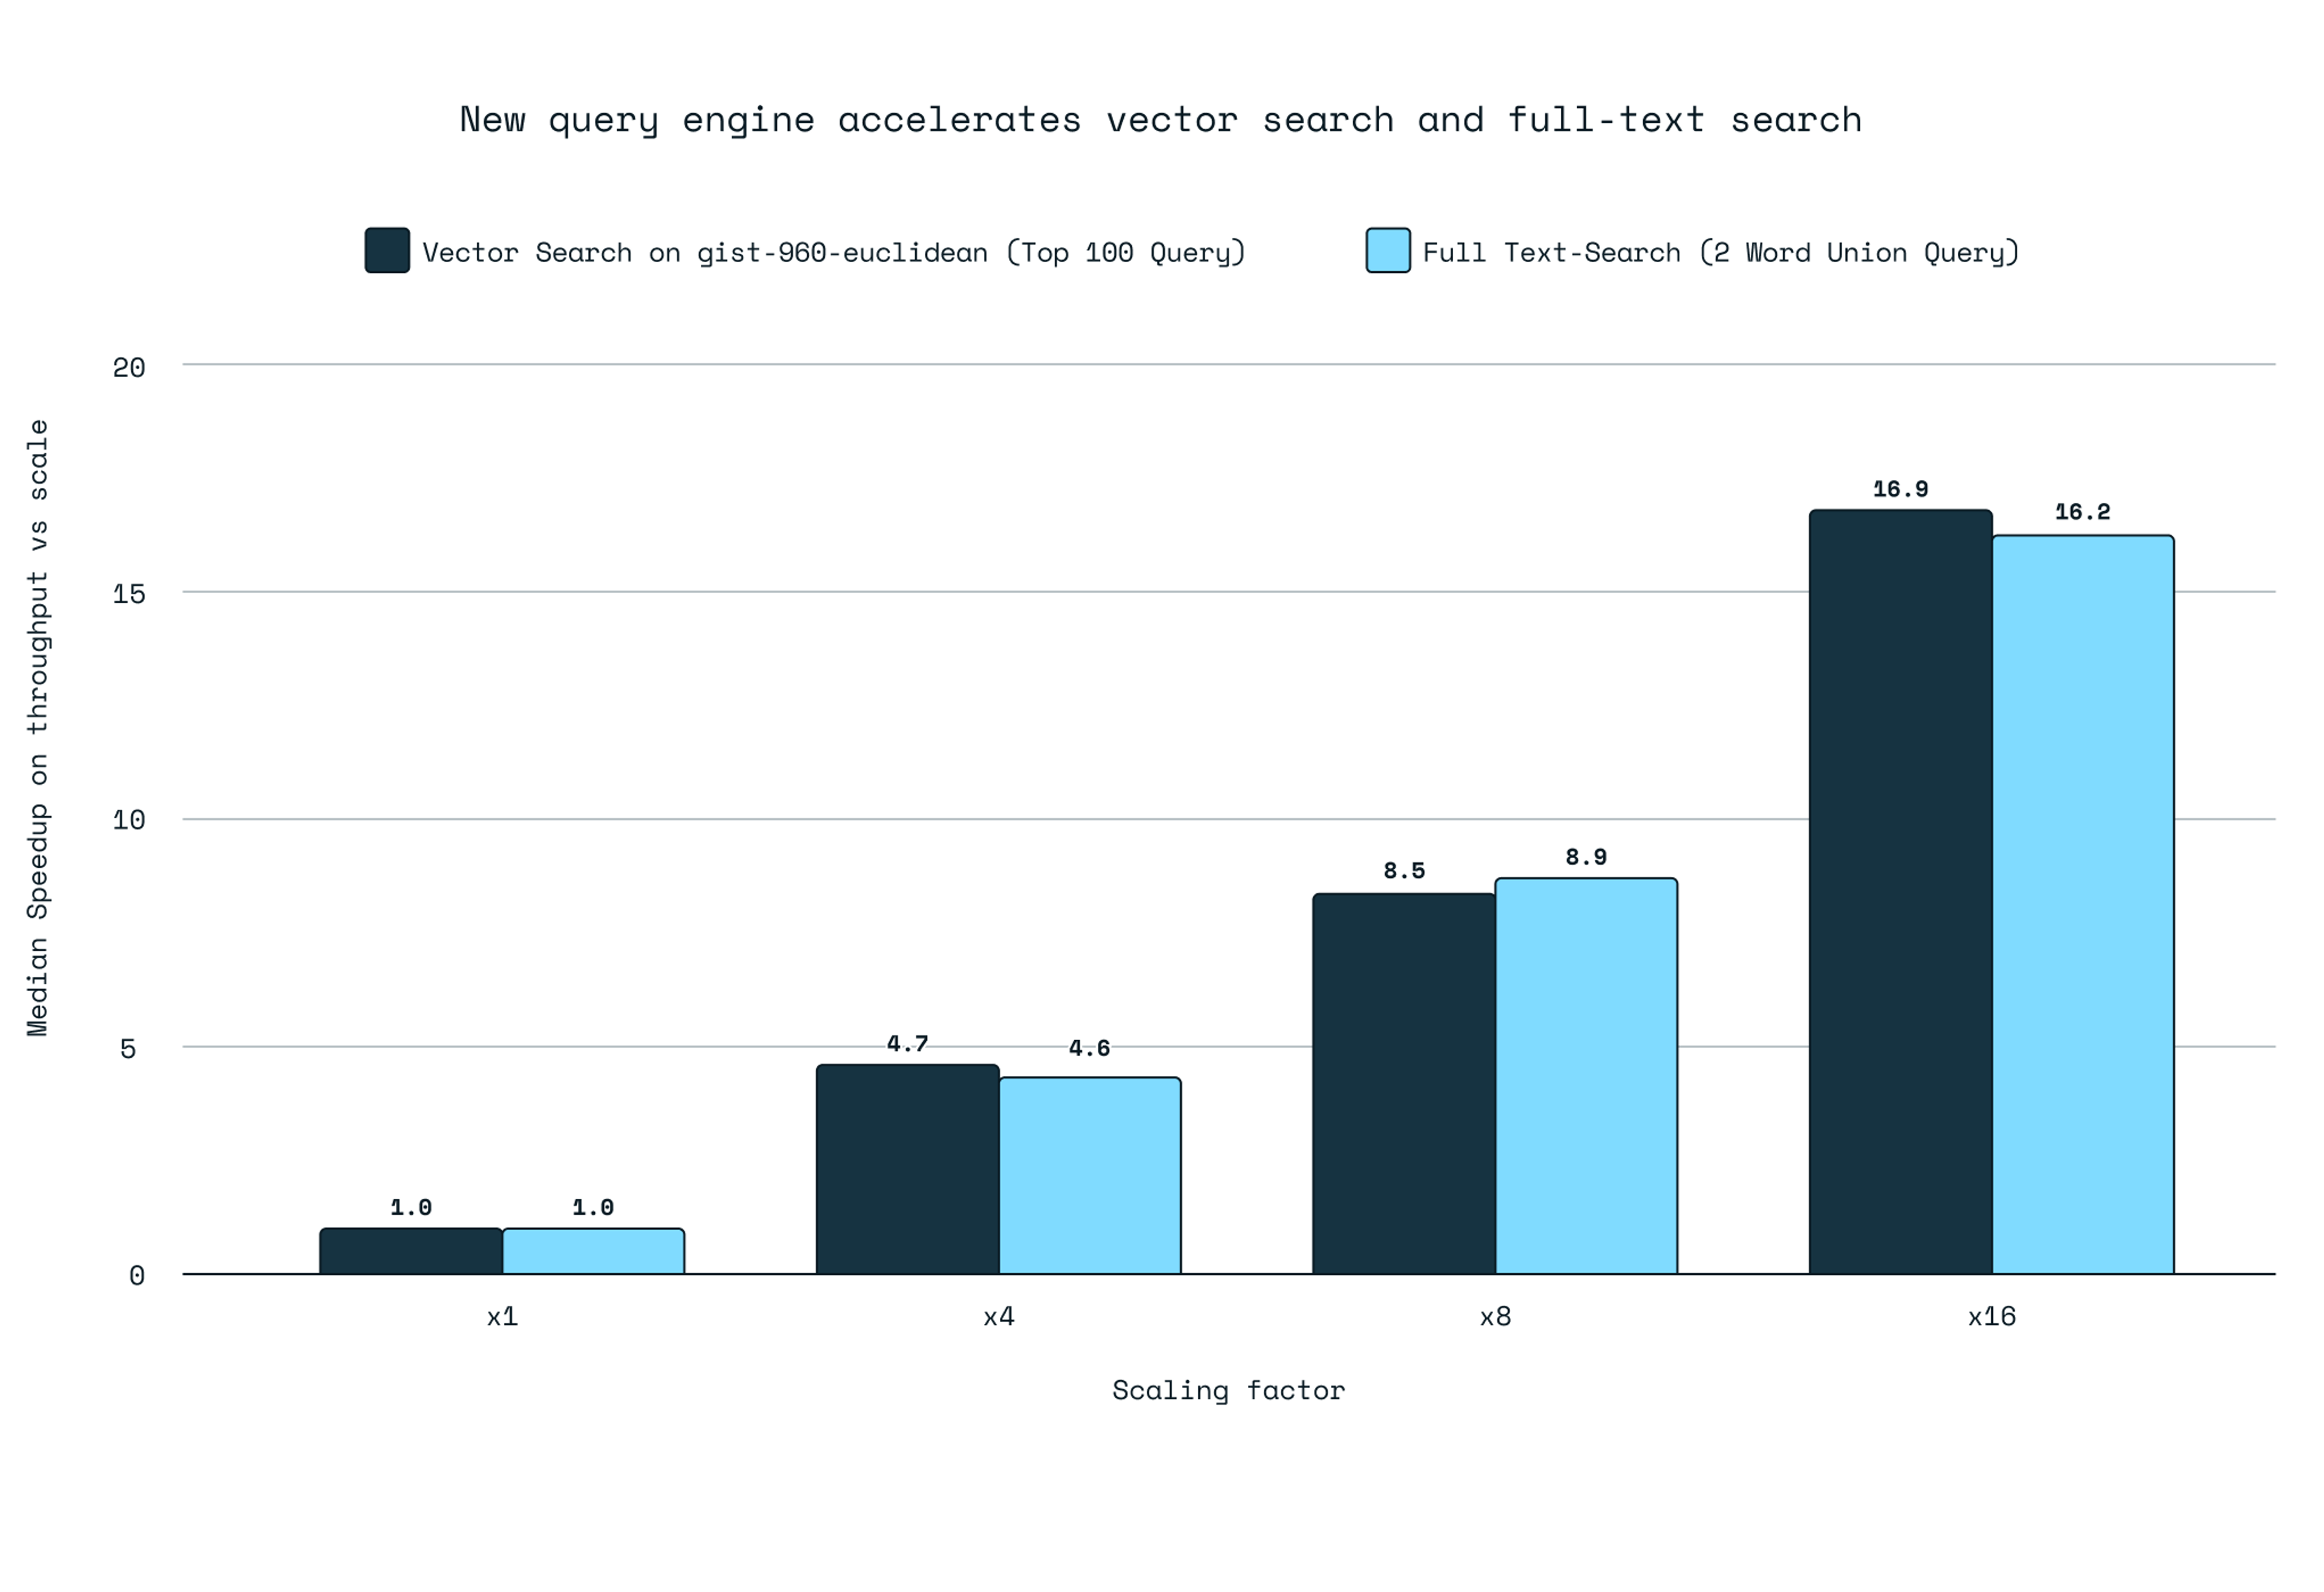
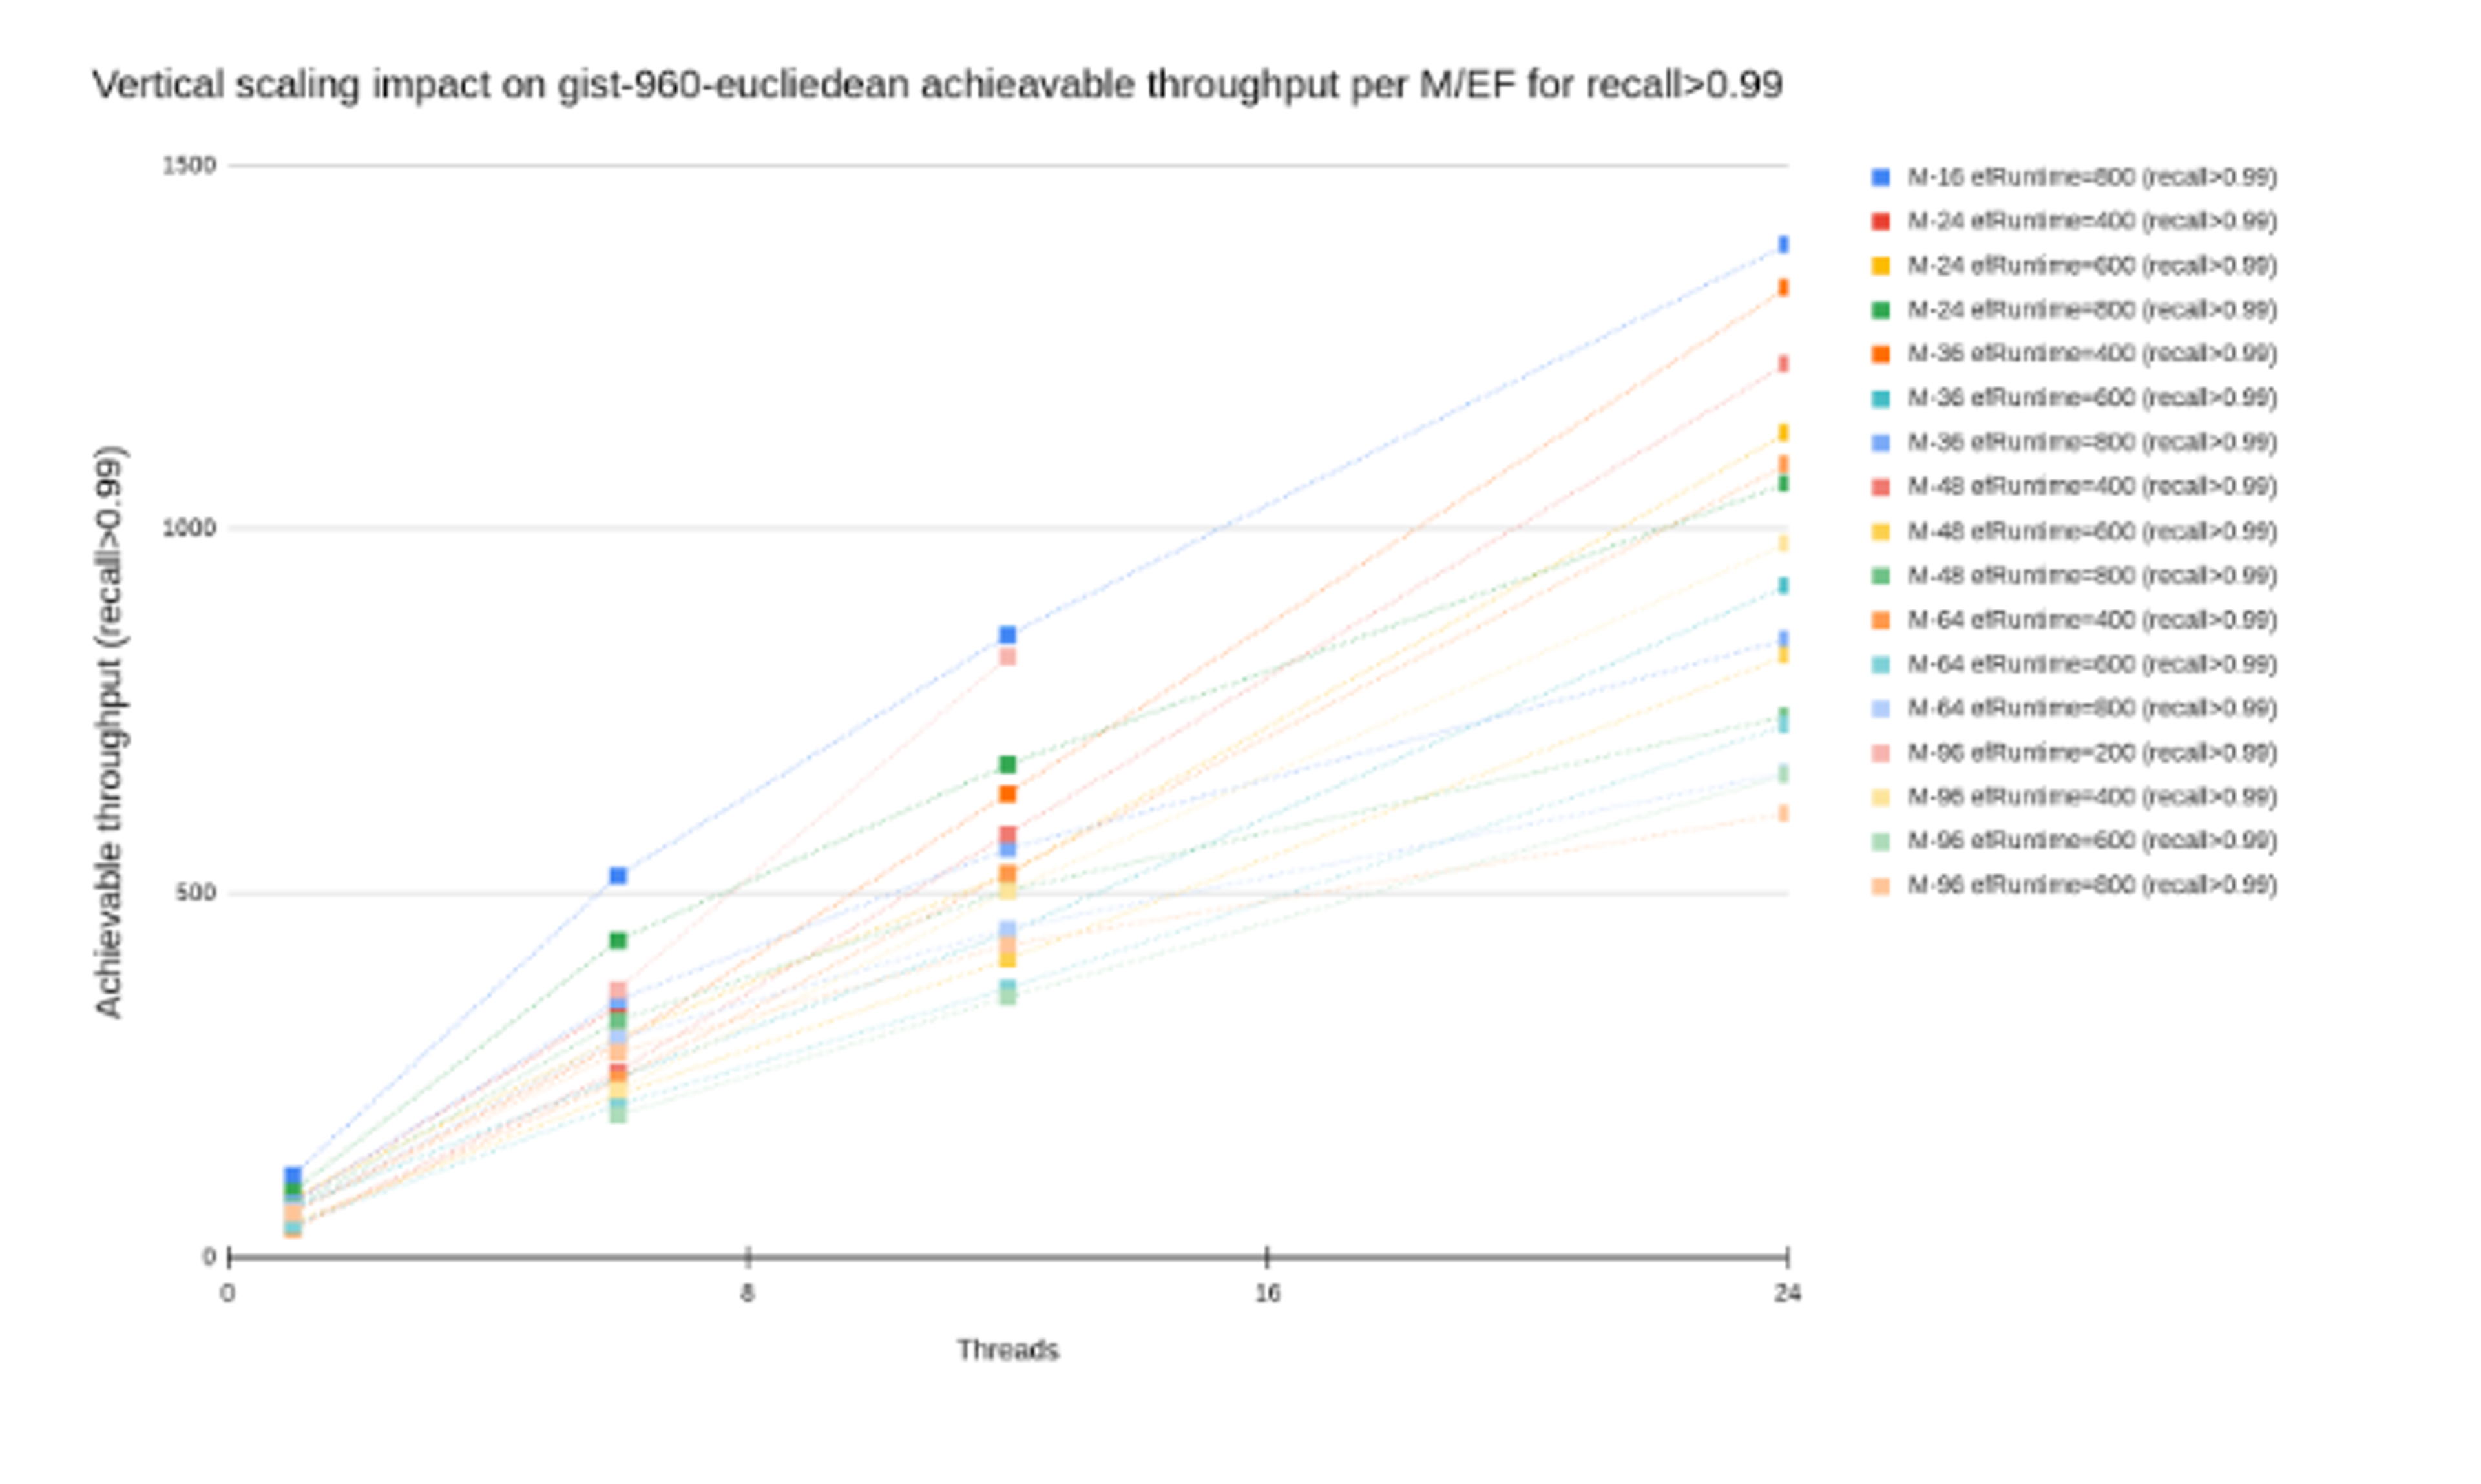
Redis Query Engine Scaling Performance

Rule #1: If it doesn't fit in RAM, it's slow. No exceptions. I've seen like 2-3ms queries become 150-200ms because the index spilled to disk. A million 1536-dimensional vectors needs about 6-7GB of RAM. Plan for 8-9GB because the OS and other processes exist.

## Check if you're swapping (death sentence for performance)
free -h
## If swap usage > 0, you're fucked

HNSW is a memory pig. It promises fast searches but will eat every byte of RAM you give it. We had to restart our service weekly because memory fragmentation made queries progressively slower. Now we just rebuild indexes monthly.

Weaviate's HNSW documentation explains the memory trade-offs well, and this research paper covers the original HNSW algorithm.

Memory fragmentation will kill you slowly. HNSW performance degrades over time as memory gets fragmented. Monitor this:

cat /proc/buddyinfo
## If you see lots of order-0 pages, fragmentation is happening

Index Configuration: Where Theory Meets Reality

HNSW parameters from the documentation are lies. They recommend M=16 and ef_construction=200, but that's for academic datasets. Real text embeddings cluster weirdly and need different settings.

For our chatbot data, M=48 and ef_construction=400 worked better. Used more memory but queries were noticeably faster. Your data will be different anyway.

FAISS guidelines and Qdrant's optimization guide have good parameter recommendations, but nothing beats testing with your actual data.

IVF clustering is black magic. The √N rule for clusters is complete bullshit. Our text embeddings clustered so heavily that most vectors ended up in just a few clusters. Had to use way more clusters just to distribute the load.

## Check cluster balance
cluster_sizes = [len(cluster) for cluster in clusters]
max_size = max(cluster_sizes)
avg_size = sum(cluster_sizes) / len(cluster_sizes)
if max_size > 3 * avg_size:
    # You're fucked, increase cluster count

Product Quantization is a precision/speed tradeoff. Like 90-95% compression sounds great until users complain about garbage search results. Spent a week optimizing PQ only to roll it back because similarity thresholds were completely wrong for compressed vectors.

Production Failures That Taught Me Everything

The Demo Disaster: Live product demo. Queries went from fast to... not fast. Like 25-30 seconds or something ridiculous. Turned out we hit memory limits and Linux was swapping. Super awkward. Still think about it when I can't sleep.

The Connection Pool Death Spiral: Our API was fast until it wasn't. Under load, connection pools would exhaust and queries would queue. Latency spiked to like 4-5+ seconds even though CPU and memory looked fine. Doubled the connection pool size, problem solved.

The 3AM Milvus Meltdown: Got woken up because search was completely fucked. Milvus kept dying every 20-30 minutes or so. Took me way too long to realize someone had enabled debug logging and the logs were eating all our disk space. Felt pretty fucking stupid about that one.

The GPU That Didn't: Convinced my manager we needed an A100. Expensive as hell. Single queries were actually slower because of PCIe overhead. Only helped with big batches. Had to explain that to finance.

System-Level Stuff That Actually Matters

Vector Database Scaling Architecture

Check for AVX-SSE transition penalties. This is subtle but real:

perf stat -e assists.sse_avx_mix your_vector_db
## Non-zero count = performance loss

Intel's optimization guide covers AVX-512 best practices, and this Stack Overflow thread explains transition penalties.

Memory mapping limits will bite you:

## Check current limits
cat /proc/sys/vm/max_map_count
## If you have large datasets, increase it:
echo 262144 > /proc/sys/vm/max_map_count

NUMA topology matters on big servers:

numactl --hardware
## Bind your process to one NUMA node:
numactl --cpunodebind=0 --membind=0 your_vector_db

Ubuntu numactl documentation has good NUMA tuning advice for most systems.

The Monitoring That Actually Helps

Forget fancy dashboards. Here's what you need to watch:

Load latency: Should be under 30 seconds for a million vectors. If it's not, something's broken.

P95 query latency: Averages lie. P95 should be under 20ms. P99 under 100ms.

Memory pressure: dmesg | grep -i memory will show OOM kills.

Connection pool utilization: If you're hitting limits, you'll see queue buildup.

Quick Fixes That Work

  1. Pre-normalize vectors - massive speedup, 5 minutes of work
  2. Check AVX instructions - huge speedup if you're missing them
  3. Increase connection pools - fixes most latency spikes under load
  4. Monitor swap usage - prevents performance cliffs
  5. Batch your queries - massive improvement for read-heavy workloads

The real truth? Most performance problems are stupid configuration issues, not algorithmic ones. Check the basics before you start optimizing index parameters.

The Monitoring That Could Have Saved My Ass (And Your Career)

Monitoring vector databases is like watching a nuclear reactor - everything looks fine until it explodes. I've been paged at 3am enough times to know what actually matters versus the fancy dashboards that tell you nothing.

The Alerts That Actually Matter

Load latency spiking = imminent death. Our baseline was something like 28-30 seconds to load a million vectors. When it hit like 90-120 seconds, I knew something was fucked. Turned out memory fragmentation was getting so bad that allocation was taking forever. No fancy metric told me this - just load times getting longer.

## What I actually monitor now:
time vector_db_load large_dataset.bin
## If this takes >2x baseline, you're in trouble

Query latency distribution, not averages. P95 latency tells the real story. Averages lie like politicians. Our P50 was maybe 4-5ms but P95 was like 180-200ms - users were having a terrible experience while our dashboards looked green.

## The percentile check that matters:
## P95 should be <20ms, P99 <100ms
## If not, you've got problems

Memory pressure alerts saved my job. Set up alerts when swap usage >0. No exceptions. Swapping is a death sentence for vector search performance. I learned this during a demo where queries went from milliseconds to minutes because we hit swap.

## The swap check that prevents disasters:
free -h | grep Swap
## If used > 0, fix immediately

The Debugging Tools That Actually Work

Linux perf is your friend when shit hits the fan. During our worst outage, top and htop showed nothing useful. perf revealed we were spending most of our time in memory allocation because of fragmentation.

Brendan Gregg's perf guide is pretty much the only resource worth reading for this stuff.

## The debugging command that saved me:
perf record -g ./vector_db_process
perf report
## Look for unexpected malloc/free calls

Check for the AVX penalty that nobody talks about. Spent 2 days wondering why our optimized build was slower than the old one. Turns out we had AVX-SSE transition penalties killing performance.

## The penalty detector:
perf stat -e assists.sse_avx_mix your_process
## Any non-zero count = you're losing performance

Connection pool monitoring prevents the death spiral. Our API was fast until traffic spiked, then everything went to shit. Connection pools would exhaust and queries would serialize. CPU and memory looked fine - it was the connection queue that was fucked.

## The connection health check:
netstat -an | grep :6379 | grep TIME_WAIT | wc -l
## High count = connection pool problems

Vector Database Horror Stories

System Performance Monitoring Tools

The Gradual Index Death: HNSW indexes get slower over time and you won't notice until it's too late. Our search went from 5ms to 50ms over 6 months. No alerts fired because it was gradual. Now I watch hop count during traversal - when it starts climbing, your graph structure is degrading.

The Cluster Imbalance Disaster: IVF clustering worked great initially, then performance went to shit. Most vectors ended up in just a few clusters because our data distribution changed. Should have seen that coming.

## The cluster balance check I should have been doing:
cluster_sizes = [len(cluster) for cluster in clusters]
max_size = max(cluster_sizes)
avg_size = sum(cluster_sizes) / len(cluster_sizes)
imbalance_ratio = max_size / avg_size
if imbalance_ratio > 3:
    print("Your clustering is fucked")

The Memory Fragmentation Creep: Our HNSW performance kept getting worse week by week. Maybe 5-10% degradation? Hard to pin down exactly - it was gradual as hell. Restart fixed it temporarily. Memory was available but fragmented to hell. Started monitoring /proc/buddyinfo after that.

Linux kernel memory management docs explain fragmentation in detail.

The GPU That Lied: Bought an A100 thinking it would solve our performance problems. Single queries were like 1.5-2x slower because of PCIe overhead. Only batches over 64 or maybe 128 showed improvement. Expensive lesson in hardware marketing bullshit.

The Metrics That Predict Disasters

Memory allocation patterns: Excessive malloc/free calls mean something's wrong. Profile with perf and look for allocation hot spots.

Cache miss rates: High L3 cache misses mean your index traversal is jumping around memory randomly. Probably above 10% if things are bad.

Intel has some cache optimization guides that might help with data locality.

Connection establishment time: Should be <1ms. If it's growing, your database is struggling or network is fucked.

Query result variance: If similar queries return different latencies, your index quality is degrading.

Real-World Monitoring Setup

The alerts that wake me up:

  1. P95 latency >50ms (something's seriously wrong)
  2. Load latency >2x baseline (index corruption or fragmentation)
  3. Swap usage >0 (performance death sentence)
  4. Connection pool utilization >80% (death spiral incoming)
  5. Memory allocation rate getting crazy high (fragmentation building)

Grafana and Prometheus docs cover alert setup if you want to suffer through their configuration hell.

The dashboard that matters:

  • Query latency percentiles (not averages)
  • Memory fragmentation metrics
  • Connection pool health
  • Index quality indicators (hop count for HNSW, cluster balance for IVF)

The tools I actually use:

## Quick performance check
perf stat -e cycles,instructions,cache-misses,cache-references ./your_db

## Memory pressure check  
cat /proc/pressure/memory

## Connection pool health
ss -s

## Index quality (HNSW hop count if available)
echo "HNSW_STATS" | nc localhost 6379

The Monitoring That Failed Me

CPU and memory utilization: Useless for vector databases. Everything can look fine while performance is shit.

Average latency: Hides the fact that 5% of your users are having a terrible experience.

Generic database metrics: Vector databases are different. Transaction rates and lock waits don't matter.

Synthetic benchmarks: They don't reflect real query patterns. Real users don't search for uniformly distributed random vectors.

The Incident Response That Works

Performance Debugging Tools

When shit hits the fan:

  1. Check swap usage first (restart if >0)
  2. Look at P95 latency trends (gradual increase = index degradation)
  3. Check connection pool utilization (quick fix = increase pool size)
  4. Profile with perf if nothing else works
  5. Nuclear option = rebuild indexes

The rollback plan:
Always have a way to quickly fall back to brute force search. It's slow but it works. Better than having broken search during an incident.

The real lesson? Monitor the things that predict failures, not the things that look pretty on dashboards. And always have a plan for when your fancy optimizations break production.

Questions Real Confused Engineers Actually Ask

Q

WTF happened to my queries? They were fine yesterday and now everything is slow

A

Probably index degradation. HNSW indexes get worse over time as the graph structure breaks down. Memory fragmentation might be happening too.

Restart the service first - I know it's stupid but it often fixes shit temporarily. If performance comes back, you need to rebuild indexes more often.

Q

CPU is maxed out but throughput sucks. Why?

A

Probably not using vectorized instructions. Check with perf stat -e assists.sse_avx_mix. If you see counts, you've got AVX-SSE transition penalties.

Also check cache miss rates - high L3 misses mean your memory access is all over the place.

Q

Should I buy a GPU for this? Everyone keeps saying it'll be faster

A

For single queries? Don't bother. GPU only helps with big batches. Single queries are actually slower because of PCIe overhead.

I bought an A100 and learned this the expensive way. Had to explain to my manager why our $10k GPU made things slower. That was fucking awkward.

Q

How do I know if my HNSW parameters are actually good or just cargo cult bullshit?

A

Test recall vs latency systematically. Start with ef_search=100 and bump it up until recall stops improving. Track P95 latency (not averages - averages lie).

The defaults in most docs are for academic datasets, not real data. Our chatbot embeddings needed M=48 instead of M=16 to work properly.

Q

Calculated memory needs but still running out of RAM. Did I screw up somewhere?

A

Yeah, everyone screws this up initially. HNSW needs overhead for graph structures. Your OS needs memory too. Plan for like 1.5-2x what you think you need.

Check if you're swapping with free -h. Any swap usage and you're fucked.

Q

I optimized for speed and now my search results are garbage. How do I fix this?

A

You probably got too aggressive with compression or lowered ef_search too much. Product quantization compression artifacts will screw up similarity thresholds.

Monitor recall@10 - if it's below like 85-90%, your optimizations broke accuracy. Roll back and find a better speed/accuracy balance.

Q

My chunking strategy sucks but I don't know how to fix it. Help?

A

Smaller chunks = more vectors to search but better precision. Larger chunks = fewer vectors but you lose context.

Track your actual query success rates, not theoretical metrics. If users can't find what they're looking for, your chunking is wrong regardless of what the benchmarks say.

Q

My index loads fast but queries are still slow. What the fuck?

A

You prioritized build speed over query speed. Low ef_construction in HNSW creates a shitty graph that's fast to build but slow to traverse.

Rebuild with higher ef_construction. Yes, it takes longer to build, but your queries will be faster.

Q

Is pre-normalizing vectors worth it or just premature optimization?

A

Pre-normalize if you're using cosine similarity. It's like a 40-60% speedup for almost no work.

If you're not pre-normalizing cosine similarity vectors, you're doing way more work than necessary.

Q

Why does this work great on my laptop but like shit in production?

A

Different data distributions, different hardware, different query patterns. Your laptop test data is probably uniformly distributed while production data clusters in fucked up ways.

Test with actual production data, not synthetic benchmarks. I've seen optimizations that worked great locally but completely tanked in production.

Q

My connection pool keeps getting exhausted even though my server isn't busy. What's wrong?

A

Connection pool too small or connections are leaking. Monitor active connections with netstat or ss. Under load, if pools exhaust, queries serialize and latency goes to shit even though CPU looks fine.

Double your pool size and see if that fixes it. If not, you've got connection leaks somewhere.

Q

My disk-based index is way slower than the benchmarks claim. Am I doing something wrong?

A

Probably using tiny page sizes (4KB) instead of 64KB. Also check if you're doing random I/O patterns - they'll kill NVMe performance.

Keep index upper layers in RAM and only put vector data on disk. If everything's on disk, performance will be absolute garbage.

Q

I have 32 cores but my vector DB doesn't use them. Is it broken?

A

Most vector search algorithms don't parallelize well. HNSW traversal is sequential by design. IVF can parallelize somewhat but you'll hit contention on shared data structures.

Focus on single-threaded optimization first. Adding more cores won't fix algorithmic bottlenecks.

Q

At what point do I just nuke the indexes and start over?

A

When performance tanks without adding data. Or when hop count keeps climbing. Or when clusters get super imbalanced.

Sometimes tuning won't fix it. Just rebuild and move on.

Related Tools & Recommendations

compare
Recommended

Milvus vs Weaviate vs Pinecone vs Qdrant vs Chroma: What Actually Works in Production

I've deployed all five. Here's what breaks at 2AM.

Milvus
/compare/milvus/weaviate/pinecone/qdrant/chroma/production-performance-reality
100%
integration
Recommended

GitOps Integration Hell: Docker + Kubernetes + ArgoCD + Prometheus

How to Wire Together the Modern DevOps Stack Without Losing Your Sanity

kubernetes
/integration/docker-kubernetes-argocd-prometheus/gitops-workflow-integration
54%
integration
Recommended

Pinecone Production Reality: What I Learned After $3200 in Surprise Bills

Six months of debugging RAG systems in production so you don't have to make the same expensive mistakes I did

Vector Database Systems
/integration/vector-database-langchain-pinecone-production-architecture/pinecone-production-deployment
53%
integration
Recommended

Claude + LangChain + Pinecone RAG: What Actually Works in Production

The only RAG stack I haven't had to tear down and rebuild after 6 months

Claude
/integration/claude-langchain-pinecone-rag/production-rag-architecture
53%
integration
Recommended

Making LangChain, LlamaIndex, and CrewAI Work Together Without Losing Your Mind

A Real Developer's Guide to Multi-Framework Integration Hell

LangChain
/integration/langchain-llamaindex-crewai/multi-agent-integration-architecture
52%
compare
Recommended

I Deployed All Four Vector Databases in Production. Here's What Actually Works.

What actually works when you're debugging vector databases at 3AM and your CEO is asking why search is down

Weaviate
/compare/weaviate/pinecone/qdrant/chroma/enterprise-selection-guide
33%
tool
Recommended

Milvus - Vector Database That Actually Works

For when FAISS crashes and PostgreSQL pgvector isn't fast enough

Milvus
/tool/milvus/overview
32%
news
Recommended

OpenAI Gets Sued After GPT-5 Convinced Kid to Kill Himself

Parents want $50M because ChatGPT spent hours coaching their son through suicide methods

Technology News Aggregation
/news/2025-08-26/openai-gpt5-safety-lawsuit
30%
alternatives
Recommended

Docker Alternatives That Won't Break Your Budget

Docker got expensive as hell. Here's how to escape without breaking everything.

Docker
/alternatives/docker/budget-friendly-alternatives
29%
compare
Recommended

I Tested 5 Container Security Scanners in CI/CD - Here's What Actually Works

Trivy, Docker Scout, Snyk Container, Grype, and Clair - which one won't make you want to quit DevOps

docker
/compare/docker-security/cicd-integration/docker-security-cicd-integration
29%
integration
Recommended

Kafka + MongoDB + Kubernetes + Prometheus Integration - When Event Streams Break

When your event-driven services die and you're staring at green dashboards while everything burns, you need real observability - not the vendor promises that go

Apache Kafka
/integration/kafka-mongodb-kubernetes-prometheus-event-driven/complete-observability-architecture
29%
tool
Recommended

FAISS - Meta's Vector Search Library That Doesn't Suck

competes with FAISS

FAISS
/tool/faiss/overview
27%
integration
Recommended

Qdrant + LangChain Production Setup That Actually Works

Stop wasting money on Pinecone - here's how to deploy Qdrant without losing your sanity

Vector Database Systems (Pinecone/Weaviate/Chroma)
/integration/vector-database-langchain-production/qdrant-langchain-production-architecture
23%
tool
Recommended

LlamaIndex - Document Q&A That Doesn't Suck

Build search over your docs without the usual embedding hell

LlamaIndex
/tool/llamaindex/overview
23%
howto
Recommended

I Migrated Our RAG System from LangChain to LlamaIndex

Here's What Actually Worked (And What Completely Broke)

LangChain
/howto/migrate-langchain-to-llamaindex/complete-migration-guide
23%
tool
Recommended

ChromaDB Troubleshooting: When Things Break

Real fixes for the errors that make you question your career choices

ChromaDB
/tool/chromadb/fixing-chromadb-errors
22%
tool
Recommended

ChromaDB - The Vector DB I Actually Use

Zero-config local development, production-ready scaling

ChromaDB
/tool/chromadb/overview
22%
integration
Recommended

RAG on Kubernetes: Why You Probably Don't Need It (But If You Do, Here's How)

Running RAG Systems on K8s Will Make You Hate Your Life, But Sometimes You Don't Have a Choice

Vector Databases
/integration/vector-database-rag-production-deployment/kubernetes-orchestration
22%
news
Recommended

OpenAI Launches Developer Mode with Custom Connectors - September 10, 2025

ChatGPT gains write actions and custom tool integration as OpenAI adopts Anthropic's MCP protocol

Redis
/news/2025-09-10/openai-developer-mode
21%
news
Recommended

OpenAI Finally Admits Their Product Development is Amateur Hour

$1.1B for Statsig Because ChatGPT's Interface Still Sucks After Two Years

openai
/news/2025-09-04/openai-statsig-acquisition
21%

Recommendations combine user behavior, content similarity, research intelligence, and SEO optimization