Most teams are flying blind with their microservices. You've got Prometheus scraping metrics, Jaeger collecting traces, and Grafana showing pretty charts — but when everything goes to hell, you're still clicking between fifteen different tabs trying to figure out what broke.
Spent 4 hours last month debugging an API that suddenly started taking forever. CPU was spiking, database looked fine, but couldn't connect the dots. Turns out a poorly indexed query was choking the whole system, but it took way too long to figure that out because metrics and traces weren't talking to each other. Our monitoring shit the bed during a flash sale, we lost a bunch of revenue, and found out from angry tweets. This integration fixes that clusterfuck.

Why Microservices Monitoring Is A Nightmare
Remember when you had one big app on one server? CPU goes up, you check the slow queries, problem solved. Those days are dead.
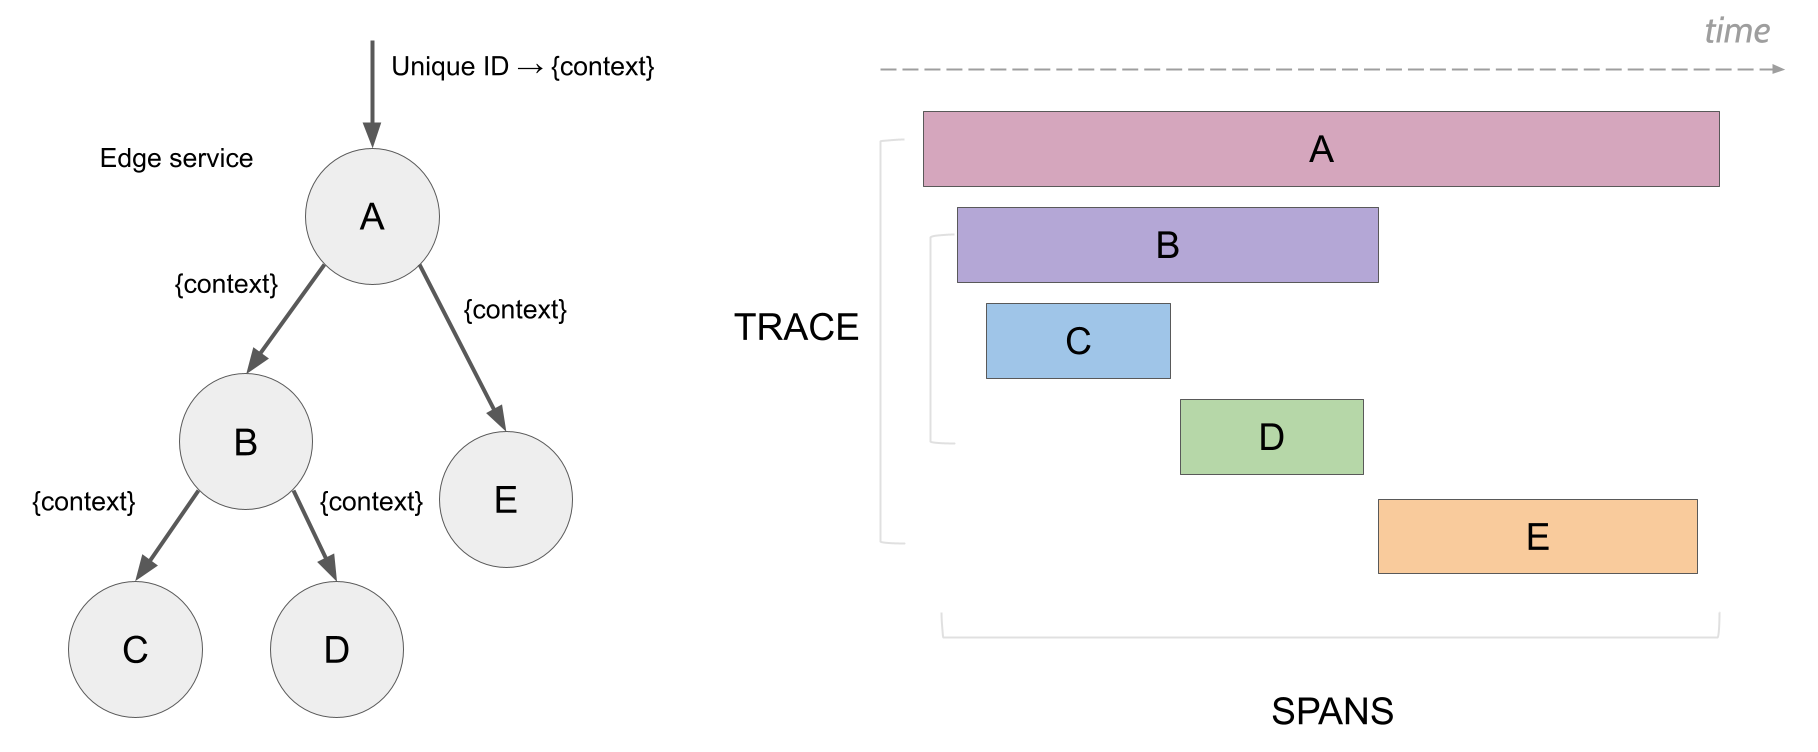
Now your "simple" login request bounces through 12 different services running on who-knows-how-many containers. When everything goes to hell, you're stuck asking:
- Which fucking service is the bottleneck?
- What specific code path decided to shit the bed?
- How many other services are now choking because of this?
- When did this dumpster fire actually start?
Netflix processes 2+ trillion spans daily (yeah, trillion with a T) just to keep their platform working. Uber traces billions of requests because they learned the hard way that debugging ride requests across thousands of services is impossible without it. They didn't build this for fun — they built it because distributed systems will drive you insane without proper tracing.
What Each Tool Actually Does (When It's Not Broken)
Prometheus is the least painful way to collect metrics. It pulls data from /metrics endpoints every 15 seconds and stores the numbers in a way that doesn't make you want to quit programming. PromQL (the query language) sucks at first but gets tolerable once you memorize the 12 functions that actually matter.
Jaeger tracks requests as they bounce around your microservices disaster. The v2 release actually doesn't suck — they rebuilt it on OpenTelemetry so it stops fighting with every other tool in your stack.
Grafana makes pretty pictures from your ugly data. More importantly, recent versions let you click from "this trace is slow as shit" directly to "here's why your database is crying." That click-through is the only reason this whole integration is worth the pain.
How to Actually Make This Shit Work Together
The only way this setup doesn't waste your time is if the tools actually talk to each other. Shopify figured this out when they were hunting down performance issues, and Airbnb uses similar patterns to keep their platform from falling over:
1. Application Instrumentation Layer
- Applications expose Prometheus metrics via
/metricsendpoints - The same applications generate distributed traces using OpenTelemetry SDKs
- Traces include trace IDs that can be correlated with metric labels
2. Collection and Storage Layer
- Prometheus scrapes metrics and stores them in its time-series database
- Jaeger collects traces via OTLP (OpenTelemetry Protocol) and stores them in Elasticsearch, Cassandra, or ClickHouse
- Both systems retain data based on business requirements (typically 7-30 days for traces, 6+ months for metrics)
3. Correlation and Visualization Layer
- Grafana connects to both Prometheus and Jaeger as data sources
- Dashboards show metrics with embedded trace queries
- Alert rules can trigger on metrics and include trace context in notifications
4. Unified Query Interface
- PromQL for metric aggregation and analysis
- TraceQL for trace filtering and searching
- LogQL if using Loki for logs (optional but recommended)
Why Not Just Pay DataDog $50K/Month?
Look, DataDog works great until you get the bill. They start at $15/host and then bend you over with usage charges. New Relic does the same shit but charges per GB ingested. I've seen companies get $80K monthly bills because someone left debug logging on.
This open-source stack costs you time and sanity upfront, but:
- You own your fucking data — no vendor can hold it hostage
- No artificial limits on what you can measure
- Keep data as long as you want without bankruptcy
- Actually understand how your monitoring works (helpful when it breaks during holiday weekend deployments)
Grafana's trace-to-metrics correlation lets you click from a slow trace directly to the related metric spikes, saving hours of detective work during outages.
Why This Actually Saves Your Ass During Outages
Here's where this integration pays for itself: when your API shits the bed during the company all-hands, Grafana's alerting doesn't just scream "SOMETHING IS BROKEN." It gives you:
- Metric context: "Response times went to shit - like 200ms jumped to over a second"
- Trace samples: Links to the exact slow requests causing the problem
- Timeline: "Started about 15 minutes ago, looks like it's hitting a bunch of users"
Instead of spending an hour playing detective, you click one link and see the database query that's choking. Google's SRE people figured this out years ago — alerts that tell you what to fix, not just that something is fucked.
Don't Be a Hero - Plan For Scale From Day One
This stack scales if you're not an idiot about it. Here's the math you need:
Memory Requirements (Don't Ignore These):
- Prometheus: 2GB RAM per million active series (yes, million)
- Jaeger: 500MB RAM per collector (deploy more collectors, not bigger ones)
- Grafana: 512MB for basic dashboards, 2GB+ if someone went nuts with queries
Storage Reality Check:
- Traces are 10-100x fatter than metrics
- Use sampling or go bankrupt (1-10% is normal)
- S3/GCS for long-term storage unless you like buying disks
High Availability (Because Shit Breaks):
- Prometheus needs federation for HA (pain in the ass but necessary)
- Jaeger clusters work with shared storage backends
- Grafana is stateless — stick it behind a load balancer and call it done
Netflix runs this exact setup at Netflix scale. GitHub monitors their entire platform with Prometheus. If it's good enough for them, it's probably good enough for your startup's 3 microservices.