Currently viewing the human version
Switch to AI version

Why Zipkin Exists (And Why You'll Thank Twitter)

Twitter built Zipkin because their site was slower than dial-up and nobody could figure out why. When a single tweet involves too many damn services, debugging becomes less "check the logs" and more "stare at dashboards until something makes sense." The original Twitter blog post explains their pain points in detail.

The Microservices Debugging Nightmare

Remember the good old days of monoliths? You'd stick a debugger on your code, step through it, and find your bottleneck. Simple. Boring. Effective.

Then someone invented microservices. Now that same user request bounces through 15 different services, each written in a different language, running on different machines, with different lag times. When shit breaks, good luck figuring out where. The Google Dapper paper describes this exact problem and inspired Zipkin's design.

Without tracing, debugging a slow request is like trying to find a memory leak with printf statements. You'll waste hours checking everything except the actual problem. I spent two days tracking down a 2-second delay that turned out to be some idiot (okay, it was me) who misconfigured a connection pool. The Netflix chaos engineering blog has war stories that'll make you appreciate tracing when the pager goes off at midnight.

What Zipkin Actually Does

Zipkin shows you the path your request took and where it got stuck. When you have a 5-second response time, Zipkin tells you that most of it was spent waiting for the recommendations service because someone deployed code that hits the database one row at a time instead of batching. Classic.

Zipkin Trace Timeline

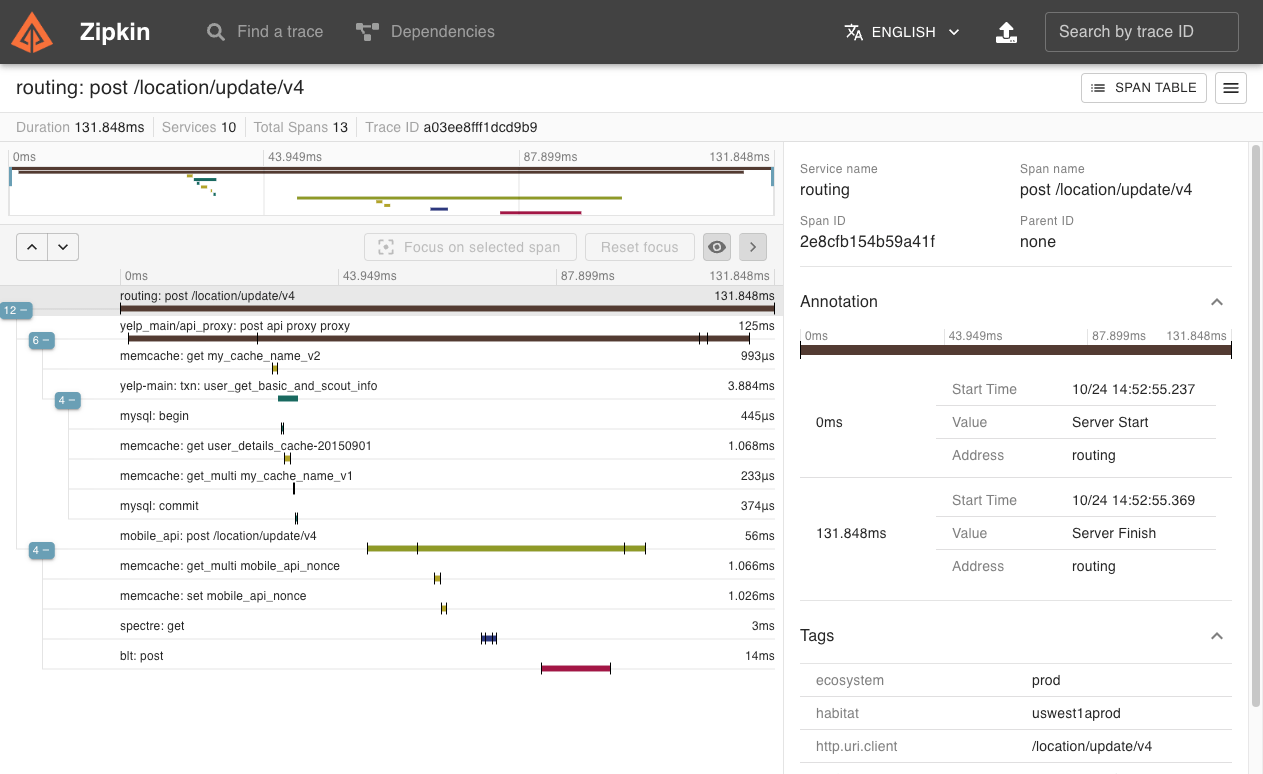
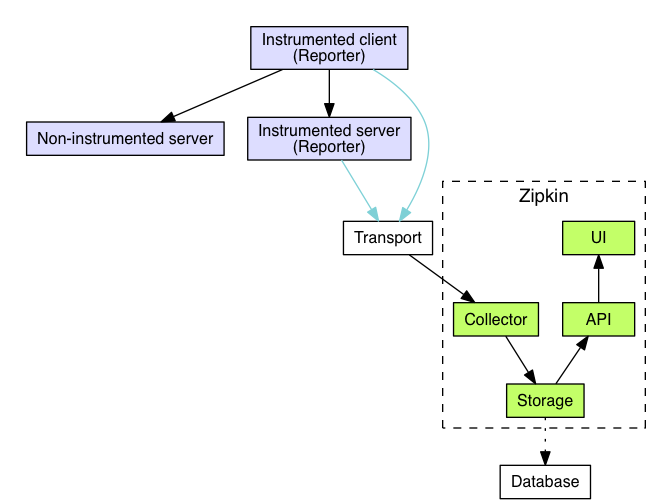
It follows your request as it bounces between services using lightweight trace IDs. Each service reports timing data asynchronously, so your app doesn't slow down while sending telemetry (unlike some APM tools that make your performance worse while measuring it). The Zipkin data model documentation explains how spans and traces work, and this Spring Boot tracing guide shows practical implementation.

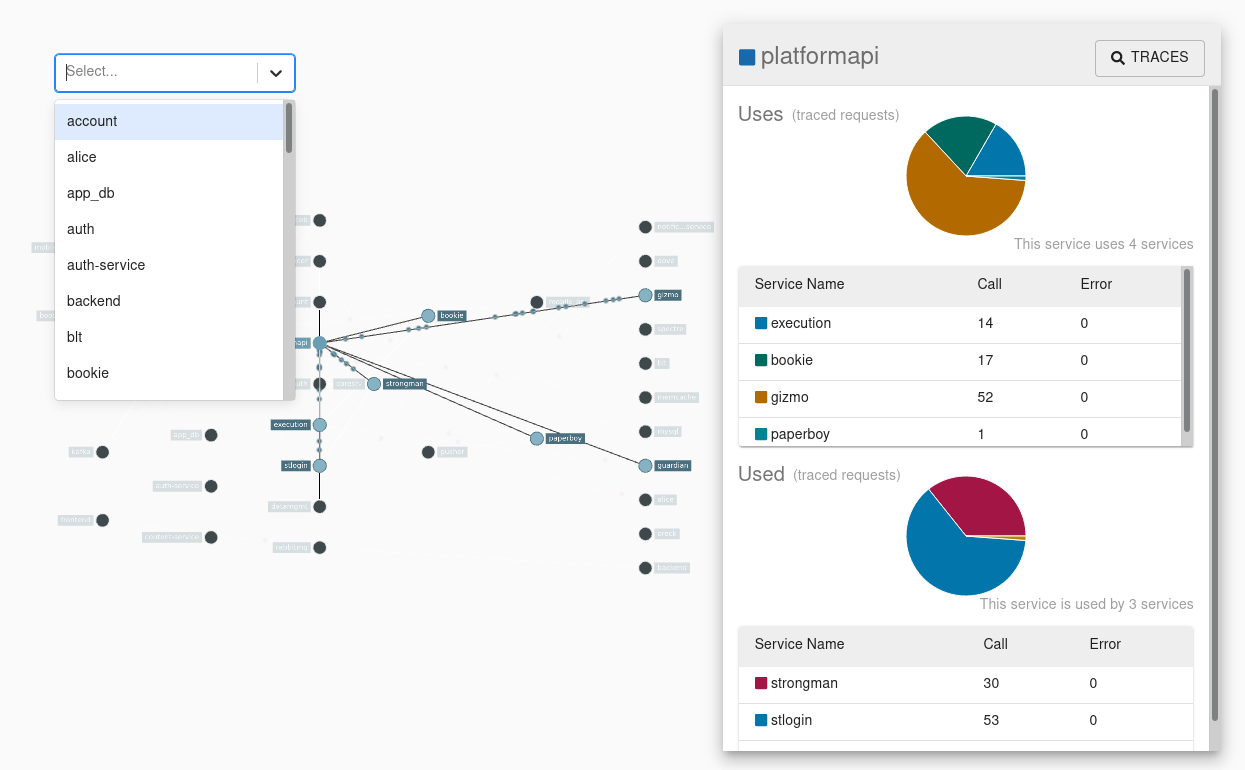
The dependency graph actually doesn't suck - shows you which services will break when payments goes down. When checkout, user accounts, and the mobile API all start throwing errors, you'll know exactly why before your Slack channels explode.

Zipkin Dependency Graph

Why It Doesn't Suck

Zipkin is basically one JAR file that doesn't crash your app. Unlike some tracing systems that need a PhD to configure, you can literally run java -jar zipkin.jar and start seeing traces. The official quickstart guide gets you running in under 5 minutes.

The overhead is actually minimal - we're talking less than 1% impact on request processing. Compare this to heavyweight APM tools that slow your app down more than the bugs you're trying to find. Performance benchmarks show real numbers.

It supports real storage backends too. Elasticsearch if you want fancy queries (and can afford the hosting costs), Cassandra if you need to scale to Twitter levels, or MySQL if you want something simple that works. The storage comparison page has honest assessments of each option.

Current State (September 2025)

Version 3.5.1 came out in April 2024 - been running it for over a year now, zero issues. The OpenZipkin team keeps shipping updates without breaking existing deployments - a rare trait in the observability space. Check the release notes for what's new.

The project has 17.3k GitHub stars because it actually solves real problems without creating new ones. Companies like Pinterest, SoundCloud, and Yelp have public case studies. It's evolved way beyond Twitter's original use case but still maintains the "simple things should be simple" philosophy.

Zipkin vs. Leading Distributed Tracing Tools

Feature

Zipkin

Jaeger

OpenTelemetry

Grafana Tempo

Deployment Model

Single binary/Docker image

Microservices architecture

Framework/SDK only

Single binary/Docker

Storage Backends

Elasticsearch, Cassandra, MySQL, In-memory

Elasticsearch, Cassandra, Kafka, Badger

Vendor agnostic

Object storage (S3, GCS, Azure)

Programming Language Support

Java, JavaScript, Go, Python, Ruby, C#

Java, Go, Python, Node.js, C++, C#

All major languages

Via OpenTelemetry

Learning Curve

Low

  • simple setup

Moderate

  • more components

High

  • comprehensive framework

Low

  • minimal configuration

Memory Usage

Actually low

  • won't eat your RAM like Chrome

Kubernetes memory hog

Depends on vendor greed

Low (stores in object storage)

Sampling Strategies

Simple percentage

  • works fine

Fancy algorithms nobody understands

Vendor lock-in festival

Basic but sufficient

UI Capabilities

Gets the job done

Pretty but slow when loaded with data

Nonexistent

  • good luck

Grafana (love it or hate it)

Community Size

17.3k stars (real users)

20k+ stars (lots of Uber employees)

Committee-driven spec

Grafana hype train

Enterprise Features

Minimal but honest

Over-engineered for most teams

Pay-to-play everywhere

Free with Grafana Cloud bills

Setup Complexity

One JAR file, done

Kubernetes YAML hell

Prepare for documentation misery

Docker compose and pray

Performance Overhead

Negligible (<1%)

Noticeable with high throughput

Vendor roulette

Minimal overhead

Protocol Support

HTTP, Kafka, gRPC, RabbitMQ

HTTP, gRPC, Thrift

Multiple protocols

HTTP, gRPC

Data Retention

Whatever storage you can afford

Whatever storage you can afford

Vendor wallet extraction

Set it and forget it (until it breaks)

Service Map

Does the job without PhD requirements

Advanced service topology

Vendor-dependent

Via Grafana

Alerting

External integration required

Basic alerting

Vendor-dependent

Native Grafana alerting

How Zipkin Works (Without the Marketing BS)

Zipkin's architecture is actually straightforward: your apps send trace data to a collector, which dumps it in storage, and a web UI lets you query it. No complex microservices architecture, no distributed coordinator nodes, no PhD required. The official architecture docs break it down clearly.

The Four Parts That Matter

Zipkin Architecture

Your Apps (with instrumentation): You add a library that generates trace IDs and timing data. The smart part is that only lightweight headers get passed between services, while the heavy telemetry data gets sent asynchronously to Zipkin. This means tracing doesn't slow down your actual requests. Check the instrumentation libraries for your language.

Collector: Receives spans from your apps via HTTP POST, Kafka, or other transports. It does basic validation and shoves everything into storage. When the collector shits itself (not if), your apps keep working fine - you just lose visibility until it's back. The collector configuration guide explains transport options.

Storage: Pick your poison carefully. In-memory is great until you restart and lose everything. MySQL works for demos but chokes when you hit real volume. Cassandra sounds good until you need to explain eventual consistency to your product manager. Elasticsearch costs money but actually works at scale.

Web UI: Shows you traces and dependency graphs. It's not winning any design awards, but it gets the job done without requiring a masters degree in UI frameworks.

Storage Reality Check

Zipkin Architecture

Elasticsearch/OpenSearch: Expensive but effective. Expect your AWS bill to spike when you start storing millions of spans. OpenSearch v2 support in Zipkin 3.4+ gives you an escape route from Elastic's licensing shenanigans. The Elasticsearch storage guide has tuning tips.

Cassandra: Scales like crazy but requires an ops team that knows what they're doing. Write performance is excellent, but good luck debugging when queries start timing out. Cassandra schema design explains the data model.

MySQL: Perfect for getting started. Will absolutely fall over when you hit production volume, but by then you'll have budget for real storage. The MySQL performance issues are well documented.

In-memory: Use for development only unless you enjoy explaining to your team why all the trace data disappeared after that container restart. Good for testing and CI environments though.

Deployment War Stories

The Single JAR Approach: Just run java -jar zipkin.jar and you're done. No service mesh, no operator, no 47 different pods that need to talk to each other. This is why engineers love Zipkin.

Docker Reality: docker run -p 9411:9411 openzipkin/zipkin works great until you realize you've been using in-memory storage and just lost 3 days of trace data. Always configure persistent storage in production. The Docker examples include production-ready compose files with persistent storage.

Kubernetes Deployment: The Helm charts work fine, but watch your resource limits. I've seen teams set CPU limits too low and wonder why spans are getting dropped. Zipkin is Java - it needs reasonable resources to perform well. The Kubernetes examples show real configurations.

Scaling Up: When you outgrow a single instance, you can run multiple collectors behind a load balancer. The storage becomes your bottleneck, not Zipkin itself. Plan accordingly. This scaling guide covers high-volume deployments. Pro tip: Docker Desktop has been flaky lately - I think it was around version 4.19 that it started randomly not working. Had to downgrade when traces stopped showing up.

Common Gotchas

Sampling Rate: Start with 1% sampling in production. 100% sampling will bankrupt you and overwhelm whatever storage you chose. I learned this the hard way with a brutal Elasticsearch bill - I think it was like $2000 or maybe more? Either way, way too much for what we were getting. Here's how to avoid my mistake: set ZIPKIN_STORAGE_ELASTICSEARCH_MAX_SPANS=1000000 and use adaptive sampling based on service load.

Retention: Set retention to 7 days max unless you enjoy paying AWS storage bills forever. Most debugging happens within hours of an incident anyway. Check the storage retention settings for your backend.

Network Issues: When services can't reach Zipkin, they'll buffer spans in memory briefly then drop them. This is intentional - we're not going to break your app just to collect some timing data. Watch for dropped span metrics in your logs - that's how you'll know when things are going sideways. Common failure: firewall blocking port 9411 in production when it worked fine in staging.

Real Questions from Engineers Who've Actually Used Zipkin

Q

Will adding Zipkin slow down my app?

A

Overhead is actually minimal

  • less than 1% impact on request processing. Unlike APM tools that slow your app down more than the bugs you're trying to find, Zipkin sends telemetry data asynchronously. Your requests don't wait for spans to be reported.
Q

How do I avoid my Elasticsearch bill bankrupting the company?

A

Start with 1% sampling rate in production. Seriously. 100% tracing will generate millions of spans per day and your AWS bill will make the CFO cry. Also set retention to 7 days max

  • most debugging happens within hours anyway.
Q

Why are my traces incomplete or missing spans?

A

Usually network issues or memory pressure. When services can't reach Zipkin, they buffer spans briefly then drop them. This is intentional

  • tracing failures shouldn't break your app. Check your sampling config and Zipkin collector health.
Q

Can I use MySQL instead of Elasticsearch to save money?

A

MySQL works great for getting started and small deployments. It'll absolutely fall over when you hit real production volume, but by then you'll have budget for proper storage. Don't use it for anything over a few million spans per day.

Q

Spring Boot setup keeps failing with dependency conflicts

A

Spring Boot 3 uses Micrometer Tracing, older versions need Spring Cloud Sleuth. Don't try to use both unless you enjoy Class

NotFoundException hell. If you're on Spring Boot 2.x, stick with Sleuth. If you're on 3.x, use Micrometer. The dependency hell is real with mixed versions

  • learned this during a weekend deployment that went sideways.
Q

How do I know if Zipkin is actually working?

A

Hit your app a few times, then check http://localhost:9411/zipkin. If you see traces, it's working. If not, check your instrumentation config and make sure your app can reach the Zipkin collector. Common gotcha: Docker networking issues.

Q

The web UI is slow when I have lots of traces

A

You're probably storing too much data or using My

SQL at scale. Elasticsearch/OpenSearch performs way better for queries. Also, shorter retention periods help

  • nobody needs traces from 6 months ago.
Q

Why does Zipkin keep crashing with OutOfMemoryError?

A

You're either not setting JVM heap size properly or you configured 100% sampling and overwhelmed it. Start Zipkin with -Xmx2g or more depending on your trace volume. Also check your sampling rate isn't set to 1.0 (100%)

  • this mistake will destroy your budget when traffic spikes. Trust me on this one.
Q

Can I run Zipkin without Docker/Kubernetes?

A

Absolutely. Just download the JAR and run java -jar zipkin.jar. No containers required. This is actually the simplest way to get started

  • no YAML files, no container orchestration, just Java.
Q

How does this compare to paying for DataDog/New Relic tracing?

A

Zipkin is free but requires you to manage storage and infrastructure. APM tools are expensive but handle everything for you. If you have ops capacity, Zipkin can save you thousands per month. If you don't, stick with managed solutions.

Q

What happens when I restart Zipkin with in-memory storage?

A

All your trace data disappears. Forever. This is why in-memory storage is for development only. Configure persistent storage (Elasticsearch, Cassandra, or MySQL) for anything that matters.

Q

How do I instrument Node.js/Python/Go applications?

A

Most languages have official or community instrumentation libraries. For Node.js, use the zipkin library. Python has py_zipkin. Go has zipkin-go. Check the tracers page for complete list.

Q

Why am I getting "span was not finished" errors?

A

You're not properly closing spans in your code. Every span.start() needs a corresponding span.finish(). Use try-with-resources in Java or defer statements in Go. Unfinished spans leak memory and create incomplete traces.

Related Tools & Recommendations

integration
Recommended

OpenTelemetry + Jaeger + Grafana on Kubernetes - The Stack That Actually Works

Stop flying blind in production microservices

OpenTelemetry
/integration/opentelemetry-jaeger-grafana-kubernetes/complete-observability-stack
100%
integration
Recommended

GitOps Integration Hell: Docker + Kubernetes + ArgoCD + Prometheus

How to Wire Together the Modern DevOps Stack Without Losing Your Sanity

kubernetes
/integration/docker-kubernetes-argocd-prometheus/gitops-workflow-integration
94%
integration
Recommended

Prometheus + Grafana + Jaeger: Stop Debugging Microservices Like It's 2015

When your API shits the bed right before the big demo, this stack tells you exactly why

Prometheus
/integration/prometheus-grafana-jaeger/microservices-observability-integration
60%
howto
Recommended

Set Up Microservices Monitoring That Actually Works

Stop flying blind - get real visibility into what's breaking your distributed services

Prometheus
/howto/setup-microservices-observability-prometheus-jaeger-grafana/complete-observability-setup
60%
tool
Recommended

Datadog Cost Management - Stop Your Monitoring Bill From Destroying Your Budget

alternative to Datadog

Datadog
/tool/datadog/cost-management-guide
57%
pricing
Recommended

Datadog vs New Relic vs Sentry: Real Pricing Breakdown (From Someone Who's Actually Paid These Bills)

Observability pricing is a shitshow. Here's what it actually costs.

Datadog
/pricing/datadog-newrelic-sentry-enterprise/enterprise-pricing-comparison
57%
pricing
Recommended

Datadog Enterprise Pricing - What It Actually Costs When Your Shit Breaks at 3AM

The Real Numbers Behind Datadog's "Starting at $23/host" Bullshit

Datadog
/pricing/datadog/enterprise-cost-analysis
57%
tool
Recommended

New Relic - Application Monitoring That Actually Works (If You Can Afford It)

New Relic tells you when your apps are broken, slow, or about to die. Not cheap, but beats getting woken up at 3am with no clue what's wrong.

New Relic
/tool/new-relic/overview
57%
tool
Recommended

Spring Boot - Finally, Java That Doesn't Suck

The framework that lets you build REST APIs without XML configuration hell

Spring Boot
/tool/spring-boot/overview
56%
alternatives
Recommended

Docker Alternatives That Won't Break Your Budget

Docker got expensive as hell. Here's how to escape without breaking everything.

Docker
/alternatives/docker/budget-friendly-alternatives
56%
compare
Recommended

I Tested 5 Container Security Scanners in CI/CD - Here's What Actually Works

Trivy, Docker Scout, Snyk Container, Grype, and Clair - which one won't make you want to quit DevOps

docker
/compare/docker-security/cicd-integration/docker-security-cicd-integration
56%
alternatives
Recommended

OpenTelemetry Alternatives - For When You're Done Debugging Your Debugging Tools

I spent last Sunday fixing our collector again. It ate 6GB of RAM and crashed during the fucking football game. Here's what actually works instead.

OpenTelemetry
/alternatives/opentelemetry/migration-ready-alternatives
54%
tool
Recommended

OpenTelemetry - Finally, Observability That Doesn't Lock You Into One Vendor

Because debugging production issues with console.log and prayer isn't sustainable

OpenTelemetry
/tool/opentelemetry/overview
54%
tool
Recommended

Dynatrace Enterprise Implementation - The Real Deployment Playbook

What it actually takes to get this thing working in production (spoiler: way more than 15 minutes)

Dynatrace
/tool/dynatrace/enterprise-implementation-guide
52%
tool
Recommended

Dynatrace - Monitors Your Shit So You Don't Get Paged at 2AM

Enterprise APM that actually works (when you can afford it and get past the 3-month deployment nightmare)

Dynatrace
/tool/dynatrace/overview
52%
review
Recommended

Kafka Will Fuck Your Budget - Here's the Real Cost

Don't let "free and open source" fool you. Kafka costs more than your mortgage.

Apache Kafka
/review/apache-kafka/cost-benefit-review
52%
tool
Recommended

Apache Kafka - The Distributed Log That LinkedIn Built (And You Probably Don't Need)

integrates with Apache Kafka

Apache Kafka
/tool/apache-kafka/overview
52%
integration
Recommended

RAG on Kubernetes: Why You Probably Don't Need It (But If You Do, Here's How)

Running RAG Systems on K8s Will Make You Hate Your Life, But Sometimes You Don't Have a Choice

Vector Databases
/integration/vector-database-rag-production-deployment/kubernetes-orchestration
52%
integration
Recommended

Kafka + MongoDB + Kubernetes + Prometheus Integration - When Event Streams Break

When your event-driven services die and you're staring at green dashboards while everything burns, you need real observability - not the vendor promises that go

Apache Kafka
/integration/kafka-mongodb-kubernetes-prometheus-event-driven/complete-observability-architecture
52%
integration
Recommended

ELK Stack for Microservices - Stop Losing Log Data

How to Actually Monitor Distributed Systems Without Going Insane

Elasticsearch
/integration/elasticsearch-logstash-kibana/microservices-logging-architecture
52%

Recommendations combine user behavior, content similarity, research intelligence, and SEO optimization