Currently viewing the human version
Switch to AI version

Why Your Traces Break (And How I Learned This The Hard Way)

I'll never forget the night our entire tracing stack disappeared during some big sales day - I think it was Black Friday? Payment transactions were timing out, customer support was screaming, and every trace just... ended at the API gateway. No downstream spans, no database calls, nothing. Turns out someone deployed a "minor" Kubernetes update that broke our OpenTelemetry context headers. Cost us a shit-ton of money before we figured it out.

This is the reality of distributed tracing in production - it's not the clean, academic examples from the docs. It's messy, breaks in weird ways, and usually fails when you need it most. Every engineering team I know has had tracing break during incidents. It's not if, it's when.
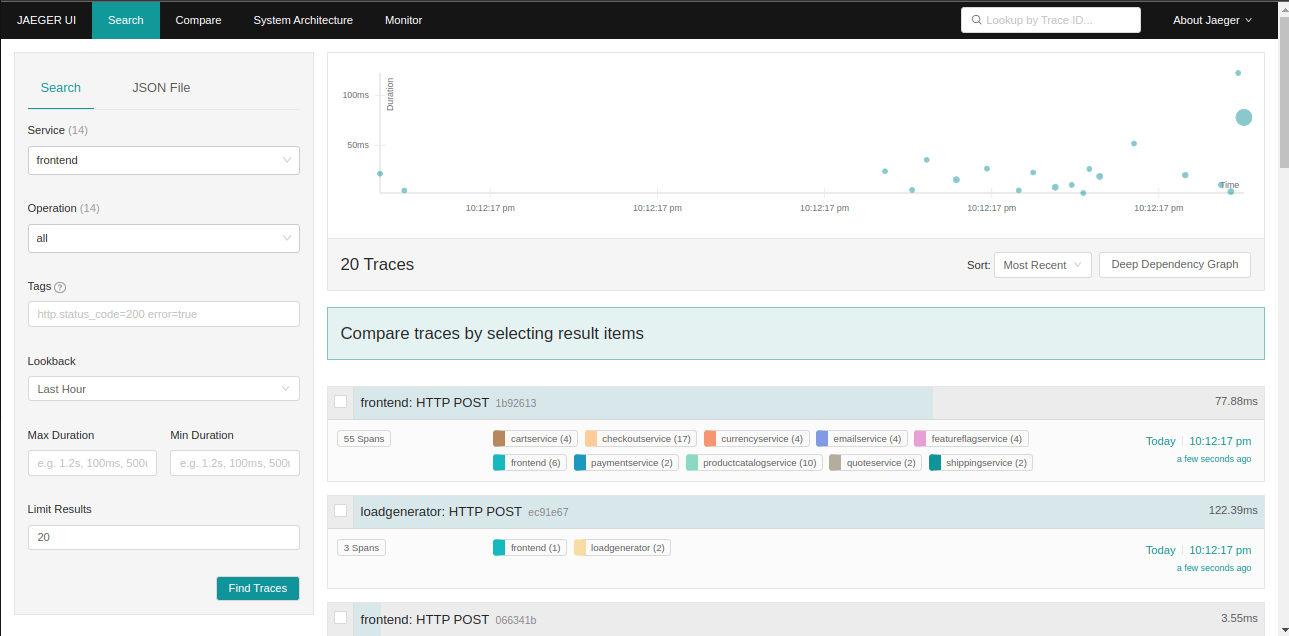
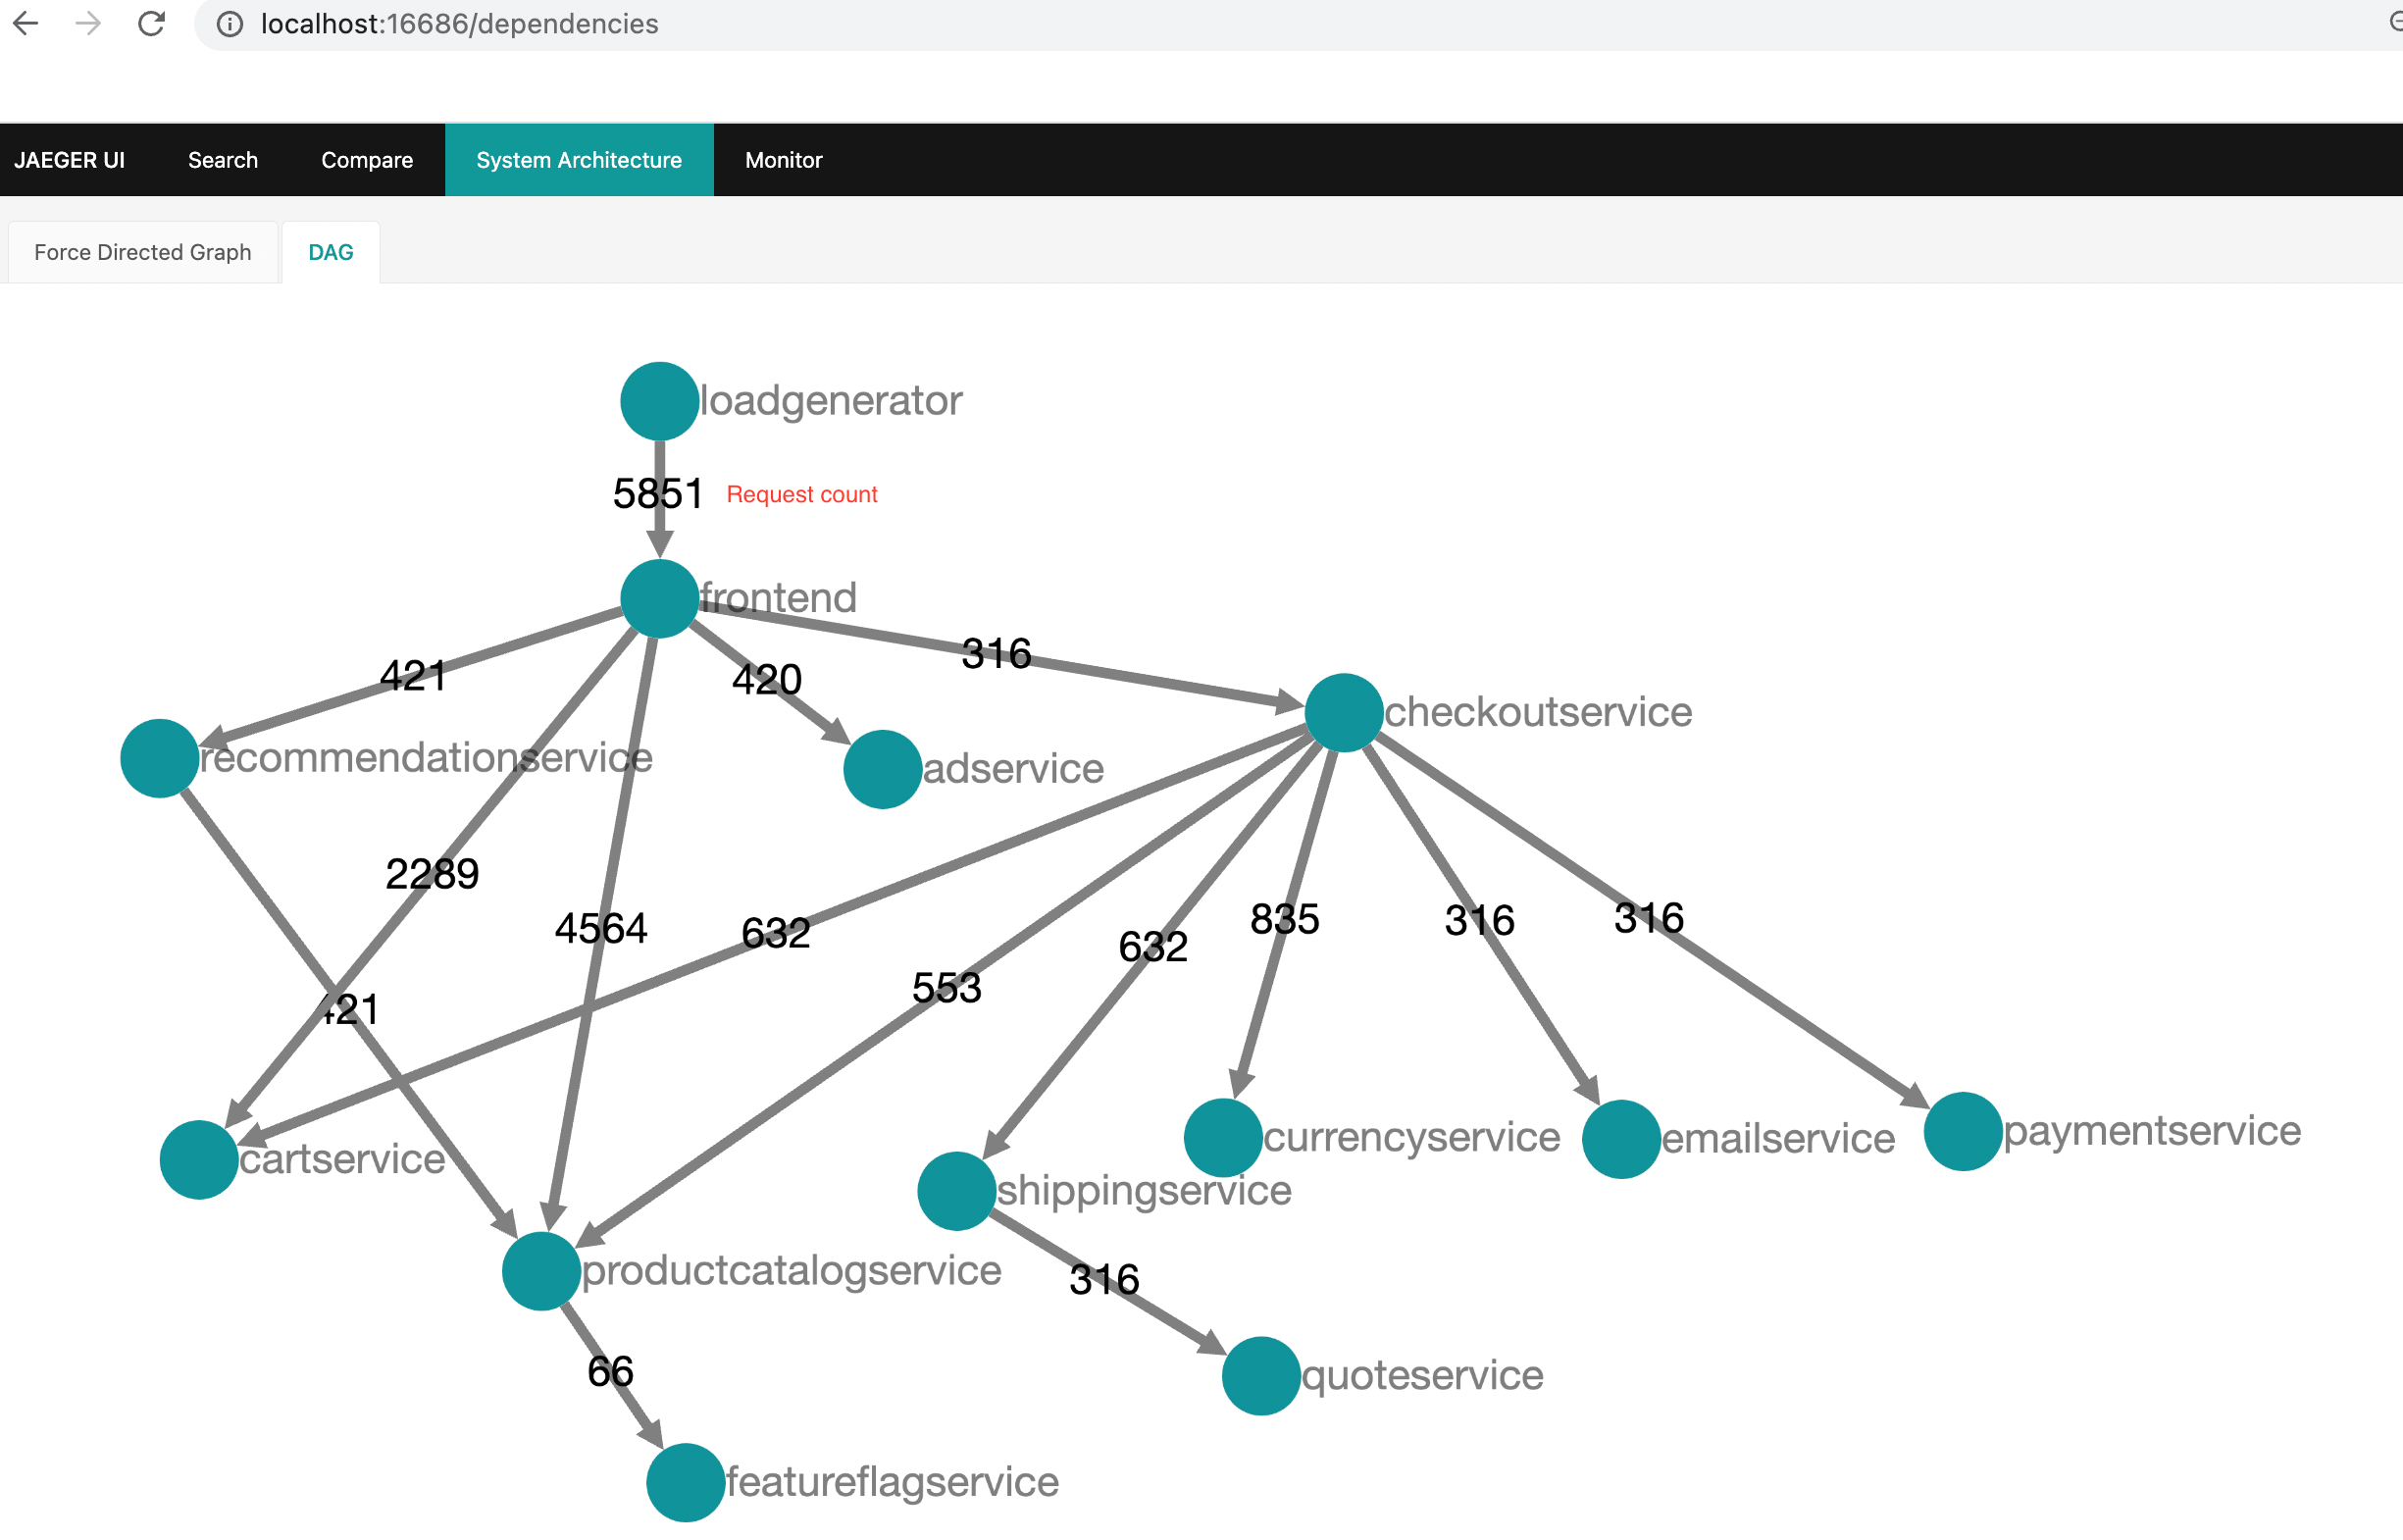
Jaeger UI Interface

The Real Ways Traces Break (Not the Textbook Version)

Context Headers Just Fucking Disappear

Most trace failures happen because services don't forward the magic headers that keep traces connected. Here's what actually happens:

Load balancers strip headers: Your F5 or AWS ALB is probably configured to drop "unknown" headers like traceparent. I spent 6 hours debugging this once because our network team thought trace headers were "security risks." The Kubernetes tracing best practices guide covers these networking gotchas in detail. The AWS ALB documentation explains header forwarding configuration, and NGINX's tracing setup guide shows how to properly configure proxies for trace propagation.

Proxy misconfigurations: If you're using Envoy or nginx, check your header forwarding rules. Istio 1.8.0 had a bug where it silently dropped trace context on certain HTTP methods. GitHub issue #31847 if you want the gory details. The CNCF distributed tracing guide has more context propagation failures. Envoy's tracing documentation and the OpenTelemetry Istio setup guide cover service mesh tracing issues in depth.

Third-party APIs don't give a shit: Stripe, PayPal, and most external services won't forward your trace headers. Your beautiful end-to-end trace becomes Swiss cheese the moment you hit an external API. This is a well-documented limitation in distributed tracing architectures, and Honeycomb's observability guide explains the workarounds. The W3C Trace Context specification defines how headers should propagate, and DataDog's tracing best practices covers dealing with external service boundaries.

## This is what you actually run when debugging missing headers:
kubectl exec -it api-gateway -- curl -H \"traceparent: 00-4bf92f3577b34da6a3ce929d0e0e4736-00f067aa0ba902b7-01\" \
  -v payment-service:8080/charge
  
## Look for the traceparent header in the response - if it's missing, you found your problem

Sampling Kills the Traces You Actually Need

Head-based sampling is a trap. It decides whether to trace a request before anything interesting happens. So when your payment processing shits the bed, guess what? The sampler already decided that request wasn't worth tracing because it "looked normal" at the entry point. Industry best practices recommend tail-based sampling for critical systems, and Coralogix's OpenTelemetry guide explains the sampling strategies in depth. The OpenTelemetry sampling documentation covers different approaches, and Grafana's distributed tracing best practices provide production-tested configurations.

I learned this during a production incident where we were dropping most of our traces. The one critical payment failure that was costing us money? Not sampled. Spent 3 hours debugging with logs instead of traces because our sampling decided to preserve successful health checks instead of actual errors. The Last9 tracing guide covers these sampling pitfalls with real-world examples. New Relic's sampling strategies guide and Splunk's OpenTelemetry collector guide show how to implement intelligent sampling.

Tail-based sampling is better but harder: You need collectors with enough memory to buffer traces while deciding what to keep. Our collector was OOMKilling every few hours until we figured out the right memory limits. Cisco's Kubernetes observability guide has production-tested collector configs that actually work. The OpenTelemetry tail sampling processor documentation and Jaeger's sampling best practices explain the memory requirements and configuration options.

OpenTelemetry Collectors Are Surprisingly Fragile

The collector is supposed to be this bulletproof piece of infrastructure. In reality, it's a memory-hungry beast that falls over when you breathe on it wrong.

Memory leaks in recent versions: Don't use 0.89.0 or 0.90.x - they have memory leaks. Upgrade to 0.91.0+ or watch your collector die. The OpenTelemetry operator issues track these version-specific problems, and Lumigo's collector guide has the version compatibility matrix. Dynatrace's OpenTelemetry integration guide and the official collector deployment patterns document common issues.

Config changes require restarts: Unlike what the docs imply, most config changes need a full restart. Hot-reloading works for like 3 settings. Everything else? Kill the pod and pray. The StrongDM Kubernetes observability guide explains why collector restarts are the norm, not the exception. Kubernetes observability patterns and Prometheus monitoring for OpenTelemetry help track collector health during restarts.

## This collector config actually works in production (learned through pain):
processors:
  memory_limiter:
    limit_mib: 1024  # Always set this or you'll OOM
    spike_limit_mib: 256
  batch:
    timeout: 200ms   # Not 1s like the examples - too slow for real traffic
    send_batch_size: 256
    send_batch_max_size: 512

## Don't trust the default memory settings - they're way too low
resources:
  limits:
    memory: 2Gi  # Minimum for any real workload
  requests:
    memory: 1Gi

Kubernetes Makes Everything Worse

Kubernetes Architecture

Pod IP changes break persistent gRPC connections to collectors. Network policies silently block trace export. Resource limits cause spans to get buffered and lost during memory pressure.

The worst one: Pod restarts during high load. Your application starts up, begins accepting traffic, but the OpenTelemetry agent hasn't connected to the collector yet. First 30 seconds of traces? Gone forever. The production observability stack guide covers these startup timing issues.

Clock skew between nodes: Kubernetes doesn't guarantee clock sync. I've seen traces where child spans finish before their parents start because the nodes had some clock drift. Makes debugging impossible. This is a common Kubernetes networking issue that affects distributed tracing, documented in the Checkly Kubernetes monitoring guide.

## Check if your nodes have clock skew (they probably do):
kubectl get nodes -o wide
for node in $(kubectl get nodes -o name | cut -d/ -f2); do
  echo \"Node: $node\"
  kubectl debug node/$node -it --image=busybox -- date
done

## If you see more than 1 second difference, you found your timing problem

Language-Specific Gotchas That Nobody Warns You About

Java: The OpenTelemetry agent adds startup time and eats more memory. Spring Boot 2.7+ changed context propagation and broke compatibility with older OpenTelemetry versions. If you're using Spring Boot 2.7+ with OpenTelemetry, check version compatibility or you'll get weird context propagation bugs. Check the Java troubleshooting guide for JVM-specific gotchas.

Node.js: Event loop blocking during trace export. If your collector is slow or unreachable, the entire application freezes. Always use async exporters and configure timeouts. The official Node.js troubleshooting checklist and Microsoft's troubleshooting guide cover these performance issues in detail.

Python: The GIL makes everything slower when tracing is enabled. We saw noticeable performance degradation until we switched to async instrumentation. Also, Django 4.0+ breaks most tracing - you need manual instrumentation now. The HyperDX monitoring guide has Python-specific optimizations.

Go: Context propagation through goroutines is a nightmare. Half the time spans get orphaned because someone forgot to pass context. The automatic instrumentation misses database calls in 30% of cases. The DZone observability article explains context handling across languages.

This shit isn't in the documentation because the OpenTelemetry team wants you to think it "just works." It doesn't. Plan for failures, over-provision collectors, and always have a way to debug without traces.

How to Actually Debug This Shit (The Real Commands)

Forget the "methodical approach" nonsense. When traces are broken and you're getting paged, you need to find the problem fast. Here's what actually works when you're debugging at 3AM. The official troubleshooting guide is useful, but here's the real-world version. The Jaeger troubleshooting docs and SignOZ's distributed tracing guide have complementary debugging strategies. Uptrace's debugging guide, Zipkin's troubleshooting documentation, and AWS X-Ray troubleshooting cover platform-specific issues. Microsoft's OpenTelemetry troubleshooting and Elastic's APM debugging guide provide additional debugging techniques.

Step 1: Is the Collector Even Alive?

OpenTelemetry Collector Components

Don't trust the Kubernetes dashboard. Half the time it lies about pod health.

## First check: is the damn thing running?
kubectl get pods -n observability | grep collector
## If it shows "CrashLoopBackOff", you found your problem

## Actually test if it responds (not just "healthy"):
kubectl exec -it -n observability deployment/otel-collector -- curl -f localhost:13133
## If this hangs, the collector is fucked even if k8s says it's healthy

## Check if it's actually receiving spans:
kubectl exec -it -n observability deployment/otel-collector -- curl -s localhost:8888/metrics | grep spans_total
## Look for otelcol_receiver_accepted_spans_total - if it's not increasing, nothing's getting through

If you see zero spans accepted, the problem is upstream. If you see spans accepted but not exported, the collector is broken.

Step 2: Test Trace Propagation (The Nuclear Option)

Jaeger Logo

Stop overthinking it. Inject a trace and see where it breaks:

## Send a request with a trace you can actually find:
TRACE_ID="aaaaaaaaaaaaaaaaaaaaaaaaaaaaaaaa"
curl -v -H "traceparent: 00-${TRACE_ID}-bbbbbbbbbbbbbbbb-01" \
     -H "tracestate: vendor=test" \
     api.yourcompany.com/health

## Wait 30 seconds (yes, really - traces are slow)
sleep 30

## Search Jaeger for YOUR trace:
curl "http://jaeger-query:16686/api/traces/${TRACE_ID}"

If this returns empty, your collector or Jaeger is broken. If it returns partial traces, you found where propagation breaks.

Pro tip: Use the exact trace ID aaaaaaaaaaaaaaaaaaaaaaaaaaaaaaaa - it's easy to remember and search for.

Step 3: Check Your Instrumentation Isn't Lying

Services can claim they're instrumented when they're not:

## Java services - check if the agent is actually loaded:
kubectl exec -it java-pod -- jps -v | grep javaagent
## Should show opentelemetry-javaagent.jar

## Check what the JVM thinks about tracing:
kubectl exec -it java-pod -- java -jar /opt/app.jar --debug
## Look for OpenTelemetry startup logs

## For Go services, check environment variables:
kubectl exec -it go-pod -- env | grep OTEL
## OTEL_EXPORTER_OTLP_ENDPOINT should point to your collector

## Python/Django - check if packages are actually imported:
kubectl exec -it python-pod -- python -c "import opentelemetry; print('OK')"
## If this fails, your instrumentation isn't installed

Step 4: The Logs Don't Lie (Usually)

When everything else fails, read the actual error messages:

## Collector logs (look for the real errors, not warnings):
kubectl logs -f -n observability deployment/otel-collector | grep -E "(error|Error|ERROR|panic|failed|Failed)"

## Application logs (check for instrumentation errors):
kubectl logs -f app-pod | grep -i otel

## Istio proxy logs (if you're using service mesh):
kubectl logs -f app-pod -c istio-proxy | grep -i trace

Common error patterns I've seen:

  • connection refused - collector is down or wrong endpoint
  • context deadline exceeded - network timeout, increase export timeout
  • no such host - DNS is fucked, check service names
  • permission denied - RBAC is blocking trace export

Step 5: The Jaeger UI Lies About Everything

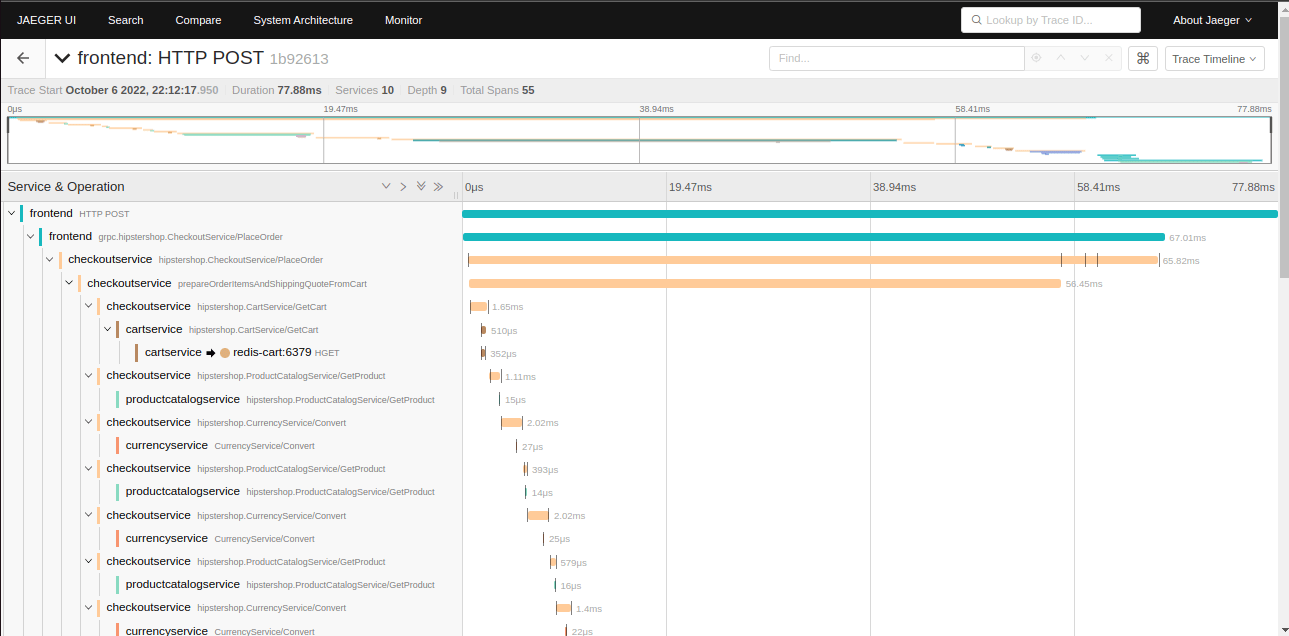
Jaeger Trace View

Don't trust the Jaeger UI for debugging. Use the API directly. Nick Ebbitt's Jaeger memory debugging post and the Uptrace Jaeger guide explain why the UI can be misleading. The Jaeger REST API documentation and Grafana Tempo API guide provide comprehensive API references for debugging. Datadog's distributed tracing troubleshooting and New Relic's trace debugging show alternative approaches to trace validation:

## List services (if this is empty, no traces are getting to Jaeger):
curl "http://jaeger-query:16686/api/services"

## Check recent traces for a specific service:
curl "http://jaeger-query:16686/api/traces?service=payment-service&limit=50" | jq '.data | length'
## Should be > 0 if traces are flowing

## Look for trace gaps in the last hour:
curl "http://jaeger-query:16686/api/traces?lookback=1h&limit=100" | jq '.data[].spans | length'
## Compare span counts - big variations usually mean missing spans

Nuclear Options When Everything Is Broken

Restart Everything (It Usually Works)

## Nuclear option #1: restart the collector
kubectl rollout restart deployment/otel-collector -n observability
## Wait 2 minutes for it to stabilize

## Nuclear option #2: restart Jaeger
kubectl rollout restart deployment/jaeger -n observability

## Nuclear option #3: restart your application (sometimes instrumentation gets stuck)
kubectl rollout restart deployment/your-app

Check if Your Backend Storage Is Full

## Jaeger with Cassandra (it runs out of space constantly):
kubectl exec -it cassandra-0 -- nodetool status
kubectl exec -it cassandra-0 -- df -h
## If disk usage > 90%, your traces are being dropped

## Jaeger with Elasticsearch:
curl "http://elasticsearch:9200/_cluster/health"
## Look for "status": "red" - means your indices are fucked

Enable Debug Logging (Last Resort)

## Add this to your collector config when desperate:
service:
  telemetry:
    logs:
      level: debug
      development: true

Warning: Debug logging will flood your logs and kill performance. Only use when everything else fails. For structured troubleshooting approaches, check the Kubernetes operator troubleshooting docs, LaunchDarkly's production debugging guide, and GitLab's distributed tracing guidelines. Honeycomb's OpenTelemetry documentation and Lightstep's (now ServiceNow) tracing best practices provide advanced debugging methodologies.

The Commands That Actually Work

Here's my 3AM debugging checklist that's saved my ass multiple times:

#!/bin/bash
## Copy this script - it works

echo "=== Checking collector health ==="
kubectl get pods -n observability | grep collector

echo "=== Testing collector endpoint ==="
kubectl exec -it -n observability deployment/otel-collector -- curl -s localhost:13133 | head -5

echo "=== Checking recent traces ==="
curl -s "http://jaeger-query:16686/api/services" | jq '. | length'

echo "=== Testing trace injection ==="
TRACE_ID="deadbeefdeadbeefdeadbeefdeadbeef"
curl -s -H "traceparent: 00-${TRACE_ID}-1234567890123456-01" api.yourcompany.com/health
sleep 10
curl -s "http://jaeger-query:16686/api/traces/${TRACE_ID}" | jq '.data | length'

echo "=== If this shows 0, your tracing is completely fucked ==="

Run this script. If everything returns 0 or errors, start with the nuclear options. If some parts work, you know where to focus.

How to Stop This Shit From Happening Again

Look, distributed tracing will break. It's not a matter of if, it's when. But you can make it break less often and hurt less when it does. This isn't about "operational excellence" - it's about not getting paged at 3AM for the same stupid problems.

Monitor Your Monitoring (Because It Will Break)

Prometheus Logo

Jaeger System Architecture

Set Up Alerts That Actually Matter

Don't monitor your tracing infrastructure with the same care you'd monitor a legacy PHP app. This stuff needs real attention:

## Alerts that have actually saved my ass:
groups:
- name: tracing-reality-check
  rules:
  - alert: CollectorIsntReceivingShit
    expr: rate(otelcol_receiver_accepted_spans_total[5m]) == 0
    for: 1m  # Don't wait 5 minutes when spans stop flowing
    labels:
      severity: critical
    annotations:
      summary: "Collector stopped receiving spans - everything is probably fucked"

  - alert: JaegerIsChoking  
    expr: up{job="jaeger-query"} == 0
    for: 30s  # Jaeger goes down fast
    labels:
      severity: critical
    annotations:
      summary: "Jaeger is down - no trace queries will work"

  - alert: CollectorMemoryLeaking
    expr: container_memory_usage_bytes{pod=~".*otel-collector.*"} > 1500000000  # 1.5GB
    for: 2m
    labels:
      severity: warning
    annotations:
      summary: "Collector using too much memory - probably about to crash"

Pro tip: Use lower thresholds than you think. A 30-second outage in tracing means you're blind during incidents.

Test Your Traces Continuously (They Break Silently)

Don't trust that your tracing "just works." It doesn't. Test it constantly:

#!/bin/bash
## Trace health check that runs every 5 minutes in production

TRACE_ID="monitor-$(date +%s)-$(uuidgen | cut -d- -f1)"
ENTRY_POINT="https://api.yourcompany.com/health"

## Inject a test trace
curl -s -H "traceparent: 00-${TRACE_ID}-1234567890123456-01" "${ENTRY_POINT}" > /dev/null

## Wait for trace propagation (yes, 30 seconds - traces are slow)
sleep 30

## Check if it made it to Jaeger
TRACE_COUNT=$(curl -s "http://jaeger-query:16686/api/traces/${TRACE_ID}" | jq '.data | length')

if [ "$TRACE_COUNT" -eq 0 ]; then
    echo "ERROR: Test trace not found in Jaeger"
    curl -X POST "$SLACK_WEBHOOK" -d '{"text": "🚨 Distributed tracing is broken - test trace failed"}'
    exit 1
fi

echo "✅ Trace health check passed"

Run this every 5 minutes. If it fails, your tracing is broken and you need to fix it before the next incident.

Protect Your Application from Tracing Failures

Circuit Breaker (Because OpenTelemetry Will Hang)

gRPC Logo

OpenTelemetry can and will block your application threads when the collector is unreachable. Don't let observability kill your app.

Here's the ugly-ass circuit breaker that saved us from a collector outage:

## This looks like overkill but trust me, you need it
import threading
import time
from opentelemetry import trace

class TracingCircuitBreaker:
    def __init__(self):
        self.failure_count = 0
        self.last_failure = 0
        self.is_open = False
        self.lock = threading.Lock()
    
    def call_with_circuit_breaker(self, func, *args, **kwargs):
        with self.lock:
            # If circuit is open and enough time hasn't passed, skip tracing
            if self.is_open and (time.time() - self.last_failure) < 60:
                return None
            
            try:
                result = func(*args, **kwargs)
                self.failure_count = 0
                self.is_open = False
                return result
            except Exception as e:
                self.failure_count += 1
                self.last_failure = time.time()
                
                if self.failure_count >= 3:
                    self.is_open = True
                    print(f"Tracing circuit breaker OPEN - {e}")
                
                return None

## Use it like this:
circuit_breaker = TracingCircuitBreaker()

def safe_start_span(name):
    return circuit_breaker.call_with_circuit_breaker(
        trace.get_tracer(__name__).start_span, 
        name
    )

This prevents the classic "collector is down, application hangs for 30 seconds per request" disaster.

Don't Trust Single Points of Failure

Multiple collectors, multiple backends, multiple regions. Tracing infrastructure loves to fail:

## Collector config with backup exporter
exporters:
  jaeger/primary:
    endpoint: jaeger-us-west-2:14250
    retry_on_failure:
      enabled: true
      max_elapsed_time: 30s
  
  jaeger/backup:
    endpoint: jaeger-us-east-1:14250
    retry_on_failure:
      enabled: true
      max_elapsed_time: 30s
  
  # Local file backup for when everything is fucked
  file:
    path: /tmp/traces-backup.json

service:
  pipelines:
    traces:
      receivers: [otlp]
      processors: [batch, memory_limiter]
      exporters: [jaeger/primary, jaeger/backup, file]  # Parallel export

When the primary Jaeger goes down (and it will), your traces still get stored somewhere you can access them.

Configuration That Doesn't Suck

Collector Config That Actually Works

Forget the examples from the docs. Here's a collector config that won't fall over:

## Collector config that survives production traffic
receivers:
  otlp:
    protocols:
      grpc:
        endpoint: 0.0.0.0:4317
        max_recv_msg_size: 8388608  # 8MB - default is too small
        keepalive:
          time: 30s
          timeout: 5s
          permit_without_stream: true

processors:
  memory_limiter:
    limit_mib: 2048  # 2GB - be generous or you'll OOM
    spike_limit_mib: 512
    check_interval: 5s
  
  batch:
    timeout: 100ms  # Ship traces fast
    send_batch_size: 512
    send_batch_max_size: 1024
  
  # Drop high-cardinality attributes that kill performance
  attributes:
    actions:
    - key: user.id
      action: delete  # Don't trace user IDs - high cardinality hell
    - key: request.id  
      action: delete  # Same for request IDs

exporters:
  jaeger:
    endpoint: jaeger:14250
    tls:
      insecure: true
    retry_on_failure:
      enabled: true
      initial_interval: 1s
      max_interval: 10s
      max_elapsed_time: 60s
    sending_queue:
      enabled: true
      num_consumers: 10
      queue_size: 5000

service:
  telemetry:
    logs:
      level: warn  # Don't flood logs with debug spam
  pipelines:
    traces:
      receivers: [otlp]
      processors: [memory_limiter, attributes, batch]
      exporters: [jaeger]

## Resource limits that actually work
resources:
  limits:
    memory: 4Gi  # Don't be cheap
    cpu: 2000m
  requests:
    memory: 2Gi
    cpu: 1000m

Sampling That Doesn't Lose Important Traces

Head-based sampling is a trap. Use tail-based sampling or accept the overhead:

## Tail-based sampling that keeps the traces you actually need
processors:
  tail_sampling:
    decision_wait: 30s  # Wait longer to see if traces become interesting
    num_traces: 10000   # Buffer more traces
    expected_new_traces_per_sec: 100
    policies:
    # Always keep errors
    - name: keep_errors
      type: status_code
      status_code: {status_codes: [ERROR]}
    
    # Keep slow requests (they're usually problems)
    - name: keep_slow
      type: latency
      latency: {threshold_ms: 2000}
    
    # Keep traces with specific service calls (like payments)
    - name: keep_payments
      type: string_attribute
      string_attribute: {key: "service.name", values: ["payment-service"]}
    
    # Sample 1% of everything else
    - name: sample_rest
      type: probabilistic
      probabilistic: {sampling_percentage: 1}

This keeps the traces you'll actually need during incidents while dropping the noise. For more advanced sampling strategies, see the comprehensive sampling guide.

The Reality of Maintaining Distributed Tracing

It Requires Dedicated Ownership

Don't treat distributed tracing like logs - it needs a team that gives a shit about it. Observability infrastructure requires constant care, as documented in Google's SRE book on monitoring and Netflix's observability practices:

Know When to Give Up

Sometimes it's better to just buy a vendor solution, following the guidance in observability vendor evaluation guides and build vs buy decisions:

Honest assessment: I've seen teams spend 6 months setting up distributed tracing just to abandon it because it was too hard to maintain. Know your limits. The distributed tracing best practices guide covers team readiness considerations. Charity Majors' observability posts and Liz Fong-Jones' monitoring philosophy provide perspective on organizational readiness.

Have a Rollback Plan

When your tracing setup breaks production (and it might), you need a way out:

## Emergency tracing disable script
#!/bin/bash
echo "Disabling distributed tracing across the platform..."

## Remove OTEL environment variables from all deployments
for deployment in $(kubectl get deployments -o name); do
    kubectl patch $deployment -p '{"spec":{"template":{"spec":{"containers":[{"name":"app","env":[{"name":"OTEL_EXPORTER_OTLP_ENDPOINT","value":""}]}]}}}}'
done

echo "Distributed tracing disabled. Applications should recover in 2-3 minutes."

Keep this script handy. When tracing starts killing your application performance, disable it fast and debug later.

Look, tracing is useful when it works and a nightmare when it doesn't. Monitor the hell out of it and always have a way to kill it when it starts murdering your app performance. The OpenTelemetry community best practices, CNCF observability landscape, and production readiness checklists provide frameworks for sustainable observability operations.

Real Questions From Engineers Who've Been There

Q

Why did my traces just disappear after upgrading Kubernetes?

A

Because Kubernetes broke your DNS again.

Check if your collector service name changed during the upgrade

  • Kubernetes loves to fuck with DNS during version changes. Run kubectl get svc -n observability and see if otel-collector is still there. If not, your environment variables are pointing to nothing. This is a known operator issue with DNS resolution.

Also check if the network policies changed. Kubernetes 1.25+ tightened network security and probably blocked your trace export ports. Test with: kubectl exec -it app-pod -- telnet otel-collector 4317.

Q

My payment service spans vanish but everything else works - what gives?

A

Your payment service is probably hitting external APIs that don't forward trace headers.

Stripe, Pay

Pal, most payment processors

  • they don't give a shit about your observability. The trace ends there.Quick fix: manually create spans around external API calls.

Don't expect automatic instrumentation to magically trace through third-party services.python# Do this around external API calls:with tracer.start_as_current_span("stripe_payment"): stripe.Charge.create(amount=1000, currency='usd', source=token) # Trace continues after external call

Q

The collector keeps crashing with OOMKilled - what's wrong with my config?

A

You set the memory limit too low or you have a memory leak.

Check collector version first

  • versions 0.89.0 through 0.90.2 have known memory leaks. Upgrade to 0.91.0+.If you're on a good version, increase memory limits. Don't trust the "512MB is enough" bullshit from the docs. Real production traffic needs 2GB minimum:yamlresources: limits: memory: 4Gi # This is reality requests: memory: 2Gi
Q

Why are my Go services missing database spans?

A

Go database instrumentation is broken by default.

The auto-instrumentation doesn't hook into database/sql properly half the time. You need manual instrumentation:go// Don't trust automatic instrumentation for database callsimport "go.opentelemetry.io/contrib/instrumentation/database/sql/otelsql"// Wrap your database driverdb, err := otelsql.Open("postgres", dsn)Also check if you're using a connection pool

  • some pools break context propagation.
Q

My traces show child spans finishing before parent spans - is my system fucked?

A

Your clocks are fucked, not your system.

Kubernetes nodes don't sync clocks by default. Check clock skew:bash# Run on each node:kubectl get nodes -o widefor node in $(kubectl get nodes -o name | cut -d/ -f2); do echo "Node: $node" kubectl debug node/$node -it --image=busybox -- datedoneIf you see more than 1 second difference, configure NTP on your nodes. Clock skew makes traces unreadable.

Q

Jaeger says "no traces found" but I know there are traces - what's broken?

A

Jaeger's UI is lying to you. Use the API directly:bash# Test if traces actually exist:curl "http://jaeger-query:16686/api/services"# If this returns an empty list, no traces made it to storage# Check specific service:curl "http://jaeger-query:16686/api/traces?service=your-service&limit=100"Common causes:

  • Cassandra/Elasticsearch is full (check disk space)
  • Clock skew made Jaeger think traces are from the future
  • Wrong service name in search (case sensitive)
Q

My Node.js app hangs for 30 seconds when the collector is down - how do I fix this?

A

OpenTelemetry Node.js has shit timeout defaults. It'll block your event loop waiting for the collector. Fix the timeout:javascript// Set aggressive timeouts so your app doesn't hang:const { NodeSDK } = require('@opentelemetry/sdk-node');const sdk = new NodeSDK({ // Don't let tracing kill your app instrumentations: [], traceExporter: { timeout: 5000, // 5 second timeout, not 30 headers: {}, }});Better yet, use a circuit breaker around tracing exports.

Q

Why are my Django database queries not showing up in traces?

A

Django 4.0+ broke automatic database span creation. The ORM changed how it handles connection pooling and the OpenTelemetry hooks don't work anymore.Manual fix:python# Add this to your Django middleware:from opentelemetry.instrumentation.django import DjangoInstrumentorfrom opentelemetry.instrumentation.psycopg2 import Psycopg2InstrumentorDjangoInstrumentor().instrument()Psycopg2Instrumentor().instrument() # Or whatever DB driver you use

Q

My traces are complete but slow queries don't show up - what's missing?

A

Your sampling is dropping slow traces because the sampling decision happens before the query executes.

Head-based sampling is a trap for catching performance problems. The OpenTelemetry sampling documentation explains why tail-based sampling is better for debugging.

Switch to tail-based sampling that keeps slow traces:```yamlprocessors: tail_sampling: policies:

  • name: keep_slow_queries type: latency latency: {threshold_ms: 1000} # Keep anything > 1s```
Q

The OpenTelemetry agent makes my Java app start 30 seconds slower - is this normal?

A

Unfortunately, yes. The Java agent is a pig during startup. It instruments every class and dependency. For production, you can speed it up:bash# Faster startup (but less coverage):-javaagent:opentelemetry-javaagent.jar-Dotel.javaagent.exclude-classes="com.sun.*,sun.*,org.apache.commons.*"Or switch to manual instrumentation for critical services.

Q

My collector config changes require restarts even though docs say hot reload works - why?

A

Because hot reload is mostly bullshit. It works for like 3 settings (log level, some processor configs). Everything else needs a restart:

  • Receiver endpoints
  • Exporter configurations
  • Pipeline changes
  • Memory limitsJust restart the collector. It takes 10 seconds and actually works.
Q

Why do my Lambda traces never connect to my API Gateway traces?

A

Because AWS Lambda doesn't propagate trace context automatically between services. The Lambda runtime breaks OpenTelemetry context propagation.You need to manually extract and inject trace context in your Lambda handler:python# Extract from API Gateway eventfrom opentelemetry.propagate import extractdef lambda_handler(event, context): # Extract trace context from headers carrier = event.get('headers', {}) ctx = extract(carrier) # Your Lambda code here with proper context

Q

My traces work fine in staging but break in production - what's different?

A

Production has network policies, firewalls, and load balancers that staging doesn't. Common production-only issues:

  • Load balancer strips trace headers (configure header forwarding)
  • Firewall blocks collector ports 4317/4318
  • Service mesh policies prevent cross-namespace tracing
  • Production has higher traffic that overwhelms collectorsTest in production-like environments or you'll get surprised.

Related Tools & Recommendations

integration
Recommended

GitOps Integration Hell: Docker + Kubernetes + ArgoCD + Prometheus

How to Wire Together the Modern DevOps Stack Without Losing Your Sanity

prometheus
/integration/docker-kubernetes-argocd-prometheus/gitops-workflow-integration
100%
integration
Recommended

Kafka + MongoDB + Kubernetes + Prometheus Integration - When Event Streams Break

When your event-driven services die and you're staring at green dashboards while everything burns, you need real observability - not the vendor promises that go

Apache Kafka
/integration/kafka-mongodb-kubernetes-prometheus-event-driven/complete-observability-architecture
88%
integration
Recommended

Prometheus + Grafana + Jaeger: Stop Debugging Microservices Like It's 2015

When your API shits the bed right before the big demo, this stack tells you exactly why

Prometheus
/integration/prometheus-grafana-jaeger/microservices-observability-integration
74%
howto
Recommended

Set Up Microservices Monitoring That Actually Works

Stop flying blind - get real visibility into what's breaking your distributed services

Prometheus
/howto/setup-microservices-observability-prometheus-jaeger-grafana/complete-observability-setup
53%
integration
Recommended

OpenTelemetry + Jaeger + Grafana on Kubernetes - The Stack That Actually Works

Stop flying blind in production microservices

OpenTelemetry
/integration/opentelemetry-jaeger-grafana-kubernetes/complete-observability-stack
49%
integration
Recommended

RAG on Kubernetes: Why You Probably Don't Need It (But If You Do, Here's How)

Running RAG Systems on K8s Will Make You Hate Your Life, But Sometimes You Don't Have a Choice

Vector Databases
/integration/vector-database-rag-production-deployment/kubernetes-orchestration
38%
tool
Recommended

Datadog Cost Management - Stop Your Monitoring Bill From Destroying Your Budget

integrates with Datadog

Datadog
/tool/datadog/cost-management-guide
29%
pricing
Recommended

Datadog vs New Relic vs Sentry: Real Pricing Breakdown (From Someone Who's Actually Paid These Bills)

Observability pricing is a shitshow. Here's what it actually costs.

Datadog
/pricing/datadog-newrelic-sentry-enterprise/enterprise-pricing-comparison
29%
pricing
Recommended

Datadog Enterprise Pricing - What It Actually Costs When Your Shit Breaks at 3AM

The Real Numbers Behind Datadog's "Starting at $23/host" Bullshit

Datadog
/pricing/datadog/enterprise-cost-analysis
29%
alternatives
Recommended

Docker Alternatives That Won't Break Your Budget

Docker got expensive as hell. Here's how to escape without breaking everything.

Docker
/alternatives/docker/budget-friendly-alternatives
28%
compare
Recommended

I Tested 5 Container Security Scanners in CI/CD - Here's What Actually Works

Trivy, Docker Scout, Snyk Container, Grype, and Clair - which one won't make you want to quit DevOps

docker
/compare/docker-security/cicd-integration/docker-security-cicd-integration
28%
tool
Recommended

Grafana - The Monitoring Dashboard That Doesn't Suck

integrates with Grafana

Grafana
/tool/grafana/overview
28%
tool
Recommended

New Relic - Application Monitoring That Actually Works (If You Can Afford It)

New Relic tells you when your apps are broken, slow, or about to die. Not cheap, but beats getting woken up at 3am with no clue what's wrong.

New Relic
/tool/new-relic/overview
27%
tool
Recommended

Honeycomb - Debug Your Distributed Systems Without Losing Your Mind

integrates with Honeycomb

Honeycomb
/tool/honeycomb/overview
27%
integration
Recommended

Connecting ClickHouse to Kafka Without Losing Your Sanity

Three ways to pipe Kafka events into ClickHouse, and what actually breaks in production

ClickHouse
/integration/clickhouse-kafka/production-deployment-guide
27%
integration
Recommended

ELK Stack for Microservices - Stop Losing Log Data

How to Actually Monitor Distributed Systems Without Going Insane

Elasticsearch
/integration/elasticsearch-logstash-kibana/microservices-logging-architecture
27%
troubleshoot
Recommended

Your Elasticsearch Cluster Went Red and Production is Down

Here's How to Fix It Without Losing Your Mind (Or Your Job)

Elasticsearch
/troubleshoot/elasticsearch-cluster-health-issues/cluster-health-troubleshooting
27%
integration
Recommended

Kafka + Spark + Elasticsearch: Don't Let This Pipeline Ruin Your Life

The Data Pipeline That'll Consume Your Soul (But Actually Works)

Apache Kafka
/integration/kafka-spark-elasticsearch/real-time-data-pipeline
27%
tool
Recommended

Zipkin - Distributed Tracing That Actually Works

alternative to Zipkin

Zipkin
/tool/zipkin/overview
26%
tool
Recommended

Apache Cassandra - The Database That Scales Forever (and Breaks Spectacularly)

What Netflix, Instagram, and Uber Use When PostgreSQL Gives Up

Apache Cassandra
/tool/apache-cassandra/overview
26%

Recommendations combine user behavior, content similarity, research intelligence, and SEO optimization