What Makes Apache Cassandra Different from Other Databases

Cassandra Ring Architecture

Cassandra ditched the master-slave bullshit that kills most databases at scale. While PostgreSQL and MySQL still rely on primary-replica setups that become bottlenecks, Cassandra uses a peer-to-peer distributed system where every node can handle reads and writes without choking.

Cassandra Ring Architecture

The Ring Architecture That Actually Works

Cassandra Node Architecture

Cassandra Consistent Hashing Ring

Cassandra's ring topology means no single node can kill your entire cluster. Data gets distributed using consistent hashing - each node owns a range of partition keys based on hash values. When you need to scale, you just add nodes and the ring rebalances automatically.

When you write data, Cassandra figures out which nodes get replicas based on your replication strategy. No central coordinator to become a bottleneck. Any node can coordinate operations for any piece of data.

Storage-Attached Indexes: Finally, Queries That Don't Suck

With Cassandra 5.0.5 released August 5, 2025, Storage-Attached Indexes (SAI) finally killed the "model your data for your queries" prison. Before SAI, you needed separate Elasticsearch clusters just to run basic multi-column queries.

SAI lets you:

  • Query multiple columns without full table scans that timeout
  • Build apps with flexible query patterns instead of designing 47 different tables
  • Skip the upfront data modeling nightmare that made Cassandra unusable for most teams
  • Replace external search systems like Solr or Elasticsearch for many use cases

CAP Theorem: Why Cassandra Chooses Availability Over Your Sanity

Cassandra picks Availability and Partition tolerance over strict Consistency in the CAP theorem. This means your data might be eventually consistent instead of immediately consistent like PostgreSQL ACID transactions.

But Cassandra offers tunable consistency - you can dial in the right balance per query:

  • ONE: Fast but might return stale data if nodes are out of sync
  • QUORUM: Most common choice - majority of replicas must respond
  • ALL: Strong consistency but kills availability when nodes fail
  • LOCAL_QUORUM: Consistency within a datacenter only

You can even set different consistency levels for different queries in the same application.

Real-World Scale: What Netflix and Instagram Actually Do

Netflix's Cassandra implementation handles massive scale without the drama:

Instagram's engineering team reduced read latency by 10x using custom compaction strategies and improved caching.

Trie Structures: 40% Less Memory Waste

Cassandra 5.0's **Trie memtables and SSTables** cut memory usage by up to 40% without code changes. The Trie data structures share common prefixes instead of storing duplicate data like idiots.

For large datasets, this means lower AWS bills and faster queries. The memory savings are automatic - no tuning required.

Java 17: 20% Performance Boost (If You Survive the Migration)

Java 17 support delivers up to 20% performance improvements, mainly from better garbage collection. But the migration from Java 8/11 will break your existing heap configs:

## Old Java 8/11 configs that worked:
-Xms8G -Xmx8G -XX:NewRatio=3

## Java 17 configs that actually work:
-Xms16G -Xmx16G --add-exports java.base/jdk.internal.misc=ALL-UNNAMED

Java 17 benefits include:

The migration guide covers the heap tuning nightmare.

Getting Started with Apache Cassandra: From Zero to Production Nightmare

Deploying Cassandra isn't like installing PostgreSQL where you run apt install and you're done. This beast requires understanding distributed system principles or you'll break production within hours of launch.

Hardware Requirements That Won't Kill Your Budget (Immediately)

Minimum specs that won't make you hate life:

Cassandra nodes juggle client requests, gossip protocol, compaction processes, and repair operations simultaneously. Underpowered hardware means all of these will fail spectacularly.

JVM Configuration That Actually Works:

## Java 17 settings for Cassandra 5.0.5
-Xms16G -Xmx16G  # 50% of RAM, never more than 32GB
-XX:+UseG1GC     # G1GC is the only GC that won't kill you
-XX:MaxGCPauseMillis=300  # Good luck hitting this during peak load
-XX:+HeapDumpOnOutOfMemoryError  # For when (not if) you OOM
--add-exports java.base/jdk.internal.misc=ALL-UNNAMED  # Java 17 requirement

Cassandra 5.0.5's Java 17 migration breaks existing configs. Plan for heap tuning pain.

Installation: Where Dreams Go to Die

Cassandra Write Operation Flow

Installing Cassandra 5.0.5 on Linux (released August 5, 2025):

## Add repository (pray it doesn't 404)
echo \"deb https://debian.cassandra.apache.org 50x main\" | \
  sudo tee -a /etc/apt/sources.list.d/cassandra.sources.list
curl https://downloads.apache.org/cassandra/KEYS | sudo apt-key add -

## Install specific version
sudo apt update
sudo apt install cassandra=5.0.5

## Start service and hope it doesn't immediately crash
sudo systemctl start cassandra
sudo systemctl enable cassandra

## Check if it actually started
sudo systemctl status cassandra

Docker deployment (less painful):

## Single node for development
docker run -d --name cassandra -p 9042:9042 cassandra:5.0.5

## Check logs when it inevitably fails
docker logs cassandra

Kubernetes with K8ssandra (for masochists):

## Add K8ssandra Helm repo
helm repo add k8ssandra https://helm.k8ssandra.io

## Deploy and pray
helm install k8ssandra k8ssandra/k8ssandra

cassandra.yaml Config That Won't Immediately Explode:

## Don't use 'Test Cluster' in production like an amateur
cluster_name: 'Production Cluster'

## Storage paths (separate commit log disk or die)
data_file_directories:
    - /var/lib/cassandra/data
commitlog_directory: /var/lib/cassandra/commitlog  # Put on fast SSD!

## Memory tuning for 64GB servers
memtable_heap_space_in_mb: 8192
memtable_offheap_space_in_mb: 8192

## Network - use actual server IP, not localhost
listen_address: 192.168.1.100  # Internal cluster communication
rpc_address: 0.0.0.0           # Client connections
native_transport_port: 9042     # CQL port

## Token distribution
num_tokens: 256  # Default, don't change unless you know why

Data Modeling: Where SQL Dreams Come to Die

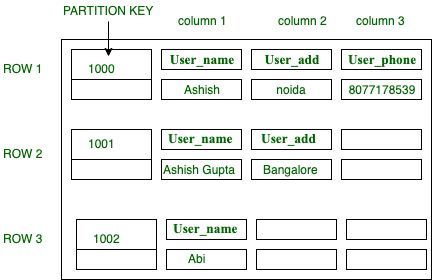
Cassandra Data Modeling Principles:

Cassandra data modeling breaks everything you know about databases. Forget database normalization - that shit doesn't work here. The rule is \"model your data for your queries\" which means designing tables around how you'll query them, not how the data "should" be organized.

Key concepts that will make you question your career:

Primary Key Design (Get This Wrong and Suffer):

-- Time-series data modeling that won't kill performance
CREATE TABLE user_events (
    user_id UUID,
    event_date DATE,      -- Time bucketing to prevent massive partitions
    event_time TIMESTAMP,
    event_type TEXT,
    event_data JSON,      -- New in Cassandra 5.0
    PRIMARY KEY ((user_id, event_date), event_time)
);

This design follows Cassandra best practices:

CQL: SQL's Disappointing Cousin

CQL looks like SQL but acts like a psychopath. JOINs don't exist, transactions are limited, and WHERE clauses require the partition key or Cassandra tells you to fuck off.

Queries That Actually Work:

-- Query by partition key (fast)
SELECT * FROM user_events 
WHERE user_id = 550e8400-e29b-41d4-a716-446655440000 
  AND event_date = '2025-08-25';

-- Range query within partition (still fast)
SELECT * FROM user_events 
WHERE user_id = 550e8400-e29b-41d4-a716-446655440000 
  AND event_date = '2025-08-25'
  AND event_time > '2025-08-25 10:00:00';

-- SAI index query (finally works in 5.0.5)
CREATE INDEX ON user_events (event_type) USING 'sai';
SELECT * FROM user_events 
WHERE event_type = 'purchase' 
  AND user_id = 550e8400-e29b-41d4-a716-446655440000;

Queries That Will Fuck You:

-- This will timeout and ruin your weekend
SELECT * FROM user_events WHERE event_type = 'purchase';
-- Error: Cannot execute this query as it might involve data filtering

-- This will scan everything and die
SELECT * FROM user_events;
-- Prepare for 30-second timeouts

-- Updates without partition key = data corruption
UPDATE user_events SET event_data = 'corrupted' WHERE event_type = 'login';
-- Good luck finding which records got fucked

-- DELETE on large partitions = performance death
DELETE FROM user_events WHERE user_id = 'some-uuid' AND event_date < '2025-01-01';
-- Kiss your cluster goodbye for the next 2 hours

Read the CQL documentation or prepare for pain.

Cluster Setup: Where Distributed Systems Expertise Goes to Die

Setting up a multi-node Cassandra cluster requires understanding network topology, failure domains, and gossip protocols. Get any of this wrong and you'll have split-brain scenarios at 3am.

Cassandra Multi-Datacenter Architecture

Cassandra Network Topology Strategy

Three-Node Cluster (Minimum for Not Losing Data):

## Node 1 - Seed node configuration
seeds: \"cassandra1.example.com,cassandra2.example.com\"  # Multiple seeds for redundancy
listen_address: cassandra1.example.com  # Internal communication
rpc_address: cassandra1.example.com     # Client connections
endpoint_snitch: GossipingPropertyFileSnitch  # For multi-DC

## Node 2 - Also a seed node
seeds: \"cassandra1.example.com,cassandra2.example.com\"
listen_address: cassandra2.example.com
rpc_address: cassandra2.example.com
endpoint_snitch: GossipingPropertyFileSnitch

## Node 3 - Regular node
seeds: \"cassandra1.example.com,cassandra2.example.com\"
listen_address: cassandra3.example.com
rpc_address: cassandra3.example.com
endpoint_snitch: GossipingPropertyFileSnitch

Don't make all nodes seeds - 2-3 seed nodes maximum or gossip becomes a shitshow.

Checking if Your Cluster is Fucked:

## Most important command you'll ever run
nodetool status

## What healthy looks like (spoiler: yours won't)
## Status=Up/Down, State=Normal/Leaving/Joining/Moving  
## Address       Load    Tokens  Owns    Host ID    Rack
## UN  10.0.1.10  2.5TB   256     33.3%   abc-123    rack1
## UN  10.0.1.11  2.4TB   256     33.3%   def-456    rack1  
## UN  10.0.1.12  2.6TB   256     33.4%   ghi-789    rack1

## What disaster looks like
## DN  10.0.1.10  2.5TB   256     33.3%   abc-123    rack1  # DOWN/NORMAL = node died
## UL  10.0.1.11  2.4TB   256     33.3%   def-456    rack1  # UP/LEAVING = node leaving cluster
## UJ  10.0.1.12  0       256     33.4%   ghi-789    rack1  # UP/JOINING = bootstrapping

If you see anything other than "UN" (Up/Normal), start panicking.

Monitoring: JMX Hell and Nodetool Salvation

Cassandra Monitoring Dashboard Setup:

Cassandra monitoring is like drinking from a firehose. JMX metrics provide thousands of data points but zero useful error messages when things break. The nodetool utility is your lifeline to understanding what's actually happening.

Cassandra Monitoring Architecture

Commands That Might Save Your Weekend:

## Check thread pool stats (first sign of trouble)
nodetool tpstats
## Look for \"pending\" - anything > 0 means you're in trouble

## Compaction status (death spiral detector)
nodetool compactionstats
## If pending compactions > 32, cancel your vacation

## Repair operations (the never-ending story)
nodetool repair keyspace_name
## This will take hours and might break more things

## Gossip info (who's talking to whom)
nodetool gossipinfo
## Tells you which nodes think they're in the cluster

## Disk usage by keyspace (storage explosion tracker)
nodetool cfstats keyspace_name | grep \"Space used\"
## Because Cassandra eats disk space like candy

Essential monitoring integrations:

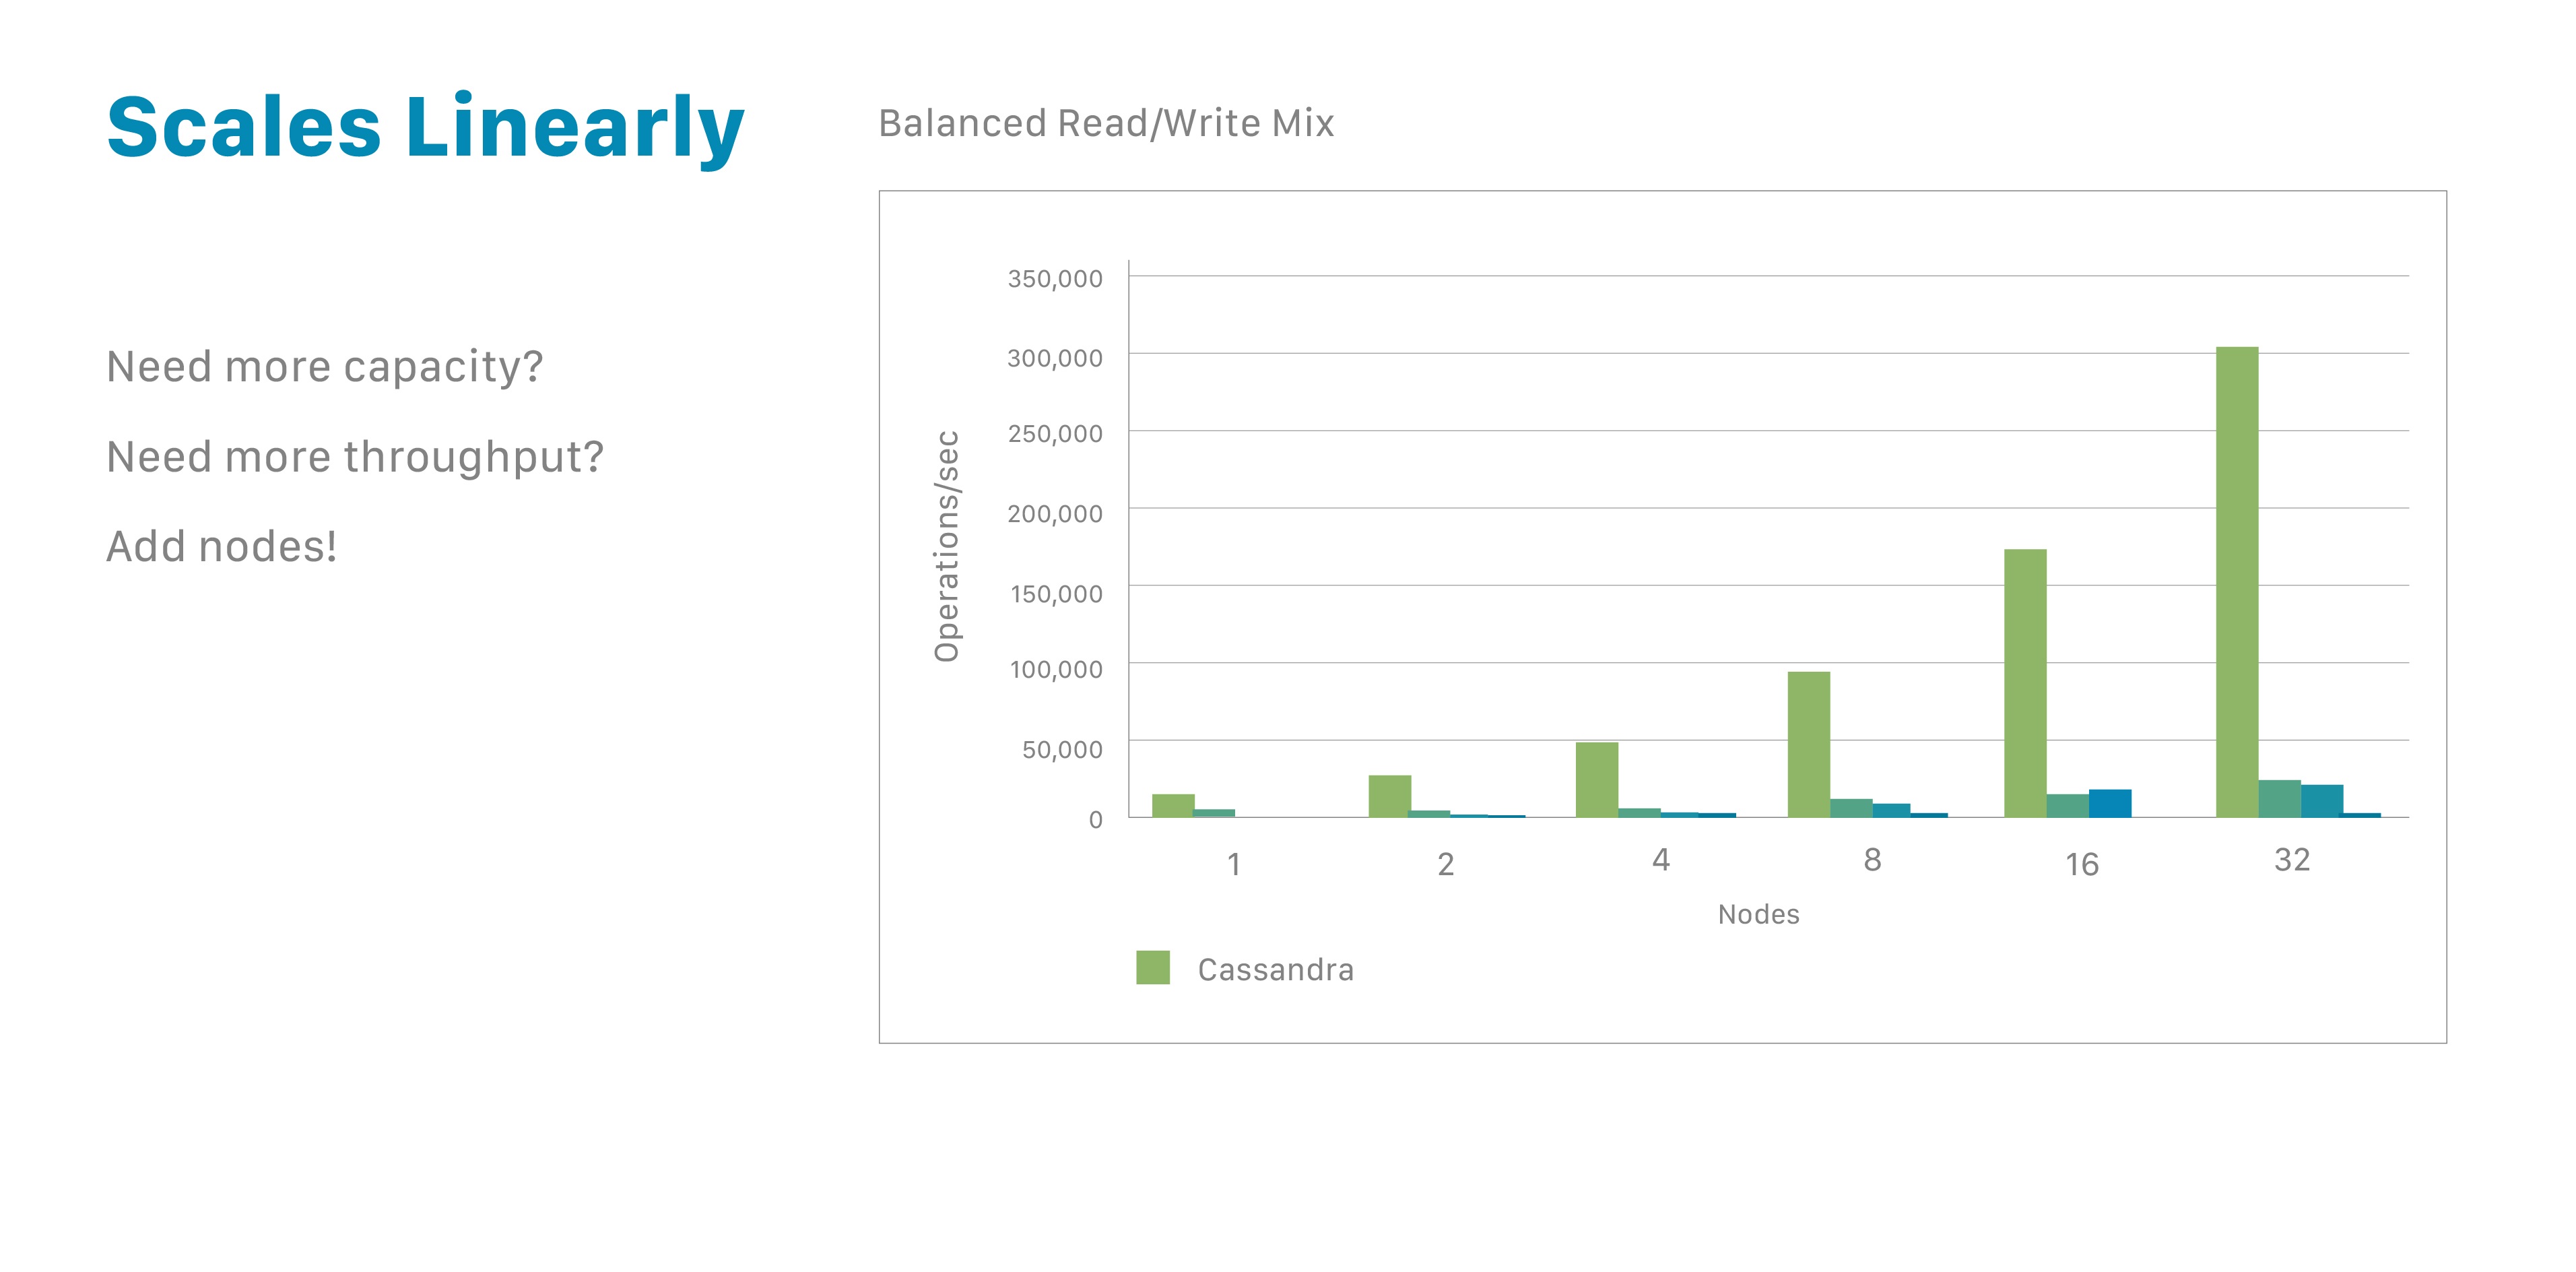
Moving Cassandra to production isn't just about scaling - it's about accepting that you'll need dedicated platform engineers who understand distributed systems. Budget for 24/7 monitoring, comprehensive alerting, and the knowledge that 3am database emergencies are now part of your life.

Success with Cassandra requires proper capacity planning, monitoring that actually helps, and acceptance that distributed systems expertise isn't optional - it's survival.

Database Feature Comparison

Feature

Apache Cassandra 5.0

MongoDB 8.0

PostgreSQL 17

MySQL 8.4

Architecture & Scaling

Distribution Model

Masterless peer-to-peer ring

Master-slave with sharding

Master-slave with read replicas

Master-slave with read replicas

Horizontal Scaling

Native, linear scaling

Automatic sharding

Manual sharding/partitioning

Manual sharding

Single Point of Failure

None (fully distributed)

MongoDB nodes can fail

Master node dependency

Master node dependency

Global Distribution

Multi-datacenter native

Replica sets across regions

Streaming replication

MySQL Cluster (complex)

Data Model & Flexibility

Schema Design

Wide-column store

Document-based JSON

Relational tables + JSONB

Relational tables + JSON

Query Flexibility

CQL + SAI indexes (5.0)

Rich query language

Full SQL with extensions

Standard SQL

Secondary Indexes

Storage-Attached Indexes

Compound indexes

B-tree, GiST, GIN, BRIN

B-tree, Hash, Full-text

Complex Queries

Limited (partition-focused)

Aggregation pipelines

Complex JOINs, CTEs

JOINs, subqueries

Performance Characteristics

Write Performance

Excellent (log-structured)

Good (WiredTiger)

Good (WAL-based)

Good (InnoDB)

Read Performance

Good (with proper modeling)

Good (indexed queries)

Excellent (mature optimizer)

Good (query cache)

Analytical Queries

Limited (requires modeling)

Aggregation framework

Excellent (window functions)

Limited (basic aggregation)

Concurrent Users

Very high (distributed load)

High (connection pooling)

High (with connection pooling)

Very high (thread pooling)

Consistency & Transactions

Consistency Model

Tunable (eventual to strong)

Strong consistency

ACID compliant

ACID compliant

Transaction Support

Lightweight transactions

Multi-document transactions

Full ACID transactions

Full ACID transactions

Isolation Levels

Read committed equivalent

Read committed/snapshot

Four standard levels

Four standard levels

CAP Theorem Position

AP (tunable to CP)

CP (with replica sets)

CP (with synchronous replication)

CP (traditional RDBMS)

Operational Complexity

Setup Difficulty

High (distributed system)

Medium (replica set setup)

Low (single instance)

Low (single instance)

Monitoring Requirements

JMX metrics, nodetool

Compass, MongoDB Atlas

pg_stat, extensions

Performance Schema

Backup Strategy

Incremental snapshots

mongodump, Ops Manager

pg_dump, WAL archiving

mysqldump, binary logs

Maintenance Overhead

High (cluster operations)

Medium (balancer management)

Low-Medium (vacuum tuning)

Low (mostly automatic)

Failure Recovery

Node Failure Handling

Automatic (ring topology)

Automatic (replica sets)

Manual failover required

Manual failover required

Data Recovery

Anti-entropy repair

Automatic sync

Point-in-time recovery

Binary log recovery

Network Partitions

Continues operating

May lose availability

Requires manual intervention

Requires manual intervention

Split-brain Prevention

Gossip protocol consensus

Replica set majority

Not applicable (single master)

Not applicable (single master)

Development & Learning Curve

Developer Familiarity

Steep (new paradigms)

Moderate (JSON-like)

Low (SQL knowledge)

Low (SQL knowledge)

Documentation Quality

Good but technical

Excellent and accessible

Excellent and comprehensive

Good and extensive

Community Support

Strong but specialized

Very strong

Excellent

Excellent

Training Resources

DataStax Academy, sparse

MongoDB University

Extensive tutorials

Abundant resources

Cost & Licensing

License

Apache 2.0 (truly free)

SSPL (service restrictions)

PostgreSQL (permissive)

GPL with commercial option

Cloud Managed Options

Keyspaces, Astra DB

Atlas, DocumentDB

RDS, Cloud SQL

RDS, Cloud SQL

Enterprise Support

DataStax, Instaclustr

MongoDB Inc.

Multiple vendors

Oracle Corporation

Total Cost (3 years, medium)

80,000-140,000

60,000-120,000

50,000-100,000

40,000-80,000

Use Case Fit

Best For:

Primary Scenarios

IoT data ingestion

Content management

Business applications

Web applications

Time-series storage

Real-time analytics

Financial systems

E-commerce platforms

Global applications

Catalog systems

Reporting systems

Content management

Write-heavy workloads

Rapid prototyping

Data warehousing

OLTP systems

Avoid When:

Poor Fit Scenarios

Complex business logic

Strong consistency needs

Massive horizontal scale

Complex analytical queries

Ad-hoc reporting

Small single-region apps

Global distribution

Real-time analytics

Small datasets

Financial transactions

High write volumes

Schemaless requirements

Tight budgets

Simple CRUD operations

Rapid schema evolution

IoT sensor data

Production Operations: Welcome to Distributed Hell

Unified Compaction Strategy (UCS) Overview:

Running Cassandra in production is like managing a nuclear reactor - everything works fine until it doesn't, and when it breaks, it breaks spectacularly across multiple nodes simultaneously. Unlike PostgreSQL where you optimize one server, Cassandra failures cascade through distributed systems in ways that make senior engineers cry.

Compaction Strategies: The Reason You Can't Sleep

Compaction Reality Check:
Compaction is Cassandra's way of merging SSTables to keep reads from being unusably slow. Choose the wrong compaction strategy and your cluster becomes a very expensive space heater.

Cassandra 5.0.5's Unified Compaction Strategy (UCS) is supposed to be "autopilot" for compaction. In reality, it's like Tesla's autopilot - works great until it drives you into a tree.

Compaction Strategies That Will Ruin Your Life:

Signs Your Compaction is Fucked:

## Pending compactions (disaster threshold = 32)
nodetool compactionstats
## If pending > 32, start cancelling weekend plans

## Compaction thread pool status
nodetool tpstats | grep -A 5 "CompactionExecutor"
## "Pending" should be 0, "Active" should be < core count

## SSTable explosion detector
nodetool cfstats keyspace.table | grep "SSTable count"
## > 1000 SSTables = compaction death spiral

## Nuclear option when compaction is stuck
nodetool stop COMPACTION
nodetool compact keyspace table  # This will take hours

Memory Management: JVM Tuning Hell

JVM Garbage Collection Tuning for Cassandra:

Heap Sizing That Won't Kill You:
Cassandra 5.0.5 with Java 17 wants 50% of RAM for heap, maxed at 32GB. Go beyond 32GB and compressed OOPs shit the bed, making everything slower.

G1GC Settings That Might Not Crash:

## G1GC configuration for Cassandra 5.0.5 + Java 17
-XX:+UseG1GC
-XX:MaxGCPauseMillis=300  # Good luck hitting this under load
-XX:G1HeapRegionSize=16m  # Don't change this randomly
-XX:G1NewSizePercent=20
-XX:G1MaxNewSizePercent=30
-XX:G1MixedGCCountTarget=8
-XX:InitiatingHeapOccupancyPercent=45
-XX:+PrintGC  # You'll need these logs when things break
-XX:+PrintGCDetails
-XX:+PrintGCTimeStamps

Check Cassandra GC tuning guide before your heap explodes.

Off-Heap Config That Won't Explode:

## cassandra.yaml memory settings
memtable_offheap_space_in_mb: 8192  # Match your heap size
row_cache_size_in_mb: 0  # Row cache is poison in production
counter_cache_size_in_mb: null  # Let Cassandra calculate this

Trie memtables in 5.0.5 save 40% memory automatically. No configuration required - just works.

Network Tuning: Because Split-Brain is Real

Gossip Protocol Settings (Critical):

## Prevent false node failures
phi_convict_threshold: 12  # Default 8 is too sensitive for cloud
streaming_connections_per_host: 4  # Bootstrap/repair parallelism  
stream_throughput_outbound_megabits_per_sec: 200  # Don't saturate network
inter_dc_stream_throughput_outbound_megabits_per_sec: 200  # Multi-DC streaming

Gossip failures cause split-brain scenarios that require manual intervention.

Client Connection Tuning:

## CQL native transport settings
native_transport_max_threads: 128  # Match CPU cores
native_transport_max_frame_size_in_mb: 256  # For large queries
native_transport_max_concurrent_connections: -1  # Unlimited
native_transport_max_concurrent_connections_per_ip: -1  # No per-IP limit

## Request timeout settings
read_request_timeout_in_ms: 5000   # 5 second read timeout
write_request_timeout_in_ms: 2000  # 2 second write timeout
range_request_timeout_in_ms: 10000 # 10 second range scan timeout

Monitoring: Drowning in Metrics, Starving for Insights

Cassandra Storage Engine Components

The Metrics Firehose:
Cassandra exposes hundreds of JMX metrics through MBeans but gives you zero useful error messages when shit breaks. You'll need tools like DataDog, Prometheus + Grafana, or New Relic to make sense of the chaos.

Metrics That Actually Matter When You're Fucked:

  1. "Is My Cluster Dead?" Indicators:

    • Node status (UP/DOWN) - anything not "UN" is bad news
    • Load distribution imbalance > 20% means hot spots
    • Pending compactions > 32 = weekend ruined
    • Read latency P99 > 100ms = users complaining
  2. "Why is Everything Slow?" Metrics:

  3. "How Fucked Are We?" Operations:

Commands for 3AM Debugging Sessions:

## Watch performance metrics in real-time
watch -n 5 'nodetool tpstats | head -20'
## Look for "pending" != 0 in any pool

## Disk usage by keyspace (storage explosion detector)
nodetool cfstats | grep -E "(Keyspace|Space used)" | head -20
## If usage growing 10GB/day, investigate immediately

## Gossip status (who's talking to whom)
nodetool gossipinfo | grep -E "STATUS|LOAD" | head -10
## NORMAL/UP is good, anything else is clusterfuck

## GC statistics (heap death spiral)
nodetool gcstats
## GC frequency > 10/sec = heap pressure

## Check for dying nodes
nodetool status | grep -v "UN"
## Empty output = healthy cluster, anything else = problems

Repair Operations: The Never-Ending Story

Why Repair is Your New Religion:
Cassandra's eventual consistency means data slowly gets out of sync across replicas. Repair operations fix this, but they're slow, resource-intensive, and can break more things than they fix.

Repair Strategies That Won't Kill Your Cluster:

## Full repair (nuclear option, takes forever)
nodetool repair keyspace_name
## Will saturate network for hours, use sparingly

## Incremental repair (less painful)
nodetool repair -inc keyspace_name
## Still slow but won't murder your I/O

## Subrange repair for massive clusters
nodetool repair -st 0 -et 1000000000000000000 keyspace_name table_name
## Repair specific token ranges to limit impact

## Check repair status (because it will fail)
nodetool compactionstats | grep -i repair

## Kill runaway repairs
nodetool stop REPAIR

Consistency Levels for Different Levels of Paranoia:

  • LOCAL_ONE: Fast but might return stale data
  • LOCAL_QUORUM: Most common choice for single DC
  • EACH_QUORUM: For multi-DC consistency (slower)
  • ALL: Don't use this unless you enjoy downtime

Capacity Planning: Math That Will Bankrupt You

Storage Reality Check:
That 1TB of data you think you need? Plan for 3-4TB minimum:

I/O Optimization (Avoid Disk Death):

Network Bandwidth (Don't Underestimate This):

Troubleshooting: Common Production Disasters

When Reads Become Unusably Slow:

  1. Massive partitions: nodetool cfstats | grep "Maximum row"
  2. Tombstone hell: nodetool cfstats | grep "Tombstones"
    • 90% tombstones = scanning digital graveyards
  3. Query anti-patterns: ALLOW FILTERING in production = career suicide
  4. Wrong consistency levels: ALL reads + flaky nodes = timeout hell

When Writes Start Choking:

  1. Commit log I/O: Separate fast SSD or suffer 10x write latency
  2. Memory pressure: GC storms = undersized heap or shitty data model
  3. Compaction death spiral: Pending compactions > 32 = no more writes
  4. Batch abuse: Giant batches = cluster suicide

Node Death Recovery (The Fun Part):

## Check cluster status
nodetool status
## Look for "DN" (Down/Normal) or "DL" (Down/Leaving)

## Remove dead node from cluster
nodetool removenode <failed_node_host_id>
## Get host_id from nodetool status output

## Replace dead node procedure:
## 1. Install Cassandra on new hardware
## 2. Configure cassandra.yaml with same cluster_name
## 3. Add replace_address: <dead_node_ip> to cassandra.yaml
## 4. Start Cassandra (this will trigger streaming)
## 5. Remove replace_address after bootstrap completes

## Force rebuild from other DC
nodetool rebuild <source_datacenter_name>

The Reality of Production Cassandra:

Running Cassandra is like operating a nuclear plant - immense power when it works, Chernobyl when it doesn't. The distributed nature means failures cascade across nodes in ways that make PostgreSQL problems look quaint.

You need:

Most successful Cassandra teams learned through battle scars, not certification courses. They've debugged token range corruption, manually fixed gossip state, and run repair operations that lasted longer than some Hollywood marriages.

If you can't afford that level of operational masochism, stick with PostgreSQL and preserve your sanity.

Frequently Asked Questions

Q

What is Apache Cassandra and when should I use it?

A

Apache Cassandra is a distributed NoSQL wide-column database designed for handling large amounts of data across multiple servers with no single point of failure.

Use Cassandra when you need:

  • Linear horizontal scaling across multiple nodes or datacenters
  • High write throughput (millions of operations per second)
  • 99.99%+ uptime requirements with automatic failover
  • Time-series or Io

T data storage at massive scaleCompanies like Netflix, Instagram, and Uber use Cassandra for mission-critical applications that cannot tolerate downtime.

Q

How does Cassandra's ring architecture work?

A

Cassandra uses a peer-to-peer ring topology where every node is equal and can handle both reads and writes. Data is distributed using consistent hashing, with each node responsible for a range of partition keys.When you write data, Cassandra automatically determines which nodes store replicas based on the replication strategy. There's no master node that can become a bottleneck or single point of failure

  • any node can coordinate operations for any piece of data.
Q

What's new in Apache Cassandra 5.0?

A

Cassandra 5.0, released September 2024, introduces major improvements:

  • Storage-Attached Indexes (SAI):

Revolutionary secondary indexing that allows efficient queries on non-primary key columns

  • Java 17 support: Up to 20% performance improvements with modern JVM features
  • Trie memtables: 40% reduction in memory usage without application changes
  • Unified Compaction Strategy:

Automatic optimization that adapts to workload patterns

  • Vector search capabilities: Native support for AI/ML applications with vector data types
Q

How do I handle data modeling in Cassandra?

A

Cassandra data modeling follows "design your tables for your queries" rather than normalizing data relationships.

Key principles:

  1. Partition key selection:

Choose keys that distribute data evenly across nodes 2. Clustering key ordering: Design for your query sort requirements 3. Denormalization:

Store the same data in multiple tables optimized for different queries 4. Avoid large partitions: Keep partitions under 100MB for optimal performanceWith SAI indexes in version 5.0, you have more flexibility for ad-hoc queries while maintaining performance.

Q

What are Cassandra's consistency levels and how do I choose?

A

Cassandra offers tunable consistency through configurable levels:

  • ONE:

Fastest performance, eventual consistency

  • QUORUM: Balanced consistency and availability (most common choice)
  • LOCAL_QUORUM:

Consistency within a datacenter, preferred for multi-DC setups

  • ALL: Strong consistency but reduced availability during node failuresChoose based on your application's tolerance for eventual consistency versus performance requirements. You can even set different levels for different queries.
Q

How does Cassandra compare to MongoDB and PostgreSQL?

A

Cassandra vs MongoDB:

  • Cassandra scales linearly without operational complexity; MongoDB requires careful shard key planning
  • Cassandra has no single points of failure; MongoDB has replica set primary nodes
  • MongoDB offers richer query language; Cassandra excels at predictable access patternsCassandra vs PostgreSQL:
  • PostgreSQL offers full SQL and complex joins; Cassandra requires query-specific data modeling
  • Cassandra handles massive write volumes; PostgreSQL excels at complex business logic
  • PostgreSQL has lower operational complexity; Cassandra provides better fault tolerance
Q

What are the hardware requirements for Cassandra?

A

Minimum specs that won't make you cry:

  • CPU: 8+ cores per node (16+ if you want to sleep at night during write-heavy periods)
  • RAM: 32GB bare minimum, 64GB+ if you don't want your cluster to shit the bed during compactions
  • Storage:

Fast SSD or prepare for 30-second read timeouts that'll make your users rage-quit

  • Network: Gigabit Ethernet minimum, 10GbE preferred unless you enjoy repair operations that take 3 daysJVM config that actually works in production:bash-Xms16G -Xmx16G # 50% of RAM, never more than 32GB or GC will murder you-XX:+UseG1GC # G1GC is the only thing that works reliably-XX:MaxGCPauseMillis=300 # Good luck hitting this during heavy workloadsPlan for 3x storage overhead because Cassandra is hungry. That 1TB you think you need? Budget for 3TB or watch your disks fill up during the first major compaction.
Q

How do I monitor Cassandra in production?

A

Cassandra gives you hundreds of metrics and exactly zero useful error messages when things go wrong.

The JMX monitoring is comprehensive if you enjoy drowning in data.Commands that might save your ass:```bashnodetool status # Shows which nodes decided to fuck offnodetool tpstats # Thread pools drowning?

This'll tell younodetool compactionstats # Compaction stuck? Welcome to hellnodetool cfstats # Per-table stats that rarely help```Metrics that actually matter when you're on fire:

  • Pending compactions (if this hits 32, start panicking and cancel your weekend)
  • Read latency P99 (anything over 100ms means users are screaming)
  • GC pause frequency (G1GC should pause for 300ms max, reality is different)
  • Dropped mutations (means you're losing data, probably)
  • Timeout exceptions (your app is about to fall over)The monitoring tells you everything's broken but never why. Good luck debugging "Cassandra timed out" errors.
Q

What's the learning curve for Cassandra?

A

Cassandra will make you question your life choices until you get it right.

The learning curve isn't steep

  • it's a vertical fucking cliff. Key challenges that will ruin your weekends:

  • Conceptual shift:

Forget everything you know about databases. ACID transactions? Gone. Foreign keys? Doesn't exist. You're in eventual consistency hell now.

  • Data modeling: You'll design the same table 47 times before getting it right.

That query you thought was simple? Prepare for a complete data model redesign.

  • Operational complexity: When a node goes down at 3am, the error messages tell you absolutely nothing useful. "Mutation dropped"
  • great, which one and why?
  • Performance tuning:

JVM tuning is black magic. Get one setting wrong and your cluster commits suicide during peak traffic.Budget 6+ months for your team to stop breaking production. DataStax certifications help, but nothing beats debugging a corrupted ring at 2am on Black Friday.

Q

How much does Cassandra cost to run?

A

Open source Cassandra is free under Apache 2.0 license.

Operational costs include:Self-managed costs (3-year, medium deployment):

  • Infrastructure: $40,000-80,000 (AWS/GCP/Azure)
  • Operational expertise: $160,000-220,000 annually for skilled engineers
  • Support contracts: $15,000-150,000 annually (optional)
  • Monitoring tools: $5,000-20,000 annuallyManaged cloud options:
  • AWS Keyspaces: $600-800/month for medium instances
  • DataStax Astra DB: $620-820/month for similar capacity
  • Azure Managed Instance: $640-840/month for equivalent resourcesThe total cost reflects the need for distributed systems expertise and robust operational procedures.
Q

When should I avoid using Cassandra?

A

Don't torture yourself with Cassandra if:

  • Your dataset is small (< 1TB)
  • using Cassandra for a small app is like using a rocket launcher to kill a fly
  • You need joins or transactions
  • Cassandra laughs at your relational database dreams
  • Your team has never dealt with distributed systems
  • you'll spend more time fighting the database than building features
  • You can't afford two full-time engineers just to keep it running
  • the operational overhead is brutal
  • You need to run reports or analytics
  • prepare for data modeling nightmares that make SQL look elegant
  • You're building a typical web app
  • just use PostgreSQL and save yourself the painReal talk: most teams pick Cassandra because it sounds impressive in architecture meetings. Unless you're actually Netflix-scale and can't afford downtime, PostgreSQL will serve you better and won't make you want to quit engineering.

Official Documentation and Resources

Related Tools & Recommendations

tool
Similar content

Amazon DynamoDB - AWS NoSQL Database That Actually Scales

Fast key-value lookups without the server headaches, but query patterns matter more than you think

Amazon DynamoDB
/tool/amazon-dynamodb/overview
100%
tool
Similar content

Apache Cassandra Performance Optimization Guide: Fix Slow Clusters

Stop Pretending Your 50 Ops/Sec Cluster is "Scalable"

Apache Cassandra
/tool/apache-cassandra/performance-optimization-guide
72%
tool
Similar content

Redis Overview: In-Memory Database, Caching & Getting Started

The world's fastest in-memory database, providing cloud and on-premises solutions for caching, vector search, and NoSQL databases that seamlessly fit into any t

Redis
/tool/redis/overview
55%
tool
Similar content

Cassandra Vector Search for RAG: Simplify AI Apps with 5.0

Learn how Apache Cassandra 5.0's integrated vector search simplifies RAG applications. Build AI apps efficiently, overcome common issues like timeouts and slow

Apache Cassandra
/tool/apache-cassandra/vector-search-ai-guide
55%
tool
Similar content

Secure Apache Cassandra: Hardening Best Practices & Zero Trust

Harden Apache Cassandra security with best practices and zero-trust principles. Move beyond default configs, secure JMX, and protect your data from common vulne

Apache Cassandra
/tool/apache-cassandra/enterprise-security-hardening
50%
tool
Similar content

etcd Overview: The Core Database Powering Kubernetes Clusters

etcd stores all the important cluster state. When it breaks, your weekend is fucked.

etcd
/tool/etcd/overview
48%
tool
Similar content

Prisma ORM: TypeScript Client, Setup Guide, & Troubleshooting

Database ORM that generates types from your schema so you can't accidentally query fields that don't exist

Prisma
/tool/prisma/overview
48%
tool
Similar content

Neon Production Troubleshooting Guide: Fix Database Errors

When your serverless PostgreSQL breaks at 2AM - fixes that actually work

Neon
/tool/neon/production-troubleshooting
46%
tool
Similar content

Neon Serverless PostgreSQL: An Honest Review & Production Insights

PostgreSQL hosting that costs less when you're not using it

Neon
/tool/neon/overview
42%
tool
Similar content

mongoexport Performance Optimization: Speed Up Large Exports

Real techniques to make mongoexport not suck on large collections

mongoexport
/tool/mongoexport/performance-optimization
42%
tool
Recommended

Apache Kafka - The Distributed Log That LinkedIn Built (And You Probably Don't Need)

integrates with Apache Kafka

Apache Kafka
/tool/apache-kafka/overview
42%
troubleshoot
Recommended

Docker Won't Start on Windows 11? Here's How to Fix That Garbage

Stop the whale logo from spinning forever and actually get Docker working

Docker Desktop
/troubleshoot/docker-daemon-not-running-windows-11/daemon-startup-issues
42%
howto
Recommended

Stop Docker from Killing Your Containers at Random (Exit Code 137 Is Not Your Friend)

Three weeks into a project and Docker Desktop suddenly decides your container needs 16GB of RAM to run a basic Node.js app

Docker Desktop
/howto/setup-docker-development-environment/complete-development-setup
42%
news
Recommended

Docker Desktop's Stupidly Simple Container Escape Just Owned Everyone

compatible with Technology News Aggregation

Technology News Aggregation
/news/2025-08-26/docker-cve-security
42%
tool
Similar content

ClickHouse Overview: Analytics Database Performance & SQL Guide

When your PostgreSQL queries take forever and you're tired of waiting

ClickHouse
/tool/clickhouse/overview
40%
tool
Similar content

MongoDB Overview: How It Works, Pros, Cons & Atlas Costs

Explore MongoDB's document database model, understand its flexible schema benefits and pitfalls, and learn about the true costs of MongoDB Atlas. Includes FAQs

MongoDB
/tool/mongodb/overview
38%
tool
Similar content

PostgreSQL Performance Optimization: Master Tuning & Monitoring

Optimize PostgreSQL performance with expert tips on memory configuration, query tuning, index design, and production monitoring. Prevent outages and speed up yo

PostgreSQL
/tool/postgresql/performance-optimization
38%
tool
Similar content

Liquibase Overview: Automate Database Schema Changes & DevOps

Because manually deploying schema changes while praying is not a sustainable strategy

Liquibase
/tool/liquibase/overview
38%
tool
Similar content

Flyway: Database Migrations Explained - Why & How It Works

Database migrations without the XML bullshit or vendor lock-in

Flyway
/tool/flyway/overview
38%
tool
Recommended

MongoDB Atlas Enterprise Deployment Guide

competes with MongoDB Atlas

MongoDB Atlas
/tool/mongodb-atlas/enterprise-deployment
38%

Recommendations combine user behavior, content similarity, research intelligence, and SEO optimization