Why This Integration Is Harder Than It Looks

So you've decided to connect Kafka to ClickHouse. Smart choice for real-time analytics, but buckle the fuck up. Look, Kafka and ClickHouse are both solid at what they do. Kafka handles millions of events per second without breaking a sweat, and ClickHouse can run analytical queries stupid fast. But getting them to play nice together? That's where your weekend disappears.

The Real Problem Nobody Tells You About

Here's what the docs don't mention: these systems were designed for completely different workloads. Kafka wants to stream individual events as fast as possible. ClickHouse wants to ingest data in batches and compress the hell out of it. It's like trying to connect a fire hose to a funnel.

Kafka pushes individual events. ClickHouse wants batches. This mismatch will bite you in the ass repeatedly.

We learned this the hard way when our first attempt to stream click events directly into ClickHouse brought our analytics cluster to its knees. Turns out ClickHouse creating a new part for every single event is a terrible idea. Who knew?

Your Three Integration Options (And What Goes Wrong)

ClickPipes - ClickHouse Cloud's managed connector. Costs money but actually works, which is fucking refreshing. The setup is dead simple: point it at your Kafka cluster, configure the schema mapping, done. We handle maybe 40-60k events/sec this way and it just works. The downside? Your AWS bill went from like 2 grand a month to over 7 grand real quick - ClickPipes charges $0.30 per million events plus compute time. Your CFO won't be thrilled.

The ClickPipes documentation is actually decent, which is rare.

Kafka Connect - The open-source connector that promises to be free. Yeah right. It's not free - you'll pay with your sanity and weekend time instead. Getting exactly-once semantics working took us three weeks and two production outages. But once it's running, it's actually pretty solid. We process maybe 25-35k events/sec through our Connect cluster running version 7.4.0 - avoid 7.2.x if you can, it has a nasty memory leak with large consumer groups.

Connect runs worker processes that grab messages from Kafka and shove them into ClickHouse. Simple concept, nightmare implementation.

The connector has a habit of silently dropping messages when your schema changes. Always, ALWAYS monitor your consumer lag.

Kafka Table Engine - ClickHouse's native integration. Fastest option at like 5ms latency, but fragile as fuck. Works great until someone restarts the ClickHouse service and forgets to recreate the materialized views. Then your data just... stops flowing. No errors, no warnings, just silence. Pro tip: ClickHouse 23.8+ finally added proper error logging for this, but earlier versions will just fail silently and leave you wondering why your dashboards went flat.

We use this for low-volume, high-importance event streams where we need sub-10ms latency. Anything mission-critical goes through Connect instead.

Performance Reality Check

Forget those "230k events/sec" benchmarks you see online. In production with real data, real schemas, and real network conditions, here's what you can actually expect:

  • ClickPipes: Maybe 40-70k events/sec depending on message size
  • Kafka Connect: 20-45k events/sec with proper tuning
  • Kafka Table Engine: 50-120k events/sec when it's working

Your mileage will vary dramatically based on message size. Those benchmarks assume tiny JSON messages. Try streaming 2KB events and watch your throughput drop by like 60-70%.

Hardware matters. Message size matters more. Network conditions will fuck you over. Test with your actual data or prepare for surprises.

ClickHouse Logo

Security That Actually Works in Production

If you're dealing with sensitive data, Kafka Connect is your only real option. ClickPipes doesn't support field-level encryption (yet), and the Table Engine treats security as an afterthought.

We encrypt PII fields at the application level before sending to Kafka. It's extra work, but it saves you from compliance nightmares when someone inevitably dumps your analytics database to S3 without thinking.
What Actually Breaks in Production (And How to Fix It)

OK, you know the options. Now let's talk about reality. No matter which path you choose, these problems will find you. Let me save you some pain. Here's the shit that will definitely go wrong, roughly in the order they'll ruin your day.

Schema Evolution Will Destroy You

Your product team will change the event schema. They won't tell you. Your pipeline will start silently dropping fields, and you'll discover it three weeks later during a board meeting when the revenue charts look wrong.

What breaks: ClickHouse is more picky about schema changes than my ex was about restaurants. Add a new field without a default? BOOM. Change a field type? Congratulations, you're now reprocessing three weeks of Kafka data.

The fix: Always use nullable fields in ClickHouse and handle schema evolution at the application level. Don't trust Connect's schema registry integration - it lies. We learned this when Connect happily inserted NULL for every new field instead of throwing an error. Three hours debugging why our conversion rates looked like shit - kept seeing Column 'new_field' is not nullable errors in ClickHouse logs but Connect was silent about it.

Copy this config for Kafka Connect:

{
  "errors.tolerance": "all",
  "errors.deadletterqueue.topic.name": "clickhouse-connect-errors",
  "errors.deadletterqueue.context.headers.enable": true
}

Memory Issues That Will Haunt Your Dreams

ClickHouse will eat all your RAM if you let it. The Kafka Table Engine is especially guilty - it buffers everything in memory before flushing to disk.

Gotcha #1: The kafka_max_block_size setting defaults to 65,536. Sounds reasonable until you have 100 partitions and each one is buffering 64K rows. That's like 6.4M rows in memory before anything hits disk.

Gotcha #2: Kafka Connect will OOM if you set batch.size too high. We spent two days debugging why our Connect workers kept crashing with 32GB heaps - kept getting java.lang.OutOfMemoryError: GC overhead limit exceeded. Turns out 50,000 message batches were way too much for our 2KB average message size. Math is hard when you're running on four hours of sleep and way too much coffee.

Use these settings or hate your life:

-- ClickHouse Kafka Engine
CREATE TABLE kafka_queue (
    timestamp DateTime64(3),
    user_id String,
    event_data String
) ENGINE = Kafka
SETTINGS kafka_broker_list = 'localhost:9092',
         kafka_topic_list = 'events',
         kafka_group_name = 'clickhouse_consumer',
         kafka_format = 'JSONEachRow',
         kafka_max_block_size = 10000,    -- Lower this
         kafka_poll_timeout_ms = 7000;    -- Higher than default

Network Partitions Are Your Real Enemy

When the network hiccups between Kafka and ClickHouse, each integration method handles it differently. Most handle it badly.

ClickPipes: Usually recovers automatically but loses data during the outage. There's no replay mechanism.

Kafka Connect: Retries forever and backs up your entire pipeline. We had Connect consume 3 days of backlog after a 30-minute outage because it couldn't commit offsets.

Table Engine: Just stops. No error message, no alert, just silence. The materialized view keeps running but processes zero rows.

The nuclear option that works:

## When everything is fucked and you need to start over
docker system prune -a
docker-compose down -v
## Edit your offsets in Kafka directly
kafka-consumer-groups --bootstrap-server localhost:9092 --reset-offsets --group clickhouse_consumer --to-latest --topic events --execute
## Now restart everything

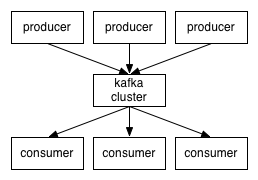
Kafka Producer Consumer Flow

Performance Tuning That Matters

Forget the docs. Here's what actually moves the needle:

For high throughput: Match your Kafka partition count to ClickHouse's CPU core count. We went from maybe 20k/sec to like 70-80k/sec by changing from 3 partitions to 32. Took us way too long to figure this out.

For low latency: Use the Table Engine with small kafka_max_block_size (1000 or less). Accept that you'll create more parts and need to run OPTIMIZE more often.

For reliability: Use Connect with exactly.once.semantics=enabled. Yes, it's slower. Yes, it's worth it when your CEO asks why the user count doubled overnight.

Monitoring That Actually Helps at 3AM

Dashboard screenshots don't help when you're debugging a production outage. Here are the queries you need:

-- Check if Kafka Table Engine is actually consuming
SELECT 
    table,
    partition_id,
    current_offset,
    exceptions_count,
    last_exception_time
FROM system.kafka_consumers 
WHERE table = 'your_kafka_table'
ORDER BY last_exception_time DESC;

-- Find ClickHouse parts that are too small (performance killer)
SELECT 
    table,
    count() as parts_count,
    sum(rows) as total_rows,
    avg(rows) as avg_rows_per_part
FROM system.parts 
WHERE active = 1 
GROUP BY table 
HAVING avg_rows_per_part < 10000;

Set these alerts or hate your life:

  • Consumer lag > 10,000 messages
  • ClickHouse insert rate drops below 50% of baseline
  • Error rate > 1% (not 0.1% - that's too sensitive)
  • Memory usage > 80% on Connect workers

The Production Incident Playbook

When shit hits the fan (not if, when):

  1. Check consumer lag first. 9 out of 10 problems show up here.
  2. Look at ClickHouse system.kafka_consumers. If exceptions_count is growing, you found your problem.
  3. Restart the world. Sometimes the simplest fix is docker-compose restart.
  4. Reset consumer offsets if needed. Better to lose 30 minutes of data than stay down for 3 hours.

We keep a runbook with these exact steps. When alerts fire during dinner, following the checklist beats trying to remember what that obscure setting does.

What Actually Matters (Not Bullshit Comparison Charts)

Tool

Description

Cost/Setup

Good For

Bad For

ClickPipes

If your company has money and you want to sleep at night, go with ClickPipes. It actually works. Setup is dead simple: click some buttons, point it at Kafka, done.

Expensive (from like $2,100 to around $8,300 a month). Dead simple setup.

Teams that value their time over money. If you're on ClickHouse Cloud already, just use this.

Startups bleeding money. Also useless if you need fancy transformations.

Kafka Connect

Connect is "free" the way a puppy is free. You'll pay with your soul getting it running properly.

No licensing costs, but high effort/time cost (took three weeks to get exactly-once working without breaking everything).

Teams with smart ops people who like solving problems. Best option if you need transformations or multiple destinations.

Teams that just want to get data flowing and go home. Also terrible if you don't have dedicated devops.

Table Engine

Fastest option by far

  • we get 5ms latency when it's working. But "when it's working" is doing a lot of heavy lifting here. Restart Click

House wrong and your data just... stops. No warning, no error, just silence.

Fragile. High operational effort to maintain stability. No warning/error on failure.

Teams that understand ClickHouse internals and need stupid-fast latency.

Anyone who expects things to "just work" after deployment.

Production Configurations That Actually Work

You've survived the integration setup and learned from the common failures. Now let's talk about what happens next: running this shit in production without it torching your infrastructure. Here's the stuff you need to know after the basic setup is running. These configs come from fixing disasters at 2 AM more times than I care to remember.

Security That Doesn't Break Everything

SSL/TLS Setup That Works:
Most tutorials assume you want to run everything in plaintext like some fucking amateur. In production, you need SSL but the default configs are garbage. Took me four hours to figure out the endpoint verification was too strict - kept getting javax.net.ssl.SSLHandshakeException: PKIX path building failed until I disabled endpoint verification. Four. Hours. Of. My. Life.

## Kafka Connect worker properties that don't suck
bootstrap.servers=kafka-broker:9093
security.protocol=SSL
ssl.truststore.location=/etc/ssl/kafka.truststore.jks
ssl.truststore.password=your-truststore-password
ssl.keystore.location=/etc/ssl/kafka.keystore.jks
ssl.keystore.password=your-keystore-password
ssl.key.password=your-key-password

## This one is important - default verification is too strict
ssl.endpoint.identification.algorithm=

IAM for ClickPipes (AWS):
If you're using ClickPipes with AWS, the IAM permissions are more complex than their docs suggest. You need these policies:

{
  "Version": "2012-10-17",
  "Statement": [
    {
      "Effect": "Allow",
      "Action": [
        "kafka:DescribeCluster",
        "kafka:GetBootstrapBrokers",
        "kafka:ReadData"
      ],
      "Resource": "arn:aws:kafka:region:account:cluster/*"
    }
  ]
}

And the role needs to be assumable by ClickHouse's service principal. The docs are wrong about this. Spent half a day on IAM hell because their example was missing the trust policy.

Field-Level Encryption Reality Check:
Don't encrypt every field. It kills performance and makes debugging impossible. Encrypt the minimum viable set of PII fields and call it a day. We encrypt email addresses and payment tokens. Everything else is plaintext.

Disaster Recovery That You'll Actually Test

Backup Strategy That Works:
ClickHouse backups are fast, but Kafka offset management is the real problem. When you restore ClickHouse, you need to reset Kafka consumer offsets or you'll reprocess everything.

## Reset offsets to latest (lose data during outage window)
kafka-consumer-groups --bootstrap-server localhost:9092 \
  --reset-offsets --group clickhouse_consumer \
  --to-latest --topic your-topic --execute

## Reset to specific timestamp (if you know when the backup was taken)
kafka-consumer-groups --bootstrap-server localhost:9092 \
  --reset-offsets --group clickhouse_consumer \
  --to-datetime 2025-09-06T10:00:00.000 \
  --topic your-topic --execute

Multi-Region Setup:
Cross-region replication with MirrorMaker2 is a huge pain in the ass. We tried it for two weeks and said fuck it, went back to application-level replication. Easier to reason about and debug when shit goes sideways.

If you must do MirrorMaker2, budget 2-3 weeks for tuning. The default configs replicate everything, including internal topics you don't want. Found out the hard way when our consumer offset topics were getting replicated in circles and created a 50GB data loop that brought down our entire Kafka cluster. Had to manually clean up __consumer_offsets topics across 3 regions.

Performance Tuning Based on Real Experience

ClickHouse Table Design That Scales:
Your table schema matters more than any other optimization. Here's what actually works:

CREATE TABLE events_local (
    timestamp DateTime64(3),
    user_id String,
    session_id String,
    event_name LowCardinality(String),
    event_data String,
    ingestion_time DateTime64(3) DEFAULT now64()
) ENGINE = MergeTree()
PARTITION BY toYYYYMMDD(timestamp)
ORDER BY (user_id, timestamp, session_id)
SETTINGS index_granularity = 8192;

-- Distributed table for cluster
CREATE TABLE events ON CLUSTER my_cluster AS events_local
ENGINE = Distributed(my_cluster, default, events_local, rand());

Why this schema works:

  • Partition by day, not hour. Hourly partitions create way too many small files.
  • Order by user_id first if you query by user frequently
  • LowCardinality for enum-like fields saves a ton of space
  • ingestion_time helps debug processing delays

Kafka Consumer Settings That Matter:
The docs give you defaults that work for tiny test loads. For production:

## Kafka Connect connector config
batch.size=5000
linger.ms=100
buffer.memory=134217728
max.request.size=10485760
compression.type=lz4
retries=2147483647
acks=all

Memory Settings That Prevent OOM:
ClickHouse will eat all your RAM if you let it. Use these settings:

<max_memory_usage>20000000000</max_memory_usage>  <!-- 20GB limit -->
<max_bytes_before_external_group_by>10000000000</max_bytes_before_external_group_by>
<max_bytes_before_external_sort>10000000000</max_bytes_before_external_sort>

The Production Incident Playbook (Updated)

When Consumer Lag Explodes:

  1. Check ClickHouse is responding: SELECT 1
  2. Check disk space: df -h (90% full = death, learned this at 3 AM)
  3. Look for small parts: SELECT count() FROM system.parts WHERE rows < 1000
  4. If lots of small parts: OPTIMIZE TABLE your_table FINAL (this takes forever, grab coffee)
  5. If still lagging: add more Kafka partitions and restart consumers

When Data Stops Flowing (Table Engine):

  1. Check materialized view exists: SHOW CREATE TABLE your_mv
  2. Check consumer status: SELECT * FROM system.kafka_consumers
  3. If consumer is dead: DROP TABLE kafka_queue; CREATE TABLE kafka_queue...
  4. If that doesn't work: restart ClickHouse service

When Connect Tasks Keep Failing:

  1. Check Connect logs: docker logs connect-worker-1
  2. Look for "Connector task is being killed" - means OOM
  3. Reduce batch.size by half
  4. If still failing: restart Connect workers one by one

The Nuclear Option (When Everything Is Fucked):

## Stop everything
docker-compose down -v
## Reset Kafka consumer offsets to latest
kafka-consumer-groups --bootstrap-server localhost:9092 \
  --reset-offsets --group your-consumer-group \
  --to-latest --all-topics --execute
## Start everything fresh
docker-compose up -d

You'll lose some data but the pipeline will be healthy again. Sometimes that's the right trade-off at 3 AM.

Cost Optimization That Actually Saves Money

Compression Settings:
Enable compression everywhere. It saves money and sometimes improves performance:

-- ClickHouse table compression
CREATE TABLE events (...) 
ENGINE = MergeTree()
SETTINGS compress_marks = 1, compress_primary_key = 1;
## Kafka producer compression
compression.type=lz4
batch.size=16384
linger.ms=100

Resource Right-Sizing:
Don't over-provision. Start small and scale up:

  • Connect workers: 2 CPU, 4GB RAM each
  • ClickHouse: 4 CPU, 16GB RAM minimum
  • Kafka: Match your partition count to CPU cores

Monitor CPU utilization. If you're under 50% most of the time, you can probably downsize. But don't get stupid about it - we tried to save $200/month and ended up with OOM errors during traffic spikes because we forgot that Black Friday traffic jumps 300% and our "optimized" instances couldn't handle it. Learned that lesson real quick when our analytics went dark during our biggest sales day.

Storage Optimization:
Use ClickHouse's TTL feature to automatically delete old data:

ALTER TABLE events MODIFY TTL timestamp + INTERVAL 90 DAY;

This is way cheaper than keeping everything forever, and most analytics only look at recent data anyway.

Questions Everyone Asks (And Honest Answers)

Q

Which approach is actually fastest?

A

Table Engine wins on raw speed

  • we get 5ms latency when everything's working.

But "when everything's working" is the key phrase. ClickPipes is more reliable at 15ms. Connect is slowest at 20-30ms but handles failures better.Real talk: those "230k events/sec" benchmarks are complete bullshit. With real message sizes (not tiny test payloads), expect 50-80k events/sec max from Table Engine. Connect tops out around 30-50k depending on your transformations. Those benchmark assholes were probably using 10-byte JSON messages or some shit.

Q

Can I get exactly-once delivery?

A

Only with Kafka Connect, and even then it's complicated.

You need exactly-once semantics enabled on both the Kafka side and Connect side. Click

Pipes and Table Engine are at-least-once, which means duplicates.Use ReplacingMergeTree with a proper order by clause to handle dupes. Don't rely on timestamps

  • they fucking lie. Use a proper sequence ID if you have one. Ask me how I know (hint: spent a weekend debugging duplicate user counts because we trusted timestamp ordering and Kafka delivery timestamps were all over the place like confetti).
Q

What happens when schemas change?

A

Table Engine: Your data stops flowing and you get no warning. Hope you're monitoring consumer lag.Connect: Usually works with Schema Registry but will sometimes decide to reprocess your entire topic. Plan accordingly.ClickPipes: Fails loudly, which is actually better than silent failures. At least you know something broke.Pro tip: Always use nullable fields in your ClickHouse schema. Thank me later.

Q

How do I know when things break?

A

You need these alerts or you'll find out from angry users:

  • Consumer lag > 10,000 messages (or whatever makes sense for your volume)
  • Zero inserts into Click

House for > 5 minutes

  • Error rate > 1% (0.1% is too sensitive, you'll get false alarms)For Table Engine, monitor the system.kafka_consumers table:```sql

SELECT exceptions_count FROM system.kafka_consumers WHERE table = 'your_table_name'```If exceptions_count is growing, something's properly fucked.

Q

What happens during outages?

A

ClickPipes: Retries automatically, but you'll lose data during the outage window. No replay.Connect: Backs up your entire pipeline if ClickHouse is down. We've seen 6-hour backlogs from 20-minute outages. Monitor your Connect worker memory usage.Table Engine: Just stops. Resumes when ClickHouse comes back, but materialized views keep running with zero input. Super fun to debug.

Q

How much will this cost me?

A

Table Engine: Just your ClickHouse and Kafka costs. Cheapest option.Connect: Add infrastructure for Connect workers. Budget like $500-1000/month for a decent Connect cluster.ClickPipes: Expensive as hell. We went from like $2,100 to around $8,300 a month on AWS. The convenience is nice but your CFO might have opinions.

Q

Can I transform data without writing code?

A

Connect has the best transformation options with SMTs. You can map fields, filter events, and enrich data without touching code.ClickPipes does basic field mapping. Nothing fancy.Table Engine uses materialized views for transforms. It's SQL, so kind of coding but not really.

Q

What about security?

A

If you need field-level encryption, use Connect. It's the only one that handles it properly.ClickPipes does SSL/TLS and IAM if you're on AWS. Good enough for most use cases.Table Engine: You're on your own. Hope your network is secure.Reality check: Most companies just encrypt at the Kafka level and call it a day. Field-level encryption is a pain in the ass and usually overkill.

Q

Should I use multiple approaches?

A

Sure, if you hate simplicity. We use Table Engine for low-latency alerting and Connect for everything else. Different consumer groups, different tables.Just don't try to consume the same topic with multiple approaches unless you want to debug offset management hell.

Q

What about backups and disaster recovery?

A

ClickPipes: ClickHouse Cloud handles it. You pay for the convenience.Connect: Back up your connector configs. We use Terraform for this. Also back up your Connect cluster state.Table Engine: Standard ClickHouse backups. Don't forget to save your Kafka consumer offsets if you need to restore to a specific point.Pro tip: Test your disaster recovery. That backup you think works? It probably doesn't. Ask me how I know. (Spoiler: our "tested" backup was missing half the materialized views and two hours of restore scripts that only worked on our staging server with different paths. Fun discovery during a real outage at 2 AM on Black Friday.)

Related Tools & Recommendations

compare
Recommended

PostgreSQL vs MySQL vs MongoDB vs Cassandra - Which Database Will Ruin Your Weekend Less?

Skip the bullshit. Here's what breaks in production.

PostgreSQL
/compare/postgresql/mysql/mongodb/cassandra/comprehensive-database-comparison
100%
pricing
Recommended

Database Hosting Costs: PostgreSQL vs MySQL vs MongoDB

integrates with PostgreSQL

PostgreSQL
/pricing/postgresql-mysql-mongodb-database-hosting-costs/hosting-cost-breakdown
64%
compare
Recommended

PostgreSQL vs MySQL vs MariaDB vs SQLite vs CockroachDB - Pick the Database That Won't Ruin Your Life

integrates with postgresql

postgresql
/compare/postgresql-mysql-mariadb-sqlite-cockroachdb/database-decision-guide
64%
integration
Similar content

Prometheus, Grafana, Alertmanager: Complete Monitoring Stack Setup

How to Connect Prometheus, Grafana, and Alertmanager Without Losing Your Sanity

Prometheus
/integration/prometheus-grafana-alertmanager/complete-monitoring-integration
62%
pricing
Recommended

Databricks vs Snowflake vs BigQuery Pricing: Which Platform Will Bankrupt You Slowest

We burned through about $47k in cloud bills figuring this out so you don't have to

Databricks
/pricing/databricks-snowflake-bigquery-comparison/comprehensive-pricing-breakdown
52%
integration
Recommended

dbt + Snowflake + Apache Airflow: Production Orchestration That Actually Works

How to stop burning money on failed pipelines and actually get your data stack working together

dbt (Data Build Tool)
/integration/dbt-snowflake-airflow/production-orchestration
49%
news
Recommended

Redis Buys Decodable Because AI Agent Memory Is a Mess - September 5, 2025

$100M+ bet on fixing the data pipeline hell that makes AI agents forget everything

OpenAI/ChatGPT
/news/2025-09-05/redis-decodable-acquisition-ai-agents
41%
alternatives
Recommended

Redis Alternatives for High-Performance Applications

The landscape of in-memory databases has evolved dramatically beyond Redis

Redis
/alternatives/redis/performance-focused-alternatives
41%
news
Recommended

Redis Acquires Decodable to Power AI Agent Memory and Real-Time Data Processing

Strategic acquisition expands Redis for AI with streaming context and persistent memory capabilities

OpenAI/ChatGPT
/news/2025-09-05/redis-decodable-acquisition
41%
howto
Recommended

Migrate JavaScript to TypeScript Without Losing Your Mind

A battle-tested guide for teams migrating production JavaScript codebases to TypeScript

JavaScript
/howto/migrate-javascript-project-typescript/complete-migration-guide
41%
alternatives
Recommended

Maven is Slow, Gradle Crashes, Mill Confuses Everyone

integrates with Apache Maven

Apache Maven
/alternatives/maven-gradle-modern-java-build-tools/comprehensive-alternatives
41%
pricing
Recommended

My Hosting Bill Hit Like $2,500 Last Month Because I Thought I Was Smart

Three months of "optimization" that cost me more than a fucking MacBook Pro

Deno
/pricing/javascript-runtime-comparison-2025/total-cost-analysis
41%
integration
Similar content

Claude API Node.js Express Integration: Complete Guide

Stop fucking around with tutorials that don't work in production

Claude API
/integration/claude-api-nodejs-express/complete-implementation-guide
33%
news
Recommended

Linux Foundation Takes Control of Solo.io's AI Agent Gateway - August 25, 2025

Open source governance shift aims to prevent vendor lock-in as AI agent infrastructure becomes critical to enterprise deployments

Technology News Aggregation
/news/2025-08-25/linux-foundation-agentgateway
33%
troubleshoot
Recommended

Docker Daemon Won't Start on Linux - Fix This Shit Now

Your containers are useless without a running daemon. Here's how to fix the most common startup failures.

Docker Engine
/troubleshoot/docker-daemon-not-running-linux/daemon-startup-failures
33%
tool
Recommended

Snowflake - Cloud Data Warehouse That Doesn't Suck

Finally, a database that scales without the usual database admin bullshit

Snowflake
/tool/snowflake/overview
30%
tool
Recommended

RabbitMQ - Message Broker That Actually Works

competes with RabbitMQ

RabbitMQ
/tool/rabbitmq/overview
29%
integration
Recommended

Stop Fighting Your Messaging Architecture - Use All Three

Kafka + Redis + RabbitMQ Event Streaming Architecture

Apache Kafka
/integration/kafka-redis-rabbitmq/architecture-overview
29%
tool
Recommended

Apache Kafka - The Distributed Log That LinkedIn Built (And You Probably Don't Need)

integrates with Apache Kafka

Apache Kafka
/tool/apache-kafka/overview
29%
howto
Recommended

Python 3.13 Finally Lets You Ditch the GIL - Here's How to Install It

Fair Warning: This is Experimental as Hell and Your Favorite Packages Probably Don't Work Yet

Python 3.13
/howto/setup-python-free-threaded-mode/setup-guide
29%

Recommendations combine user behavior, content similarity, research intelligence, and SEO optimization