Currently viewing the human version
Switch to AI version

The Real Cost of Playing Whack-a-Mole with Kubernetes

Stop Fixing Shit That Breaks Every Week

Most teams live in permanent firefighting mode. Something breaks, you scramble to fix it, then rinse and repeat. It's exhausting, expensive, and completely avoidable.

Our Black Friday disaster cost us:

  • $180k in lost sales during a 6-hour outage
  • $30k in AWS charges for the recovery scramble (because panic-scaling costs money)
  • 72 hours of engineering time across three people debugging something that could have been prevented
  • One engineer who quit two weeks later citing "burnout from constant emergencies"
  • Three months of explaining to the board why our "cloud-native architecture" shit the bed

That $5,600/minute figure you see everywhere? That's bullshit from 2014. Real 2025 data shows enterprise downtime now costs $14,056 per minute on average, rising to $23,750/minute for large companies. The Uptime Institute's latest research shows unplanned outages now cost over $100,000 per incident.

Our hourly burn rate during outages hits $40k when you factor in lost revenue, AWS costs, and engineering team overtime. That Black Friday incident? We could have hired a full-time SRE for six months with what we lost in one night. Recent case studies show downtime costs have tripled since 2020 due to increased digital dependency.

Kubernetes Cluster Architecture

Prevention vs. Playing Hero at 3 AM

Here's what changed after we got serious about prevention:

Stop Trusting Prometheus to Save Your Ass

Kubernetes Monitoring Dashboard

Prometheus is great until it runs out of memory at the worst possible moment. We learned this the hard way when our monitoring stack crashed during an outage. Turns out, collecting metrics on everything doesn't help when the collector is dead. Tigera's monitoring guide covers the fundamentals most teams get wrong.

Resource trending that actually works: Track disk usage growth over weeks, not current usage. etcd will fill your disk for months before you notice, then kill your cluster in minutes. DataDog's recent analysis shows why the 8GB etcd limit catches everyone off guard.

etcd Storage Monitoring Example: A proper etcd monitoring dashboard shows disk usage trends, compaction status, and performance metrics that reveal storage growth patterns before they become critical.

## This alert saved us twice in the past year
alert: EtcdDiskGrowth
expr: predict_linear(etcd_mvcc_db_total_size_in_bytes[7d], 7*24*3600) > 8e+9
annotations:
  summary: "etcd will hit 8GB limit in 7 days at current growth rate"

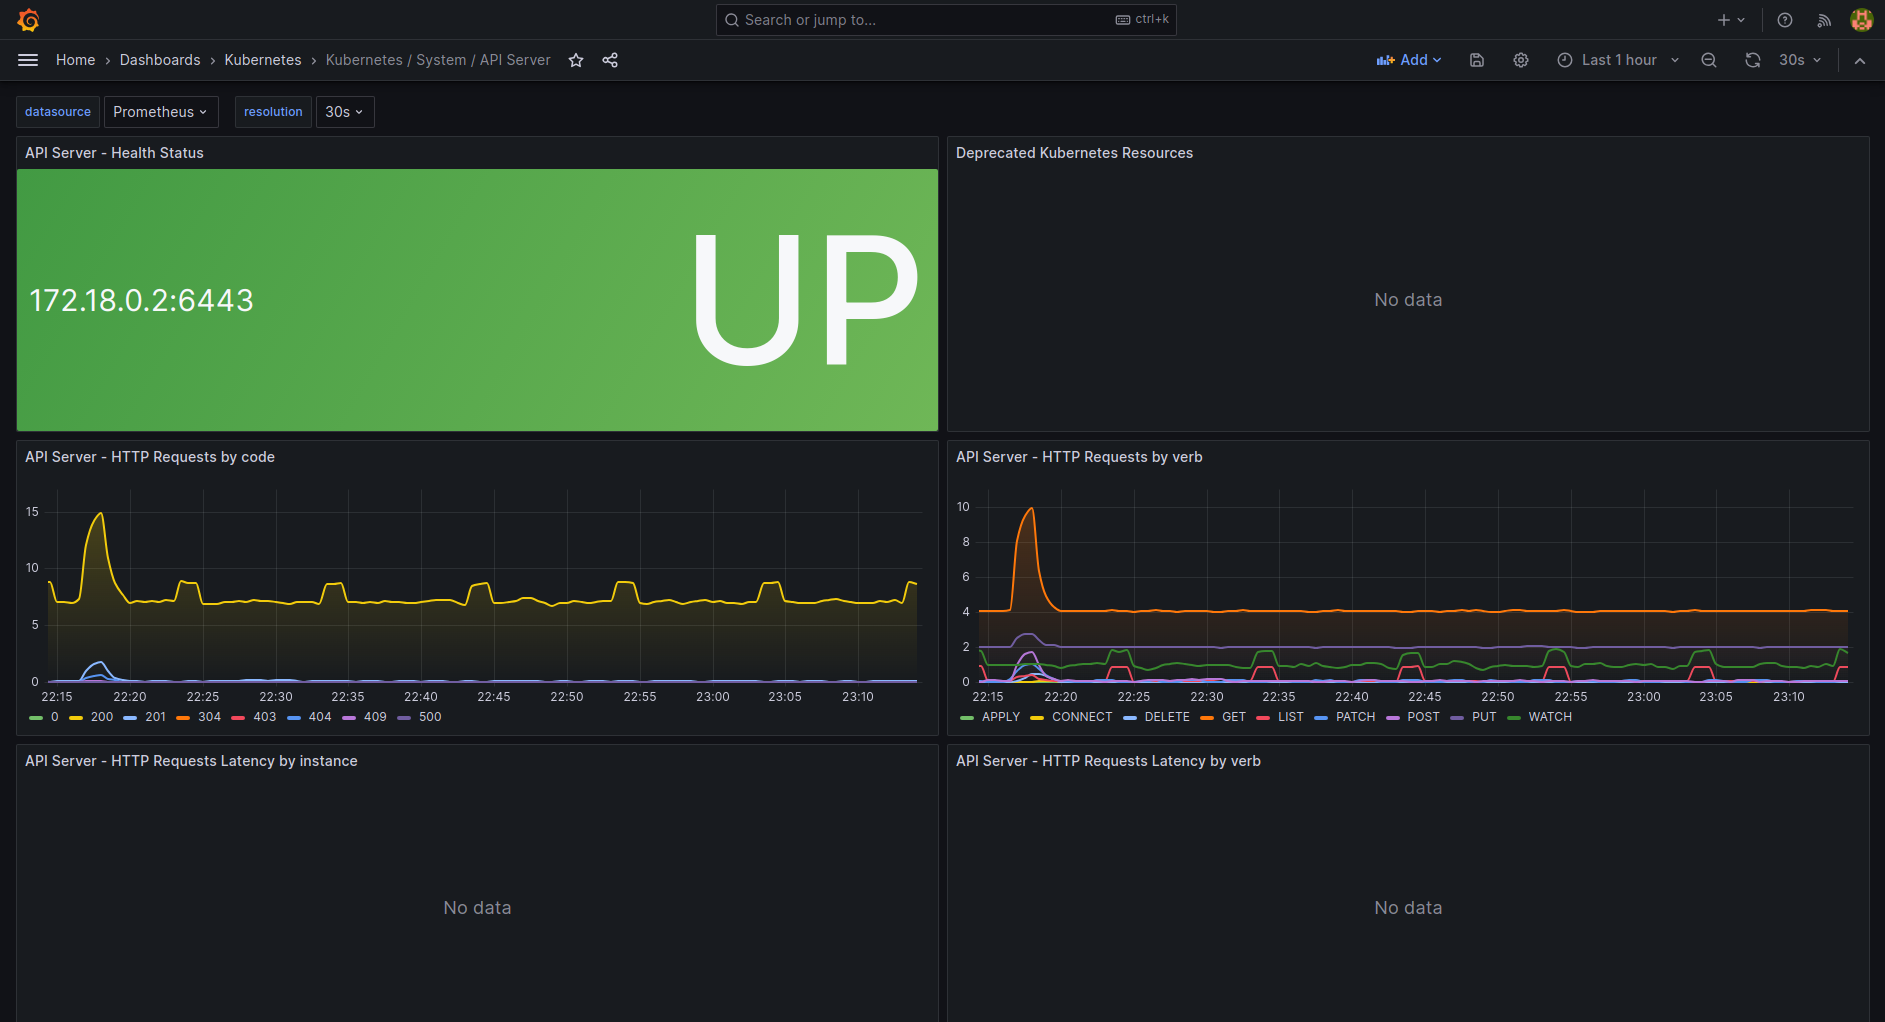
etcd latency monitoring: Don't wait for 100ms+ latency to alert. We alert at 20ms sustained increase because that's the canary in the coal mine. By the time you hit 100ms, you're already fucked. The etcd team's official metrics guide explains why latency spikes are the first sign of trouble.

API server overload patterns: Watch for request queue buildup and increased admission controller rejections. These happen hours before complete API server lockup, giving you time to investigate instead of debugging in crisis mode. Kubernetes official monitoring docs explain the warning signs, but you need to act on them fast.

Infrastructure That Doesn't Eat Itself

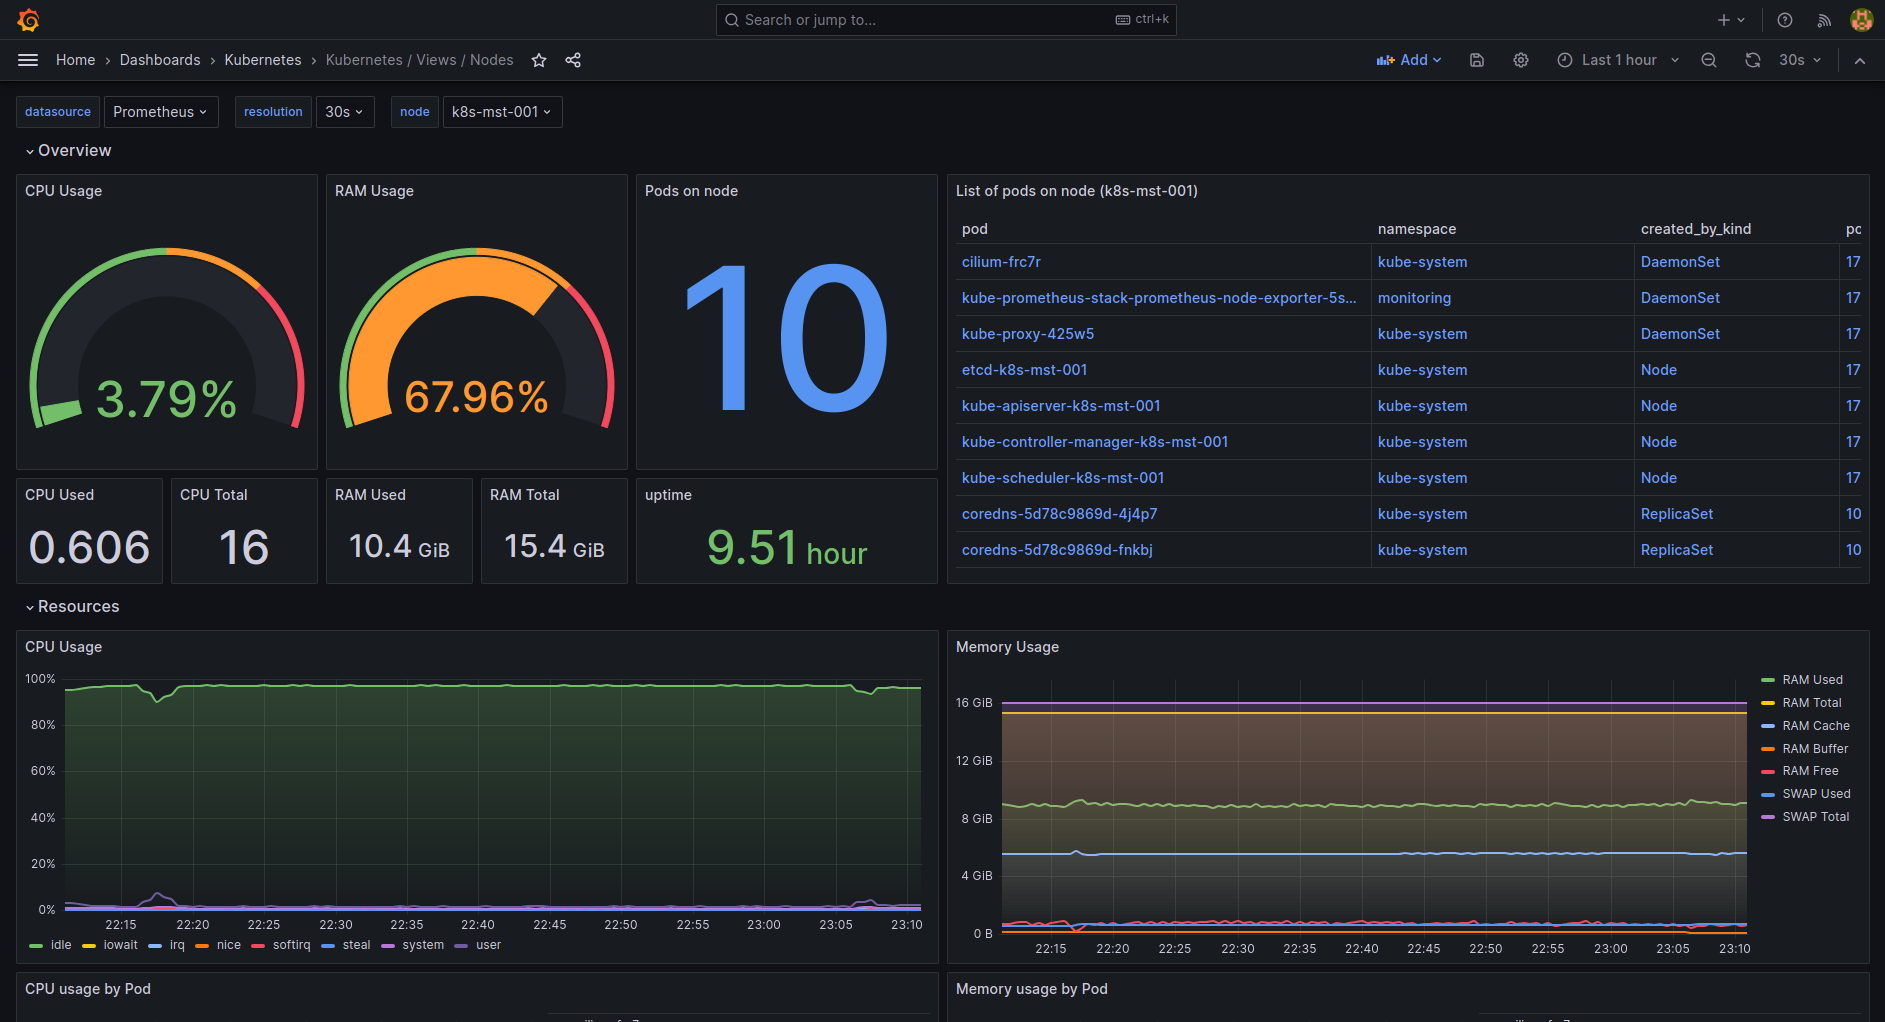
Node capacity management: We maintain 40% unused capacity now, not the "recommended" 20%. Yes, it costs more. You know what costs more? Emergency node scaling during an incident when AWS takes 10 minutes to provision and your autoscaler is having a meltdown. ScaleOps research proves that over-provisioning prevents more outages than it causes waste.

Multi-AZ is not optional: Single AZ failures happen monthly in us-east-1. If you're not spread across at least 3 AZs with actual pod anti-affinity rules, you're gambling with your uptime. We learned this when a whole AZ went down and took our entire payment processing system with it. AWS's reliability pillar guide explains why AZ failures are inevitable, but most teams still don't plan for them.

Storage monitoring that isn't useless: Alert at 60% PVC usage, not 80%. Kubernetes storage is about as predictable as cryptocurrency prices, and you need time to expand volumes before hitting limits. SUSE's alerting best practices covers storage monitoring that actually prevents incidents.

GitOps Done Right (Not GitOps Theater)

ArgoCD reliability issues: ArgoCD is fantastic until it gets into sync loops and applies the same broken config 47 times. We've had to restart ArgoCD more times than I'd like to admit. Set up monitoring for ArgoCD itself - the tool that's supposed to prevent outages can cause them. Komodor's 2025 best practices guide covers GitOps pitfalls you need to avoid.

Policy enforcement reality: OPA Gatekeeper is great in theory. In practice, it'll reject critical emergency deployments at 2 AM because someone forgot to add a required label. Have an emergency bypass process or you'll be editing policies while the site is down.

Certificate rotation horror stories: cert-manager works until it doesn't. We monitor certificate expiration with multiple tools because we've had cert-manager silently fail to renew certificates three times. Let's Encrypt rate limits will bite you during a mass renewal event.

Design Patterns That Actually Prevent Cascades

Circuit breakers that don't suck: Istio circuit breakers are configurable but complex. Start with simple timeouts and retries before getting fancy. We've seen more outages caused by misconfigured circuit breakers than prevented by them.

Resource isolation reality: Dedicated nodes for system components cost extra but save your sanity. When your application pods eat all available memory, you don't want your DNS resolver going down too. We learned this during a memory leak that took down our entire monitoring stack.

Graceful degradation: Build your services to fail gracefully or they'll fail spectacularly. Our payment service now caches the last known good configuration and serves limited functionality during database outages instead of returning 500s.

Resource Management That Doesn't Lie to You

QoS classes in practice: Guaranteed QoS pods get their resources, but they also can't share unused resources efficiently. We use a mix of Guaranteed for critical services and Burstable for everything else. The textbook "use Guaranteed everywhere" advice will bloat your AWS bill.

PDB gotchas: Pod Disruption Budgets prevent deployments during node maintenance if set too restrictively. We've had deployments stuck for hours because PDBs blocked node evictions. Set them appropriately or they'll bite you during critical updates.

HPA scaling delays: Horizontal Pod Autoscaling is slow and sometimes doesn't scale fast enough for traffic spikes. We pre-scale before known traffic events because waiting for HPA during a flash sale is like bringing a knife to a gunfight.

Real Monitoring That Detects Problems Before Users Notice

The Four Signals Everyone Talks About:

  1. Latency: We track P95 and P99, but also watch P50 trends. A slowly degrading P50 often indicates resource starvation before the P99 goes haywire.
  2. Traffic: Rate changes matter more than absolute rates. A 30% traffic drop at 10 AM on a Tuesday is more concerning than high traffic during a sale.
  3. Errors: Error rate increases are critical, but so are new error types. A single new error class often indicates a deployment or configuration issue.
  4. Saturation: Memory trends are more predictive than CPU for Kubernetes workloads. CPU spikes are normal; memory leaks kill clusters.

Context-aware alerting that doesn't spam you: High CPU during business hours is expected. The same level at 3 AM means something is broken. We use time-based alert thresholds because context matters more than absolute numbers.

The brutal truth: Most monitoring setups are notification systems for outages that already happened. Real prevention monitoring tracks trends and patterns that predict failures days in advance. It takes more work to set up, but it's the difference between sleeping through the night and explaining to customers why their data is gone.

Prevention costs money upfront. Outages cost more money, plus your sanity, plus your team's sanity, plus potentially your job. Choose wisely.

Monitoring That Actually Catches Problems Before They Ruin Your Weekend

Building Alerts That Don't Cry Wolf

Most monitoring setups are like car alarms in the 90s - they go off constantly and everyone ignores them. Here's how to build alerts that actually mean something and catch disasters before they happen. Fairwinds' guide to preventing OOMKilled errors covers essential monitoring patterns for avoiding memory-related outages.

The Three Layers of "Oh Shit" Prevention

Stop alerting on "high" CPU. Start alerting on "CPU growing toward certain doom":

Prometheus Alert Configuration: Effective alerting relies on predictive rules that catch trends before they become emergencies, not reactive thresholds that fire when it's too late.

## This alert saved our ass when memory was growing 50MB/day for two months
groups:
- name: trend-alerts-that-work
  rules:
  - alert: MemoryLeakDetection
    expr: predict_linear(node_memory_MemAvailable_bytes[7d], 7*24*3600) < 1e+9
    for: 1h
    labels:
      severity: warning
    annotations:
      summary: "Node {{ $labels.instance }} will run out of memory in 7 days"
      description: "Memory leak or growth pattern detected. Current rate: {{ $value | humanize }}B/week"

Why this alert actually works: We get a week to investigate and fix memory leaks instead of getting paged when the node OOMs at 3 AM. Fixed three memory leaks in the past year before they became outages. DevOps.dev's monitoring guide shows how to set up proper memory leak detection with Prometheus.

Disk space trending that isn't useless:

- alert: DiskFillingUp
  expr: predict_linear(node_filesystem_avail_bytes{fstype!="tmpfs"}[6h], 4*3600) < 0
  for: 30m
  labels:
    severity: warning
  annotations:
    summary: "Disk {{ $labels.device }} will be full in 4 hours"
    description: "Something is writing to disk faster than usual. Go check your logs."

This alert fired when our application started logging stack traces at 200MB/hour due to a configuration error. Without trending, we would have discovered this when the disk filled up and killed the database.

Prometheus Architecture Overview

Layer 2: etcd and API Server - The Things That Kill Everything When They Die

etcd latency alerts that aren't academic bullshit:

- alert: EtcdGettingSlow
  expr: histogram_quantile(0.99, rate(etcd_disk_wal_fsync_duration_seconds_bucket[5m])) > 0.01
  for: 5m
  labels:
    severity: warning
  annotations:
    summary: "etcd on {{ $labels.instance }} getting slow ({{ $value }}s P99 fsync)"
    description: "etcd disk performance degrading. Check disk I/O and consider moving etcd to faster storage."

Real talk: etcd latency above 10ms means your disks are struggling. Above 50ms and you're heading for a cluster meltdown. This alert fired twice when our cloud provider's storage was having issues, giving us time to migrate etcd to faster disks before the cluster became unusable. Tigera's Prometheus metrics guide explains how to monitor etcd performance properly.

API server overload detection:

- alert: APIServerGettingHammered
  expr: rate(apiserver_current_inflight_requests[5m]) > 100
  for: 2m
  labels:
    severity: warning
  annotations:
    summary: "API server getting slammed with {{ $value }} inflight requests"
    description: "Something is probably spamming the API server. Check for runaway controllers or DoS."

This alert caught a misconfigured controller that was creating and deleting the same resource in a loop, generating 1000+ API requests per second. SignOz's monitoring guide covers how to track resource usage patterns that reveal such issues.

Layer 3: Application Alerts That Actually Tell You Something Useful

Response time alerts with context:

- alert: ResponseTimesSuckingAir
  expr: |
    (
      histogram_quantile(0.95, rate(http_request_duration_seconds_bucket[5m])) >
      histogram_quantile(0.95, rate(http_request_duration_seconds_bucket[1h] offset 1h)) * 2
    )
  for: 5m
  labels:
    severity: warning
  annotations:
    summary: "P95 response time doubled on {{ $labels.service }}"
    description: "Current P95: {{ $value }}s vs 1h ago. Something changed."

Why this works better: Instead of arbitrary thresholds like "P95 > 500ms", this compares current performance to recent history. Catches performance regressions from deployments or load changes. Squadcast's alert rules guide shows comprehensive examples of contextual alerting patterns.

Smart Alerting That Doesn't Make You Hate Your Job

Time-Based Alerts (Because Context Matters)

Coralogix's troubleshooting guide demonstrates how to monitor trends and identify patterns before they become critical issues.

CPU alerts that understand business hours:

- alert: HighCPUBusinessHours
  expr: rate(node_cpu_seconds_total{mode!="idle"}[5m]) > 0.85 and ON() hour() >= 9 and ON() hour() <= 17
  for: 10m
  labels:
    severity: info
  annotations:
    summary: "High CPU during business hours (probably normal)"

- alert: HighCPUOffHours
  expr: rate(node_cpu_seconds_total{mode!="idle"}[5m]) > 0.7 and ON() (hour() < 9 or hour() > 17)
  for: 5m
  labels:
    severity: critical
  annotations:
    summary: "High CPU at {{ $labels.hour }}:00 - something's wrong"
    description: "CPU shouldn't be high outside business hours. Check for runaway processes."

Database connection alerts with load context:

- alert: DatabaseConnectionsHigh
  expr: mysql_global_status_threads_connected > 80
  for: 5m
  labels:
    severity: warning
  # Don't alert during high traffic - high connections are expected then
  unless: rate(http_requests_total[5m]) > 50
  annotations:
    summary: "High DB connections ({{ $value }}) during low traffic"
    description: "Probably connection leaks or long-running queries."
Multi-Signal Alerts (Because Single Metrics Lie)

OOM prediction that actually works:

- alert: PodAboutToOOM
  expr: |
    (
      (container_memory_usage_bytes / container_spec_memory_limit_bytes) > 0.9
    ) and (
      (container_memory_usage_bytes / container_spec_memory_limit_bytes) >
      ((container_memory_usage_bytes offset 10m) / container_spec_memory_limit_bytes)
    ) and (
      predict_linear(container_memory_usage_bytes[10m], 5*60) > container_spec_memory_limit_bytes
    )
  for: 1m
  labels:
    severity: critical
  annotations:
    summary: "Pod {{ $labels.pod }} will OOM in ~5 minutes"
    description: "Memory at {{ $value }}%, growing, trend predicts OOM"

This alert requires three conditions: high memory usage, increasing memory usage, and trend prediction of OOM. Reduces false positives from pods that run at 90% memory but are stable.

Early Warning System That Prevents Late-Night Pages

Capacity Planning Alerts

Node capacity warnings before you're fucked:

- alert: NodeCapacityDanger
  expr: |
    (
      (sum by (node) (kube_pod_container_resource_requests_memory_bytes{container!="POD"})) /
      (sum by (node) (kube_node_status_allocatable_memory_bytes))
    ) > 0.8
  for: 10m
  labels:
    severity: warning
  annotations:
    summary: "Node {{ $labels.node }} at {{ $value | humanizePercentage }} memory capacity"
    description: "Add capacity soon or you'll be debugging resource pressure issues"

Storage alerts that give you time to act:

- alert: PVCFillingUp
  expr: |
    (
      (kubelet_volume_stats_used_bytes / kubelet_volume_stats_capacity_bytes) > 0.8
    ) and (
      predict_linear(kubelet_volume_stats_used_bytes[2h], 6*3600) >
      kubelet_volume_stats_capacity_bytes
    )
  for: 15m
  labels:
    severity: warning
  annotations:
    summary: "PVC {{ $labels.persistentvolumeclaim }} will be full in 6 hours"
    description: "At {{ $value | humanizePercentage }} usage, growing. Expand volume or clean up."
Certificate Monitoring That Doesn't Surprise You

Certificate expiration with enough warning:

- alert: CertExpiringSoon
  expr: (probe_ssl_earliest_cert_expiry - time()) / 86400 < 30
  for: 12h  # Don't spam for transient SSL check failures
  labels:
    severity: warning
  annotations:
    summary: "SSL cert for {{ $labels.instance }} expires in {{ $value | humanizeDuration }}"

- alert: CertExpiringVerySoon
  expr: (probe_ssl_earliest_cert_expiry - time()) / 86400 < 7
  for: 1h
  labels:
    severity: critical
  annotations:
    summary: "SSL cert for {{ $labels.instance }} expires in {{ $value | humanizeDuration }}"
    description: "Fix this now or your site will show certificate errors"

Kubernetes Monitoring Dashboard

Chaos Engineering That Doesn't Break Production

Controlled Chaos Testing

Splunk's chaos engineering best practices cover essential principles for implementing chaos testing without destroying your production environment.

Our chaos testing progression (learned the hard way):

  1. Dev environment: Kill everything, often. Break networking, fill disks, consume all memory.
  2. Staging with production load: Run chaos during synthetic load tests.
  3. Production during maintenance windows: Start with single pod failures.
  4. Production during low traffic: Graduate to network partitions and node failures.

Gremlin's Kubernetes chaos engineering guide provides the foundation for getting started safely.

LitmusChaos Architecture: LitmusChaos uses Kubernetes-native CRDs to orchestrate chaos experiments, with a control plane that manages experiment lifecycle and data collection for resilience validation.

Chaos schedule that won't get you fired:

## Weekly memory pressure test during low traffic
apiVersion: litmuschaos.io/v1alpha1
kind: CronChaosEngine
metadata:
  name: memory-pressure-tuesday
spec:
  schedule: "0 3 * * 2"  # Tuesday 3 AM
  jobTemplate:
    spec:
      experiments:
      - name: pod-memory-hog
        spec:
          components:
            env:
            - name: MEMORY_CONSUMPTION
              value: "256"  # Start small!
            - name: TOTAL_CHAOS_DURATION
              value: "120"  # 2 minutes only

Chaos validation monitoring:

LitmusChaos Architecture: LitmusChaos uses Kubernetes-native CRDs to orchestrate chaos experiments, with a control plane that manages experiment lifecycle and data collection for resilience validation.

- alert: ChaosExperimentWentWrong
  expr: |
    (
      chaos_result_verdict{verdict="Fail"} == 1
    ) and (
      time() - chaos_result_verdict_timestamp < 300
    )
  for: 0m
  labels:
    severity: critical
  annotations:
    summary: "Chaos experiment {{ $labels.experiment }} failed"
    description: "System didn't handle {{ $labels.experiment }} gracefully. Check incident response."

CI/CD Integration That Catches Regressions

Automated Resilience Testing

Litmus chaos engineering with comprehensive SRE practices shows how to integrate chaos testing into your deployment pipeline.

Pre-deployment resilience checks:

#!/bin/bash
## resilience-test.sh - Run before promoting to production

echo "Testing pod restart resilience..."
kubectl delete pod -l app=myapp -n staging --force
sleep 10

## Check if app recovered (replace YOUR_APP_URL with your actual health endpoint)
if ! curl -f YOUR_APP_URL/health; then
  echo "❌ App didn't recover from pod restart"
  exit 1
fi

echo "Testing database connection failure..."
## Temporarily point service to non-existent backend
kubectl patch service postgres -n staging -p '{"spec":{"selector":{"app":"fake-db"}}}'
sleep 30

## App should degrade gracefully, not return 500s
response=$(curl -s -o /dev/null -w "%{http_code}" YOUR_APP_URL/health)
if [[ $response == "500" ]]; then
  echo "❌ App returned 500 during DB failure (should degrade gracefully)"
  exit 1
fi

## Restore service
kubectl patch service postgres -n staging -p '{"spec":{"selector":{"app":"postgres"}}}'
echo "✅ Resilience tests passed"

Load testing with failure injection:

#!/bin/bash
## load-test-with-chaos.sh

echo "Starting baseline load test..."
hey -n 1000 -c 10 YOUR_APP_URL/api/health

echo "Load testing during pod failures..."
kubectl delete pod -l app=frontend --force &
hey -n 1000 -c 10 YOUR_APP_URL/api/search

echo "Load testing during database slowness..."
## Simulate slow database with network delay
kubectl exec deploy/postgres -- tc qdisc add dev eth0 root netem delay 200ms &
hey -n 500 -c 5 YOUR_APP_URL/api/search
kubectl exec deploy/postgres -- tc qdisc del dev eth0 root netem

echo "Load testing complete. Check error rates in Grafana."

The brutal reality: Most teams skip resilience testing because it's "too complex." Then they spend 10x more time debugging outages in production. These scripts take 30 minutes to set up and have prevented dozens of production incidents for us.

Your monitoring should predict problems, not just confirm them. Alert fatigue is real - every alert that fires should require action. If you're getting alerts you ignore, fix the alert or accept the risk, but don't train your team to ignore monitoring.

When Prevention Fails: Advanced Troubleshooting That Doesn't Waste Time

Debugging Kubernetes Like You're Being Paid by the Hour (Because You Are)

Kubernetes Troubleshooting Flowchart

Sometimes prevention isn't enough and shit still breaks. When that happens, you need debugging techniques that find the root cause fast, not generic troubleshooting that wastes hours chasing symptoms. Komodor's debugging guide covers the most common issues and how to solve them efficiently. LearnKube's visual troubleshooting guide provides a comprehensive flowchart that maps common deployment issues to their solutions.

The Three-Minute Rule: Triage or Die

Kubernetes Troubleshooting Process: Follow a systematic approach - triage first (user impact, blast radius), then diagnose (logs, metrics, events), and finally remediate (rollback, scale, restart).

In the first three minutes of an outage, your goal is triage, not diagnosis. Figure out the blast radius, impact scope, and whether you need to immediately rollback or apply emergency mitigations.

Quick Impact Assessment

Check these in order, spend 30 seconds max on each:

## 1. Are users affected right now?
curl -f https://httpbin.org/status/200 || echo \"Users can't reach us\"

## 2. Is it all services or just one?
kubectl get pods --all-namespaces | grep -v Running | head -10

## 3. Is the control plane fucked?
kubectl get nodes | grep NotReady
kubectl get componentstatuses  # Deprecated but still useful for quick checks

## 4. Are we hemorrhaging money?
aws cloudwatch get-metric-statistics --namespace AWS/ECS --metric-name CPUUtilization --start-time 2025-09-15T14:00:00Z --end-time 2025-09-15T15:00:00Z --period 300 --statistics Average

Emergency rollback decision matrix:

  • New deployment in the last 2 hours + users affected = rollback first, debug later
  • Infrastructure change in the last 6 hours + cluster instability = revert infrastructure
  • No recent changes + partial service impact = debug in place

LearnKube's rollback guide provides comprehensive examples of how to roll back breaking changes quickly.

The Emergency Rollback That Actually Works

Fast deployment rollback (saves your ass when the deployment is the problem):

#!/bin/bash
## emergency-rollback.sh - Keep this script ready

NAMESPACE=${1:-default}
DEPLOYMENT=${2}

if [[ -z \"$DEPLOYMENT\" ]]; then
  echo \"Usage: $0 <namespace> <deployment>\"
  exit 1
fi

echo \"Rolling back $DEPLOYMENT in $NAMESPACE...\"

## Immediate rollback
kubectl rollout undo deployment/$DEPLOYMENT -n $NAMESPACE

## Monitor the rollback
kubectl rollout status deployment/$DEPLOYMENT -n $NAMESPACE --timeout=300s

## Verify health
sleep 30
kubectl get pods -n $NAMESPACE -l app=$DEPLOYMENT

This script has saved us 20+ minutes during critical incidents when we needed to rollback immediately while debugging the actual cause. Honeycomb's debugging guide explains how to correlate deployment changes with performance issues for faster root cause analysis.

Advanced Cluster Debugging: Beyond kubectl get pods

etcd Debugging When Everything Is Slow

When your cluster feels sluggish, etcd is usually the culprit:

## Check etcd disk performance (run on etcd nodes)
kubectl exec -n kube-system etcd-master-node -- etcdctl endpoint status --write-out=table

## Check etcd member health
kubectl exec -n kube-system etcd-master-node -- etcdctl endpoint health --cluster

## Most important: check etcd database size
kubectl exec -n kube-system etcd-master-node -- etcdctl endpoint status --write-out=json | jq '.[] | .Status.dbSize'

etcd Performance Monitoring

etcd database size over 2GB? Your cluster is going to start choking. We learned this when our etcd hit 6GB and API calls started timing out. The solution was compaction and defragmentation. Splunk's observability troubleshooting guide shows how to use monitoring data to identify etcd performance bottlenecks.

## Compact old revisions (careful in production!)
kubectl exec -n kube-system etcd-master-node -- etcdctl compact $(kubectl exec -n kube-system etcd-master-node -- etcdctl endpoint status --write-out=json | jq -r '.[] | .Status.header.revision - 100000')

## Defragment (one member at a time!)
kubectl exec -n kube-system etcd-master-node -- etcdctl defrag

API Server Performance Investigation

When kubectl commands are slow or timing out:

## Check API server request latency
kubectl top nodes  # If this is slow, API server is struggling

## Check for API server overload
kubectl get --raw /metrics | grep apiserver_current_inflight_requests

## Most useful: check what's hammering the API server
kubectl get --raw /metrics | grep apiserver_request_total | sort -nr | head -10

Common API server killers we've seen:

  • Controllers stuck in infinite loops (Operators with bugs)
  • Applications doing kubectl get pods every second
  • Broken CI/CD pipelines spamming deployments
  • Misconfigured HPA scaling every few seconds

Network Debugging That Actually Finds Problems

Kubernetes Networking Architecture

Sysdig's Kubernetes monitoring best practices covers deep system visibility techniques essential for troubleshooting network issues.

Essential kubectl Debugging Commands: The key commands for troubleshooting include kubectl get events, kubectl describe, kubectl logs, and kubectl exec for getting into failing containers.

When services can't talk to each other:

## Test pod-to-pod networking
kubectl run netshoot --rm -i --tty --image nicolaka/netshoot -- bash

## From inside the netshoot pod:
nslookup kubernetes.default.svc.cluster.local  # DNS working?
curl -v http://[SERVICE-NAME].[NAMESPACE].svc.cluster.local:8080/health  # Example service check
traceroute [SERVICE-NAME].[NAMESPACE].svc.cluster.local  # Where do packets die?

The most common networking fuck-ups:

  1. Service selector mismatch: kubectl get endpoints shows no IPs
  2. Network policies blocking traffic: kubectl get networkpolicies
  3. DNS resolution broken: Check CoreDNS pods and configuration
  4. MTU issues: Especially with overlay networks like Calico

Spacelift's observability guide explains how to implement comprehensive logging and monitoring that catches these issues early.

Resource Pressure Debugging

Overcast's debugging tools guide covers 13 essential tools every Kubernetes engineer should master for effective debugging.

When nodes are under memory/CPU pressure:

## Check resource pressure on nodes
kubectl describe nodes | grep -A 5 Conditions

## Find memory/CPU hogs
kubectl top pods --all-namespaces --sort-by=memory
kubectl top pods --all-namespaces --sort-by=cpu

## Check for pods without resource limits (the resource hogs)
kubectl get pods --all-namespaces -o jsonpath='{range .items[*]}{.metadata.namespace}{\"	\"}{.metadata.name}{\"	\"}{.spec.containers[*].resources.limits.memory}{\"
\"}{end}' | grep -v '	[0-9]'

Kubernetes Resource Monitoring

Resource pressure symptoms:

  • Pods stuck in Pending state
  • Nodes marked as NotReady
  • Applications getting OOMKilled repeatedly
  • Cluster autoscaler going crazy

Storage and Persistent Volume Debugging

PVC Troubleshooting That Actually Works

When pods can't mount volumes:

## Check PVC status
kubectl get pvc --all-namespaces | grep -v Bound

## Describe the problematic PVC
kubectl describe pvc your-pvc-name -n namespace

## Check the underlying PV
kubectl describe pv pv-name

## For AWS EBS issues, check the CSI driver
kubectl logs -n kube-system -l app=ebs-csi-controller

The three most common PVC disasters:

  1. No available storage classes: Check kubectl get storageclass
  2. Zone mismatch: PV in us-east-1a, pod scheduled in us-east-1b
  3. CSI driver problems: Usually permissions or AWS API rate limits

Rootly's incident management best practices covers strategies for preventing and managing these storage-related incidents effectively.

Storage Performance Issues

When your database is slow and you suspect storage:

## Test disk performance from inside a pod
kubectl run disk-test --rm -i --tty --image ubuntu -- bash

## Inside the pod:
apt update && apt install -y fio
fio --name=random-write --ioengine=libaio --rw=randwrite --bs=4k --size=1G --numjobs=1 --iodepth=8 --runtime=60 --time_based --group_reporting

## Look for IOPS < 1000 or latency > 10ms for EBS gp3

Application-Level Debugging Techniques

Optiblack's logging best practices provides essential guidance for enhancing security and streamlining troubleshooting through effective log management.

Service Discovery and Load Balancing Issues

When some requests succeed and others fail randomly:

## Check service endpoints
kubectl get endpoints your-service-name -n namespace

## See which pods are receiving traffic
kubectl logs -f deployment/your-app -n namespace | grep \"request_id\"

## Check if load balancing is even
for i in {1..10}; do curl -s http://[SERVICE-NAME].[NAMESPACE].svc.cluster.local:8080/health | grep hostname; done

Intermittent failures usually mean:

  • Some pods are healthy, others aren't
  • Load balancer not removing unhealthy endpoints
  • Pod readiness probes are lying (returning 200 when pod is broken)

Memory Leak Detection and Investigation

When pods keep getting OOMKilled:

## Check OOMKill history
journalctl -u kubelet | grep \"killed as a result of limit\"

## Monitor memory usage over time
kubectl top pod your-pod --containers | watch -n 5

## Get detailed memory breakdown from inside the pod
kubectl exec your-pod -- cat /proc/meminfo
kubectl exec your-pod -- ps aux --sort=-%mem | head -10

Memory leak patterns we've caught:

  • Gradual increase over days (classic leak)
  • Sudden spikes after specific operations (resource not freed after requests)
  • Memory usage that never decreases (accumulating caches/buffers)

Advanced Log Analysis for Kubernetes

Centralized Logging Investigation

When you need to correlate logs across services:

## Get logs with timestamps and pod info
kubectl logs -f --timestamps deployment/your-app -n namespace

## Search for errors across all pods in a deployment
kubectl logs --selector=app=your-app --all-containers=true -n namespace | grep ERROR

## Get logs from crashed/restarted pods
kubectl logs your-pod --previous -n namespace

Log analysis tricks:

  • Always include request IDs to trace requests across services
  • Search for correlation IDs to track user sessions
  • Look for error patterns right before OOMKills or crashes

Performance Troubleshooting with Logs

Finding performance bottlenecks in application logs:

## Find slow requests (assuming structured JSON logs)
kubectl logs deployment/your-app -n namespace | jq 'select(.response_time > 1000)'

## Track error rates over time
kubectl logs deployment/your-app -n namespace | grep ERROR | tail -100 | awk '{print $1}' | sort | uniq -c

Emergency Recovery Procedures

When the Cluster Is Completely Fucked

Nuclear options when nothing else works:

## 1. Restart core components (careful!)
kubectl delete pod -n kube-system -l component=kube-apiserver
kubectl delete pod -n kube-system -l k8s-app=kube-dns

## 2. Drain problematic nodes
kubectl drain node-name --ignore-daemonsets --delete-emptydir-data --force

## 3. Emergency pod eviction
kubectl delete pod problematic-pod --grace-period=0 --force

Recovery priority order:

  1. Get control plane stable (API server, etcd, scheduler)
  2. Restore core services (DNS, ingress, monitoring)
  3. Bring back applications in order of business priority

Cluster State Backup and Recovery

What to backup before major changes:

## Backup cluster state
kubectl get all --all-namespaces -o yaml > cluster-backup-$(date +%Y%m%d).yaml

## Backup etcd (if you have access)
etcdctl snapshot save backup.db

## Backup custom resources
kubectl get crd -o name | xargs -I {} kubectl get {} --all-namespaces -o yaml > crd-backup.yaml

The brutal truth about Kubernetes debugging: Most outages are caused by human error, not infrastructure failure. The faster you can eliminate or confirm human changes as the cause, the faster you'll solve the incident.

Keep debugging runbooks current. Update them after every major incident. The next outage will happen when someone new is on-call, and they'll need these procedures to save their sanity and your business.

FAQ: The Questions You Ask at 3 AM When Everything's on Fire

Q

"Why is my etcd eating all the disk space and how do I stop it before it kills my cluster?"

A

Short answer: etcd keeps all historical data forever unless you compact it. Your cluster creates thousands of objects daily and etcd logs every change.

Fix it now:

## Check current etcd size
kubectl exec -n kube-system etcd-master -- etcdctl endpoint status --write-out=table

## Compact old revisions (keeps last 100k revisions)
kubectl exec -n kube-system etcd-master -- etcdctl compact $(kubectl exec -n kube-system etcd-master -- etcdctl endpoint status --write-out=json | jq -r '.[] | .Status.header.revision - 100000')

## Defrag to reclaim space
kubectl exec -n kube-system etcd-master -- etcdctl defrag

Prevent it: Set up auto-compaction in etcd config and monitor database size. We alert when etcd hits 4GB because 8GB+ causes cluster performance problems.

Q

"My Prometheus is using 50GB of RAM and still running out of memory. What the hell?"

A

Short answer: High-cardinality metrics are killing you. Someone is creating metrics with unique labels for every user/request/UUID.

Find the culprits:

## Connect to Prometheus and check cardinality
curl http://[PROMETHEUS-HOST]:9090/api/v1/label/__name__/values | jq '.data[]' | wc -l

## Find high-cardinality metric families
curl 'http://[PROMETHEUS-HOST]:9090/api/v1/query?query={__name__=~".+"}' | jq '.data.result | group_by(.__name__) | map({name: .[0].__name__, count: length}) | sort_by(.count) | reverse | .[0:10]'

Fix it: Delete the problematic metrics and fix your applications to not create unique labels. We once had a metric with request_id as a label - that created 10 million time series.

Q

"ArgoCD is stuck syncing and my deployment is half-broken. How do I force it to just fucking work?"

A

Short answer: ArgoCD gets confused by resource conflicts, failed validations, or circular dependencies.

Emergency fixes:

## Force hard refresh of application state
argocd app get your-app --hard-refresh

## If that doesn't work, force replace everything
argocd app sync your-app --force --replace

## Nuclear option: delete and recreate the ArgoCD application
argocd app delete your-app
argocd app create your-app --repo https://github.com/kubernetes/examples --path manifests/

Why this happens: Usually someone applied resources manually with kubectl, creating drift between Git and cluster state. ArgoCD doesn't know how to reconcile the differences.

Q

"My pods are getting OOMKilled but kubectl top shows they're only using 50% memory. What's lying to me?"

A

Short answer: kubectl top shows working set memory, not total memory usage. The OOMKiller looks at RSS + cache, which can be much higher.

Get real memory usage:

## Check actual memory usage from inside the pod
kubectl exec your-pod -- cat /proc/meminfo | grep -E "MemTotal|MemAvailable|MemFree"

## See what processes are using memory
kubectl exec your-pod -- ps aux --sort=-%mem | head -10

## Check memory cgroups (the actual limit enforcement)
kubectl exec your-pod -- cat /sys/fs/cgroup/memory/memory.usage_in_bytes
kubectl exec your-pod -- cat /sys/fs/cgroup/memory/memory.limit_in_bytes

Why kubectl top lies: It reports working set memory (actively used pages) while the OOMKiller counts all allocated memory including buffers and caches.

Q

"DNS resolution is randomly failing in my cluster. Some pods can resolve domains, others can't. Why?"

A

Short answer: CoreDNS is probably resource-starved, misconfigured, or you're hitting DNS rate limits.

Debug DNS issues:

## Test DNS from a pod
kubectl run dnstest --rm -i --tty --image nicolaka/netshoot -- nslookup kubernetes.default.svc.cluster.local

## Check CoreDNS pod health
kubectl get pods -n kube-system -l k8s-app=kube-dns

## Look at CoreDNS logs for errors
kubectl logs -n kube-system -l k8s-app=kube-dns

## Check DNS configuration
kubectl get configmap coredns -n kube-system -o yaml

Common DNS fuck-ups: CoreDNS pods without enough CPU/memory, DNS forwarding misconfigured, network policies blocking DNS traffic, or external DNS providers rate-limiting your cluster.

Q

"My ingress controller is returning 503s randomly but the backend pods are healthy. What's broken?"

A

Short answer: Load balancer health checks are probably failing, or there's a mismatch between service endpoints and ingress backend configuration.

Debug ingress issues:

## Check ingress configuration
kubectl describe ingress your-ingress

## Verify service endpoints are populated
kubectl get endpoints your-service

## Check ingress controller logs
kubectl logs -n ingress-nginx -l app.kubernetes.io/name=ingress-nginx

## Test backend connectivity from ingress controller
kubectl exec -n ingress-nginx deploy/ingress-nginx-controller -- curl -v http://[SERVICE-NAME].[NAMESPACE].svc.cluster.local/health

Why this happens: Service selector doesn't match pod labels, pods aren't ready (readiness probe failing), or ingress controller can't reach the service due to network policies.

Q

"My autoscaler keeps scaling up and down constantly. How do I make it stop having seizures?"

A

Short answer: Your scaling metrics are too sensitive, scaling policies are too aggressive, or you have competing autoscalers fighting each other.

Fix HPA oscillation:

## Check current HPA status and metrics
kubectl describe hpa your-hpa

## Look at scaling events
kubectl get events --sort-by=.metadata.creationTimestamp | grep HorizontalPodAutoscaler

## Adjust scaling policies to be less aggressive
kubectl patch hpa your-hpa -p '{"spec":{"behavior":{"scaleDown":{"stabilizationWindowSeconds":300},"scaleUp":{"stabilizationWindowSeconds":60}}}}'

Stabilization settings that actually work: Scale up quickly (60s window), scale down slowly (5-10 minute window). Set target utilization to 70% not 50% to avoid constant scaling.

Q

"My certificates expired and took down the whole site. How do I quickly fix this without killing cert-manager?"

A

Short answer: cert-manager probably tried to renew but failed. Check rate limits, DNS validation, or ACME account issues.

Emergency certificate fixes:

## Check certificate status
kubectl describe certificate your-cert

## Check cert-manager logs for renewal errors
kubectl logs -n cert-manager deploy/cert-manager

## Force certificate renewal
kubectl delete secret your-cert-tls
kubectl annotate certificate your-cert cert-manager.io/issue-temporary-certificate="true"

## If Let's Encrypt rate limited, switch to staging temporarily
kubectl patch issuer your-issuer -p '{"spec":{"acme":{"server":"https://acme-staging-v02.api.letsencrypt.org/directory"}}}'

Prevention: Monitor certificate expiration dates and renewal attempts. We alert at 30 days and 7 days before expiration.

Q

"My cluster nodes keep going NotReady and pods get evicted. What's causing this instability?"

A

Short answer: Node resource pressure, networking issues, or kubelet problems are making nodes appear unhealthy to the control plane.

Diagnose node issues:

## Check node conditions
kubectl describe nodes | grep -A 5 Conditions

## Check kubelet logs on the problematic node
journalctl -u kubelet -f

## Look for resource pressure indicators
kubectl top nodes
kubectl describe node problematic-node | grep -A 10 Pressure

Common causes: Out of disk space, memory pressure causing OOMKills, network partitions between node and control plane, or kubelet getting OOMKilled due to resource limits.

Q

"I rolled back a deployment but it's still broken. Why didn't the rollback fix anything?"

A

Short answer: The problem isn't in your application code - it's probably in configuration, infrastructure, dependencies, or external services.

Rollback troubleshooting:

## Verify rollback actually happened
kubectl rollout history deployment/your-app
kubectl describe deployment your-app | grep Image

## Check if the issue is environmental
kubectl logs deployment/your-app | grep -i error
kubectl get events --sort-by=.metadata.creationTimestamp | tail -20

## Test if the previous version actually works in current environment
kubectl run test-old-version --image=your-app:previous-version --rm -i --tty -- /bin/sh

Why rollbacks fail: Database migrations that can't be reversed, external API changes, configuration drift, or infrastructure issues that affect all versions equally.

Q

"How do I tell if my Kubernetes cluster is about to completely shit the bed?"

A

Short answer: Monitor control plane health, resource trends, and error rates across core components.

Early warning indicators:

## Check control plane component health
kubectl get componentstatuses

## Monitor API server latency and errors
kubectl get --raw /metrics | grep apiserver_request_duration_seconds

## Check etcd health and size
kubectl exec -n kube-system etcd-master -- etcdctl endpoint health

## Look for resource pressure across nodes
kubectl top nodes
kubectl describe nodes | grep -A 5 Pressure

Red flags: etcd over 6GB, API server P99 latency over 1 second, any control plane pods restarting frequently, nodes with memory/disk pressure, or core services (DNS, ingress) showing errors.

The pattern here is clear: most outages are predictable and preventable if you know what to monitor and how to interpret the signals. The questions you ask during an outage are usually the same metrics you should have been alerting on before the outage.

Monitoring Tools Reality Check: What Actually Works vs. What Sounds Good

Tool

Good For

Sucks At

Real Cost

When We Use It

Prometheus

Metrics collection, alerting rules, time series data

Memory usage (50GB+ easily), storage management, high-cardinality metrics

"$300-800/month AWS infrastructure for medium clusters"

Core metrics, alerting, trending analysis

Grafana

Dashboards, visualization, multi-datasource queries

Performance with 50+ panels, alerting (use Prometheus instead), version upgrades breaking everything

"$0 (OSS) or $200-500/month (Cloud)"

All our dashboards and visualization

Jaeger

Distributed tracing, request flow analysis

Storage costs with high traffic, query performance, UI responsiveness

"$400-1200/month for trace storage"

Debugging complex microservice issues

ELK Stack

Log aggregation, search, centralized logging

Elasticsearch memory hunger, cluster management complexity, licensing costs

"$800-2000/month including infrastructure"

Log analysis and incident investigation

New Relic

Application monitoring, synthetic checks, mobile app performance

Pricing scales brutally with data ingestion, vendor lock-in, limited Kubernetes deep-dive

"$300-3000/month depending on usage"

Application performance monitoring

Datadog

All-in-one monitoring, great UI, extensive integrations

Pricing escalates quickly, data retention costs, complex billing

"$500-5000/month (seriously, check your bill monthly)"

Teams that want everything in one place

AlertManager

Alert routing, grouping, silencing, escalation

Configuration complexity, webhook reliability, UI frustration

"$0 (part of Prometheus)"

All our alert routing and on-call management

PagerDuty

Incident management, escalation, on-call scheduling

Cost per user, integration setup pain, alert fatigue if misconfigured

"$30-50/user/month"

On-call rotations and incident escalation

UptimeRobot

External monitoring, status pages, simple setup

Limited deep monitoring, basic alerting, external perspective only

"$7-20/month"

External health checks and customer status pages

Litmus

Chaos engineering, failure injection, experiment management

Learning curve, potential for breaking things, limited scheduling

"$0 (OSS)"

Controlled chaos testing and resilience validation

Resources That Actually Help When You're Debugging at 3 AM

Related Tools & Recommendations

integration
Recommended

GitOps Integration Hell: Docker + Kubernetes + ArgoCD + Prometheus

How to Wire Together the Modern DevOps Stack Without Losing Your Sanity

prometheus
/integration/docker-kubernetes-argocd-prometheus/gitops-workflow-integration
100%
howto
Recommended

Set Up Microservices Monitoring That Actually Works

Stop flying blind - get real visibility into what's breaking your distributed services

Prometheus
/howto/setup-microservices-observability-prometheus-jaeger-grafana/complete-observability-setup
66%
troubleshoot
Similar content

Fix Kubernetes ImagePullBackOff Error - The Complete Battle-Tested Guide

From "Pod stuck in ImagePullBackOff" to "Problem solved in 90 seconds"

Kubernetes
/troubleshoot/kubernetes-imagepullbackoff/comprehensive-troubleshooting-guide
47%
troubleshoot
Similar content

Fix Kubernetes OOMKilled Pods - Production Memory Crisis Management

When your pods die with exit code 137 at 3AM and production is burning - here's the field guide that actually works

Kubernetes
/troubleshoot/kubernetes-oom-killed-pod/oomkilled-production-crisis-management
47%
integration
Similar content

Making Pulumi, Kubernetes, Helm, and GitOps Actually Work Together

Stop fighting with YAML hell and infrastructure drift - here's how to manage everything through Git without losing your sanity

Pulumi
/integration/pulumi-kubernetes-helm-gitops/complete-workflow-integration
46%
integration
Recommended

Falco + Prometheus + Grafana: The Only Security Stack That Doesn't Suck

Tired of burning $50k/month on security vendors that miss everything important? This combo actually catches the shit that matters.

Falco
/integration/falco-prometheus-grafana-security-monitoring/security-monitoring-integration
35%
tool
Recommended

Grafana - The Monitoring Dashboard That Doesn't Suck

integrates with Grafana

Grafana
/tool/grafana/overview
35%
tool
Recommended

Helm - Because Managing 47 YAML Files Will Drive You Insane

Package manager for Kubernetes that saves you from copy-pasting deployment configs like a savage. Helm charts beat maintaining separate YAML files for every dam

Helm
/tool/helm/overview
28%
tool
Recommended

Fix Helm When It Inevitably Breaks - Debug Guide

The commands, tools, and nuclear options for when your Helm deployment is fucked and you need to debug template errors at 3am.

Helm
/tool/helm/troubleshooting-guide
28%
tool
Recommended

Prometheus - Scrapes Metrics From Your Shit So You Know When It Breaks

Free monitoring that actually works (most of the time) and won't die when your network hiccups

Prometheus
/tool/prometheus/overview
27%
integration
Recommended

GitHub Actions + Docker + ECS: Stop SSH-ing Into Servers Like It's 2015

Deploy your app without losing your mind or your weekend

GitHub Actions
/integration/github-actions-docker-aws-ecs/ci-cd-pipeline-automation
26%
howto
Recommended

Stop Docker from Killing Your Containers at Random (Exit Code 137 Is Not Your Friend)

Three weeks into a project and Docker Desktop suddenly decides your container needs 16GB of RAM to run a basic Node.js app

Docker Desktop
/howto/setup-docker-development-environment/complete-development-setup
26%
troubleshoot
Recommended

CVE-2025-9074 Docker Desktop Emergency Patch - Critical Container Escape Fixed

Critical vulnerability allowing container breakouts patched in Docker Desktop 4.44.3

Docker Desktop
/troubleshoot/docker-cve-2025-9074/emergency-response-patching
26%
tool
Similar content

ArgoCD Production Troubleshooting - Fix the Shit That Breaks at 3AM

The real-world guide to debugging ArgoCD when your deployments are on fire and your pager won't stop buzzing

Argo CD
/tool/argocd/production-troubleshooting
25%
tool
Recommended

Mongoose - Because MongoDB's "Store Whatever" Philosophy Gets Messy Fast

built on Mongoose

Mongoose
/tool/mongoose/overview
20%
compare
Recommended

Rust, Go, or Zig? I've Debugged All Three at 3am

What happens when you actually have to ship code that works

go
/compare/rust/go/zig/modern-systems-programming-comparison
20%
tool
Similar content

etcd - The Database That Keeps Kubernetes Working

etcd stores all the important cluster state. When it breaks, your weekend is fucked.

etcd
/tool/etcd/overview
19%
tool
Similar content

Flux Performance Troubleshooting - When GitOps Goes Wrong

Fix reconciliation failures, memory leaks, and scaling issues that break production deployments

Flux v2 (FluxCD)
/tool/flux/performance-troubleshooting
17%
alternatives
Recommended

GitHub Actions is Fine for Open Source Projects, But Try Explaining to an Auditor Why Your CI/CD Platform Was Built for Hobby Projects

integrates with GitHub Actions

GitHub Actions
/alternatives/github-actions/enterprise-governance-alternatives
17%
integration
Recommended

GitHub Actions + Jenkins Security Integration

When Security Wants Scans But Your Pipeline Lives in Jenkins Hell

GitHub Actions
/integration/github-actions-jenkins-security-scanning/devsecops-pipeline-integration
17%

Recommendations combine user behavior, content similarity, research intelligence, and SEO optimization