This is how I finally got it working after taking down prod twice and spending an entire weekend debugging why Prometheus was eating terabytes of disk space. First time I half-assed it and ignored the docs. Second time I actually read them but still missed critical shit. Fourth deployment finally worked because I learned from being an idiot.
Prerequisites (The Shit That Will Break If You Skip It)
Don't be like me and skip these. I learned the hard way:
- Kubernetes 1.24+ or Docker (don't use Docker Swarm, it's dead)
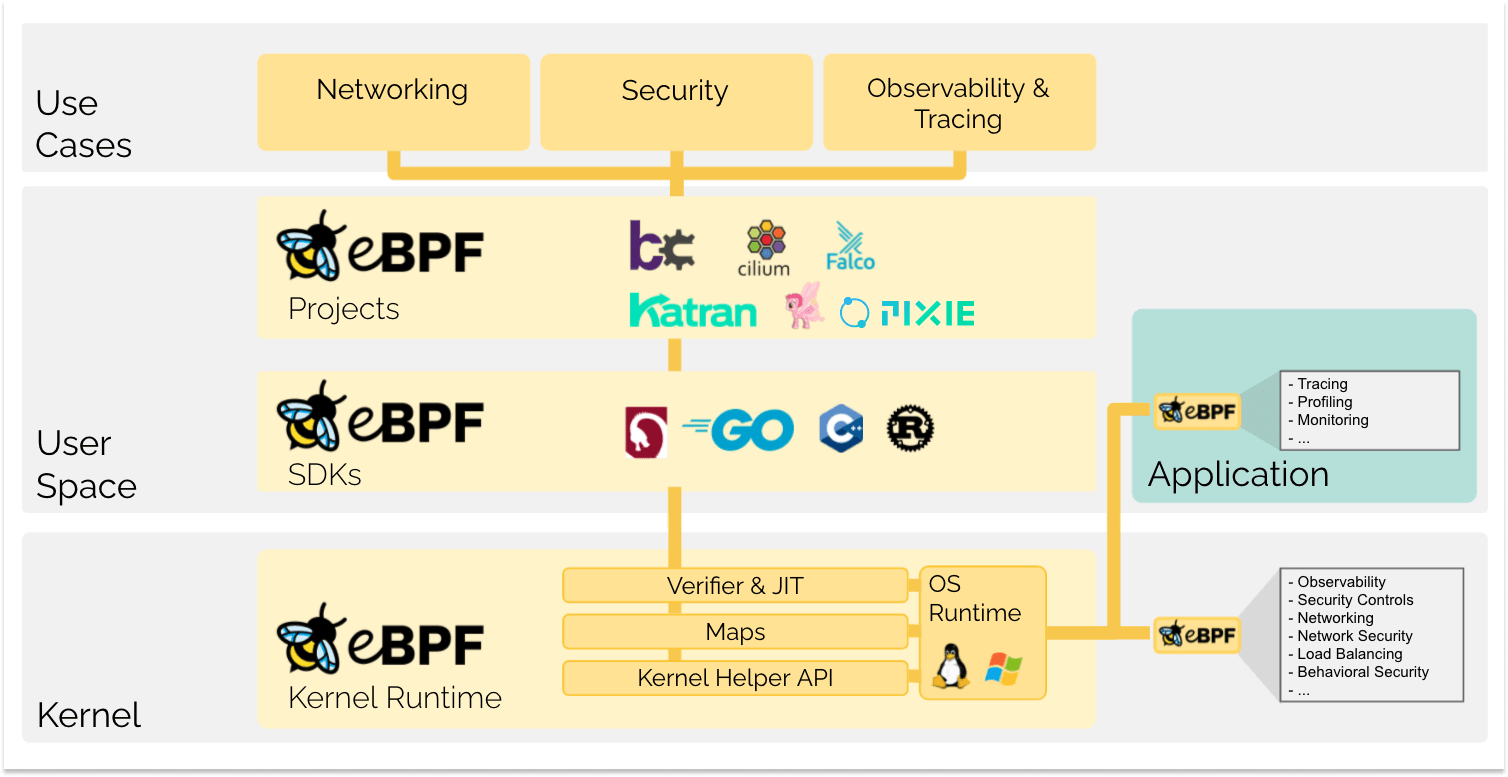
- Kernel 4.18+ for eBPF - but seriously use 5.8+ or the modern eBPF probe will randomly fail
- At least 100GB storage for Prometheus, but I'd start with 200GB because you'll always need more (learned this during a security incident when we ran out of space)
- Open network policies - strict policies will block metric scraping and you'll wonder why nothing works
Pro tip: If you have Kubernetes, use it. The Falco Helm charts actually work, which is shocking considering most Helm charts are broken trash maintained by people who've never run production systems. Bare metal deployments work too but you'll be hand-crafting service discovery configs like some kind of infrastructure caveman.
Phase 1: Deploy Falco (Prepare for It to Break)
Step 1: Install Falco with Prometheus metrics. This config actually works:
## falco-values.yaml - don't copy from random blogs, they're all wrong
falco:
  grpc:
    enabled: true
  grpcOutput:
    enabled: true
  http_output:
    enabled: false  # disable if not using falcosidekick, causes issues

## Prometheus metrics (works since 0.38, stable in 0.41.0)
metrics:
  enabled: true
  interval: 30s  # don't use 1h like the docs say, you'll miss events
  resource_utilization:
    enabled: true
  rules_counters:
    enabled: true
  base_syscalls:
    enabled: false  # generates too much noise in prod
Step 2: Deploy and immediately troubleshoot when it fails:
helm repo add falcosecurity https://falcosecurity.github.io/charts
helm install falco falcosecurity/falco \
  --namespace falco-system \
  --create-namespace \
  --values falco-values.yaml
When it inevitably breaks:
driver loading failed - your kernel is too old or missing BTF support. Ubuntu 18.04 users are particularly fucked herepermission denied accessing /proc - SELinux is cockblocking everything, just set privileged: true and move onpod stays in Pending - you forgot to create the namespace first because the --create-namespace flag is a lying piece of shit
Version 0.41 finally fixed that bug where metrics would randomly stop working for no reason. If you're on older versions, upgrade immediately or accept that you'll miss critical events during actual incidents.
Prometheus configuration is where most people fuck up. Here's what actually works without consuming terabytes of storage:
## prometheus-config.yaml - the version that works in production
global:
  scrape_interval: 30s  # 15s is overkill for security metrics
  evaluation_interval: 30s

scrape_configs:
  - job_name: 'falco'
    kubernetes_sd_configs:
      - role: pod
        namespaces:
          names: ['falco-system']
    relabel_configs:
      - source_labels: [__meta_kubernetes_pod_name]
        action: keep
        regex: falco.*
      - source_labels: [__address__]
        action: replace
        target_label: __address__
        regex: (.+):.*
        replacement: $1:8765  # this port needs to be open
    scrape_interval: 15s  # security metrics need to be frequent
    metric_relabel_configs:
      - source_labels: [__name__]
        regex: 'falco_k8s_audit.*'  # drop k8s audit metrics, too noisy
        action: drop
The metrics that actually matter:
falco_events_total - how many security events (if this is 0, something's broken)falco_outputs_queue_size - when this gets high, you're dropping eventsfalco_kernel_module_loaded - 0 means your driver failed to loadfalco_rules_loaded - sanity check that rules are working
Pro tip: Stop trying to scrape falcosidekick unless you actually deployed it. Half the tutorial configs on the internet assume you're running it when you're probably not.
Phase 3: Grafana (The Part That Takes Forever to Get Right)
The official Falco dashboard exists but it looks like someone designed it in 2015 and the queries are optimized for demo environments where nothing actually happens.
Import process (because it's never straightforward):
- Navigate to Grafana UI (pray it loaded this time)
- Import dashboard 17319 from grafana.com
- Watch half the panels error out because the queries don't match your environment
- Spend the next 4 hours fixing queries that should have worked out of the box
- Build alerts that don't fire every time someone runs sudo
Queries that actually work in production:
## Events per minute (not per second, that's too granular)
rate(falco_events_total[1m]) * 60

## Queue size that indicates problems
falco_outputs_queue_size > 1000

## Rules that are actually firing (filter out test rules)
increase(falco_events_total{rule!~\".*test.*\"}[5m])
Testing (Use This to Confirm You're Not Just Watching a Broken System)
Don't trust that it works until you test it. The Falco event generator actually triggers security events:
## This will generate real security events to test your setup
kubectl run falco-event-generator \
  --image=falcosecurity/event-generator:latest \
  --rm -it --restart=Never -- run syscall
What should happen (and what fails):
- Event generator triggers container escapes and file system events
- Falco detects them and increments
falco_events_total metric
- Prometheus scrapes the new metric values (check the targets page)
- Grafana shows the events in dashboards (refresh manually, auto-refresh is broken)
- Alert rules fire and spam your Slack channel
If nothing happens: Check the Falco logs with kubectl logs -n falco-system daemonset/falco. 90% of the time it's either the driver failed to load or some permission got fucked up.
Resource allocation that works in the real world:
- Start with 500MB RAM per node, tune down based on actual usage
- 0.2-0.5 CPU cores - database nodes need more, web servers need less
- If
falco_outputs_queue_size stays above 1000, you need more resources or better buffer tuning
Storage planning so your CFO doesn't murder you:
- Small cluster (10-50 nodes): maybe a few GB per month, depends on how noisy your workloads are
- Medium cluster (50-200 nodes): 15-30GB per month if you tune the rules properly
- Large cluster (200+ nodes): 80-150GB+ per month, definitely start sampling at this point or your disk will explode
Grafana optimization (because waiting 30 seconds for a dashboard to load is bullshit):
- Use dashboard variables to filter by node/namespace
- Don't query more than 24 hours of data without aggregation unless you like watching spinners
- Enable query caching or prepare for dashboards that take forever to load
The Gotchas That Will Bite You
eBPF driver pain: Older kernels (Ubuntu 18.04, CentOS 7) don't support the modern eBPF stuff. Falco falls back to kernel modules, which need kernel headers that nobody ever installs by default. Cue three hours of package hunting.
Network policy nightmare: Strict network policies block port 8765. Symptoms: all Prometheus targets show as down, no metrics anywhere, and you'll spend 6 hours troubleshooting before realizing the firewall is eating everything.
Alert spam hell: Default rules trigger on every sudo command and container restart. Day one you'll get 50,000 alerts about normal system behavior. Budget a month minimum for rule tuning or your team will revolt.
Silent death: Resource limits cause event dropping with zero obvious symptoms. Watch falco_outputs_queue_size like your job depends on it - when it spikes, you're missing the actual security events you deployed this to catch.
This setup works in production if you actually tune it. Most teams deploy it, get flooded with alerts about every sudo command, give up after a week, and go back to paying Splunk. Don't be those teams.
Bottom line: Follow this guide, spend a month tuning the noise out, and you'll have security monitoring that catches real threats instead of charging you per gigabyte. The "free" part is licensing - you'll still pay with your time and sanity.
Reality check: This saves you $200-400k per year compared to enterprise vendors while catching runtime container threats that SIEMs completely miss. But it only works if you have engineers who understand Kubernetes, can debug eBPF issues, and won't quit when the initial alert flood hits.
That's the deployment reality. Now let's talk costs and what else will probably break.