What Actually Happens When Your Pod Gets OOMKilled
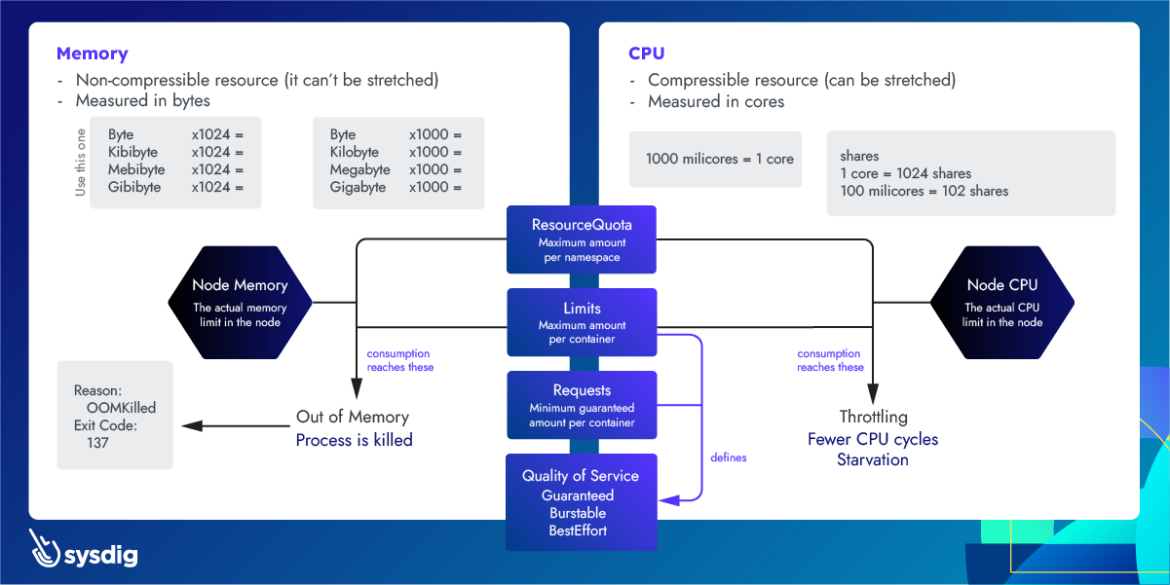
When you see OOMKilled with exit code 137, you're witnessing the Linux kernel's nuclear option for memory management in action. The Out-of-Memory killer (OOMKiller) executes processes to prevent complete system collapse when memory runs out. But here's what nobody tells you: the OOMKiller doesn't just kill random processes - it's actually doing complex calculations to determine which process "deserves" to die. Understanding this Linux memory management mechanism is the difference between fixing the symptoms and solving the actual problem.
The OOMKilled Process Flow:
- Memory pressure detected: Either the pod exceeds its memory limit or the node runs critically low on memory
- OOM score calculation: The kernel assigns oom_score values to all processes based on memory usage and priority
- Process selection: The process with the highest score gets SIGKILL (signal 9) - immediate termination with no cleanup. Learn more about OOM killer process selection
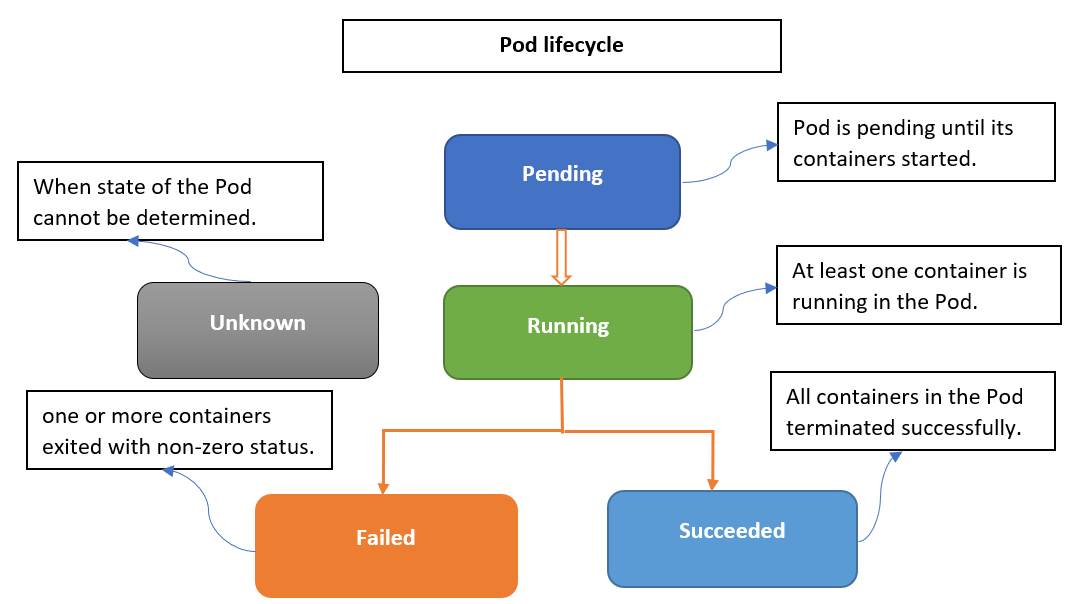
- Container restart: Kubernetes sees the exit code 137 and attempts to restart the pod based on the restart policy
Advanced OOMKilled Diagnosis Techniques
Step 1: Comprehensive Event Analysis
Beyond basic kubectl describe pod, use advanced kubectl debugging techniques and event sorting to understand the memory failure timeline. The Kubernetes troubleshooting guide provides comprehensive debugging strategies.
## Get detailed events with timestamps for memory-related issues
kubectl get events --sort-by='.lastTimestamp' --field-selector reason=OOMKilling

## Filter events for specific pod with memory context
kubectl get events --field-selector involvedObject.name=your-pod-name \
  -o custom-columns=TIME:.lastTimestamp,REASON:.reason,MESSAGE:.message

## Check node-level events that might indicate system memory pressure
kubectl get events --all-namespaces --field-selector type=Warning \
  | grep -E "(MemoryPressure|OOM|memory)"
War story from the trenches: Black Friday 2024, 2:47 AM. OOMKilled alerts going off like machine gun fire - every 30 seconds across different pods. First thought: "Fucking memory leaks in the checkout service." Spent the first hour digging through application logs looking for the bug that doesn't exist.
Then I noticed something weird in the timestamps. Every OOMKill happened at exactly the same time across the cluster. Memory leaks don't work that way - they're gradual, not synchronized.
Turns out some genius had "optimized" our fluentd DaemonSet configuration to buffer 80% of node memory "for better performance." 40 nodes × 8GB × 80% = yeah, we were fucked. The moment traffic spiked and applications needed more memory, fluentd was sitting there like a memory hog, refusing to let go.
Fixed it by changing one line in the fluentd config from buffer_chunk_limit 6400m to buffer_chunk_limit 64m. OOMKills stopped instantly. Took me 3 hours to find a single config line because I assumed it was application code. Understanding node pressure eviction patterns would have saved me 2 hours and 47 minutes of debugging hell.
Step 2: Memory Usage Pattern Analysis
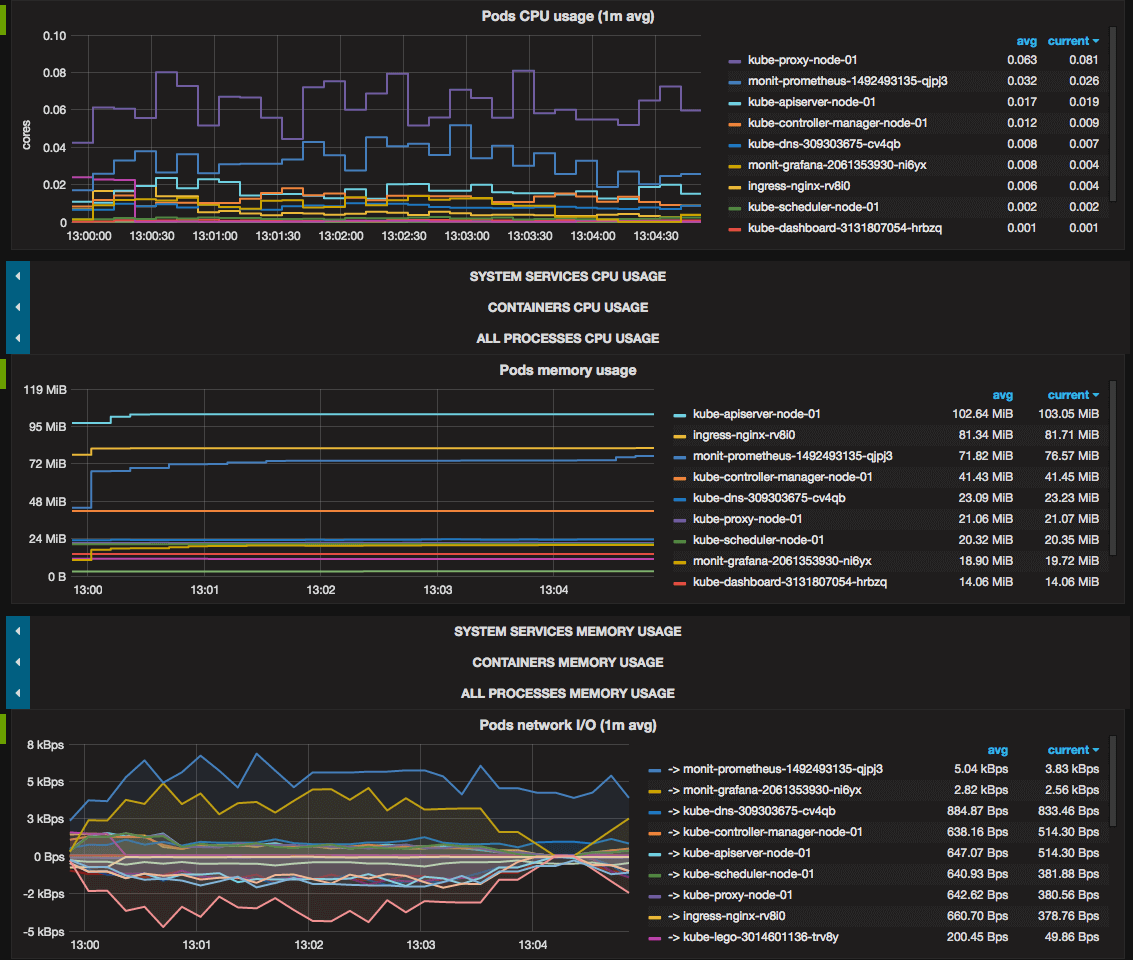
Use advanced resource monitoring to identify memory consumption patterns that lead to OOMKilled events. The Kubernetes metrics server and cAdvisor monitoring provide essential memory usage data.
## Analyze historical memory usage trends (requires metrics-server)
kubectl top pods --sort-by=memory --all-namespaces
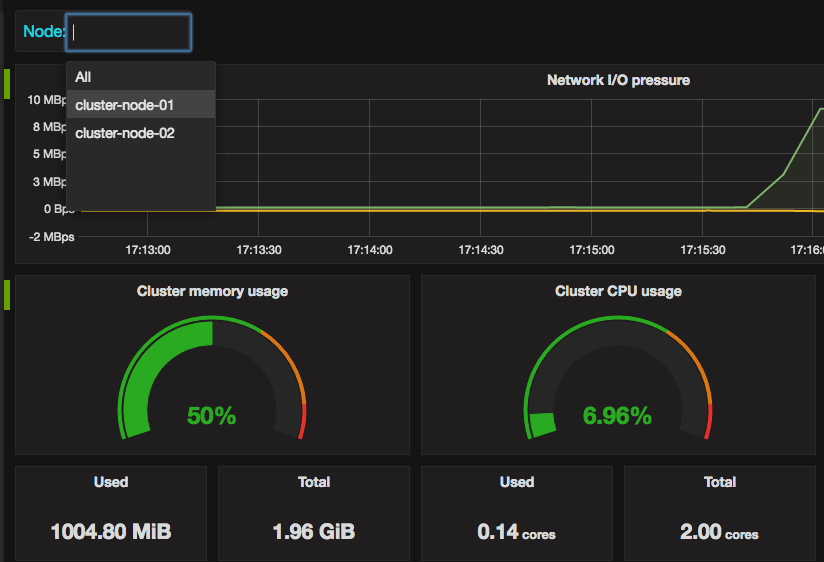
## Check node memory pressure and allocatable resources
kubectl describe nodes | grep -A 5 -B 5 "Allocated resources"
## Monitor memory usage over time (using custom metrics)
kubectl get --raw "/apis/metrics.k8s.io/v1beta1/namespaces/default/pods" \
| jq '.items[] | {name: .metadata.name, memory: .containers[0].usage.memory}'
Production insight: Memory spikes often occur during specific application operations. A payment processing service was OOMKilled only during month-end batch processing because it loaded entire datasets into memory. Regular monitoring missed this pattern because it only checked average usage.
Step 3: Container-Level Memory Forensics
When pods are still running (before OOMKilled), perform detailed memory analysis:
## Analyze memory usage inside the container
kubectl exec -it your-pod -- cat /proc/meminfo
kubectl exec -it your-pod -- free -h

## Check specific process memory consumption
kubectl exec -it your-pod -- ps aux --sort=-%mem | head -10

## For Java applications, analyze heap usage
kubectl exec -it your-pod -- jstat -gc 1 5s

## Check for memory leaks using process memory maps
kubectl exec -it your-pod -- cat /proc/1/smaps | grep -E "(Size|Rss|Pss)"

Advanced technique: Use kubectl debug with ephemeral containers to install memory profiling tools without modifying production images. This approach follows Kubernetes debugging best practices for production environments:
## Add debugging container with memory analysis tools
kubectl debug your-pod -it --image=nicolaka/netshoot --target=your-container

## Inside debug container, install and run memory profiling
apt-get update && apt-get install -y valgrind
valgrind --tool=massif your-application
Production-Specific OOMKilled Scenarios
Scenario 1: JVM Applications and Container Memory Limits
The problem: JVM applications don't respect container memory limits by default and allocate heap based on the entire node's memory. This Java container memory issue is a common cause of OOMKilled errors.
Diagnosis approach:
## Check JVM memory settings vs container limits
kubectl exec -it java-pod -- java -XX:+PrintFlagsFinal -version | grep -E "(MaxHeapSize|UseContainerSupport)"

## Verify container memory limit
kubectl get pod java-pod -o jsonpath='{.spec.containers[0].resources.limits.memory}'

## Check actual JVM heap allocation
kubectl exec -it java-pod -- jcmd 1 VM.info | grep -E "(Initial|Maximum) Heap"
Solution configuration:
apiVersion: v1
kind: Pod
spec:
  containers:
  - name: java-app
    image: openjdk:21  # Updated to Java 21 LTS
    env:
    - name: JAVA_OPTS
      value: "-XX:MaxRAMPercentage=75.0 -XX:+UseG1GC"
      # Note: UseContainerSupport enabled by default in Java 10+
    resources:
      requests:
        memory: "512Mi"
      limits:
        memory: "1Gi"
Real production failure: Spring Boot microservice on Kubernetes 1.28, dying every few hours with OOMKilled. Container limit was 2GB, kubectl top showed only 1.2GB usage. WTF?
Spent three sleepless nights debugging this shit. The JVM was seeing the node's 8GB RAM and thinking "Sweet, I'll take a 4GB heap!" Container cgroup says "Nope, you get 2GB." JVM tries to allocate 4GB anyway, hits the wall, gets murdered by the OOMKiller.
The fix? Two JVM flags: -XX:+UseContainerSupport -XX:MaxRAMPercentage=75.0. But here's the thing - UseContainerSupport is supposed to be enabled by default since Java 10. Turns out this was Java 8 running in a container built two years ago. Nobody ever updated the base image.
Lesson: Always check your actual Java version in the container with kubectl exec pod -- java -version, not what you think it should be based on the Dockerfile. And yes, I learned this at 3 AM on a Tuesday while the payment service was down.
Scenario 2: Memory Leaks in Long-Running Applications
Detection technique: Compare memory usage between pod restarts to identify gradual memory increases:
## Track memory usage over time for leak detection
while true; do
  echo "$(date): $(kubectl top pod leaky-app --no-headers | awk '{print $3}')"
  sleep 300  # Check every 5 minutes
done

## Analyze memory growth patterns
kubectl exec -it leaky-app -- cat /proc/1/status | grep -E "(VmSize|VmRSS|VmData)"
Application-level profiling:
- Python: Use memory-profiler and tracemalloc
- Node.js: Enable
--inspectand use Chrome DevTools memory snapshots - Go: Use go tool pprof for heap analysis
- Java: Use JVisualVM or Eclipse MAT
- General: Valgrind for native applications
Memory leak nightmare: Node.js API serving customer data, dying like clockwork every 48 hours. Memory starts at 200MB, grows to 1GB, then BAM - OOMKilled. Every. Fucking. Time.
Two weeks of this pattern before I got fed up. Took heap snapshots 6 hours apart using Chrome DevTools. What I found was beautiful in its stupidity: thousands of duplicate EventEmitter objects. Our database connection pool was creating event listeners on every connection refresh, but never cleaning them up.
The code looked innocent enough:
connection.on('error', handleError);
connection.on('end', handleEnd);
But every time the pool rotated connections (every 30 minutes), we added new listeners without removing the old ones. 48 hours × 2 connections/minute × 2 listeners = 5,760 event listeners sitting in memory doing nothing.
Fixed it with one line: connection.removeAllListeners() before connection cleanup. Memory usage flatlined at 210MB.
The lesson? Memory leaks in Node.js are almost always event listeners or closures. Don't trust your connection pool library to clean up after itself - check with ps aux --sort=-%mem inside the container and watch for the steady climb.
Scenario 3: Batch Processing and Memory Spikes
Challenge: Applications that process large datasets intermittently can exceed memory limits during peak processing.
Advanced monitoring approach:
## Monitor memory usage during batch processing
kubectl logs -f batch-processor | grep -E "(Processing|Memory|Batch)" &
kubectl top pod batch-processor --watch

## Set up memory usage alerting for spikes
kubectl patch pod batch-processor -p '{"spec":{"containers":[{"name":"processor","resources":{"limits":{"memory":"2Gi"},"requests":{"memory":"1Gi"}}}]}}'
Optimization strategies:
- Streaming processing: Process data in chunks rather than loading entire datasets
- Memory-mapped files: Use mmap for large file processing
- External memory: Store intermediate results in Redis/database instead of memory
- Resource quotas: Set namespace-level limits to prevent resource starvation
Container Runtime and Memory Management
cgroup Memory Accounting
Understanding how container runtimes track memory usage helps debug OOMKilled events. The cgroup memory controller documentation provides deep insight into memory accounting mechanisms.
## Check container memory usage from cgroup perspective
kubectl exec -it your-pod -- cat /sys/fs/cgroup/memory/memory.usage_in_bytes
kubectl exec -it your-pod -- cat /sys/fs/cgroup/memory/memory.limit_in_bytes

## Monitor memory pressure events
kubectl exec -it your-pod -- cat /sys/fs/cgroup/memory/memory.oom_control

## Check if container is approaching limits
kubectl exec -it your-pod -- cat /sys/fs/cgroup/memory/memory.pressure_level
Memory Accounting Differences
Container runtime differences in memory calculation can cause unexpected OOMKilled events. Understanding container runtime architecture helps troubleshoot memory accounting issues:
- containerd: More accurate memory accounting, includes all container processes
- Docker: May miss some memory-mapped files and buffers
- CRI-O: Strict cgroup enforcement, faster OOMKill detection
System memory vs. application memory: The kernel includes various types of memory in OOMKill calculations:
- Resident Set Size (RSS): Physical memory currently used
- Virtual Memory Size (VSS): All memory allocated to the process
- Proportional Set Size (PSS): RSS + shared memory divided by number of processes sharing it
- Buffer/cache memory: File system cache that the kernel can reclaim
Understanding these differences helps explain why your application thinks it's using 500MB but gets OOMKilled with a 512MB limit. For deeper analysis, refer to Linux memory statistics documentation.
Kubernetes 1.31 Memory Management Updates (August 2025): The latest Kubernetes release brought significant changes to memory handling. Enhanced cgroup v2 memory accounting provides more accurate memory tracking, which can affect OOMKilled thresholds and detection timing. The improved memory swap support is now stable, with better "LimitedSwap" configuration options that change how memory pressure events cascade through your cluster. If you're running 1.31+, expect more precise memory pressure detection but potentially different timing for OOMKilled events compared to older versions.
Understanding the diagnostic process is crucial, but diagnosis without solutions is just expensive troubleshooting theater. You've learned to identify what's failing - now comes the critical work of fixing it permanently.
The next section covers strategic memory optimization and solution implementation. These aren't generic "increase your limits" recommendations or theoretical optimizations pulled from academic papers. They're proven techniques that have resolved memory crises in production systems where every minute of downtime directly impacts revenue and user experience.
We'll focus on systemic solutions: JVM configurations that actually respect container boundaries, application-level memory management that prevents leaks before they start, and resource allocation strategies that scale with your actual usage patterns rather than guesswork.