Production Architecture Patterns That Actually Scale

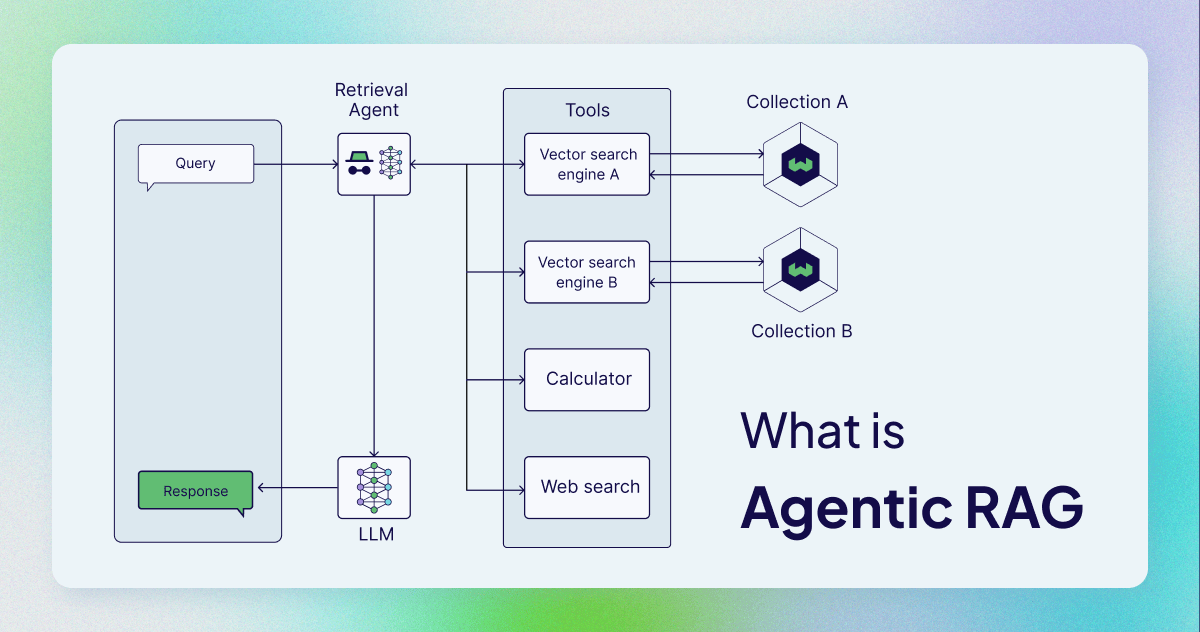
RAG Production Architecture Diagram

I've deployed this shit three times. Two worked okay, one was such a spectacular failure that I learned more debugging it than I did from the successful ones. Here are the patterns that don't completely fuck you over when your CEO asks "why is this so slow?" and your AWS bill is climbing faster than your startup's burn rate.

The "I Don't Want To Think About Infrastructure" Pattern

When to use this: Your traffic is all over the place and you're tired of babysitting servers

This pattern saved my ass during a Series A demo when our traffic spiked 50x overnight because some influencer mentioned us. Lambda scales automatically - 10 queries or 10,000, it just works. Pair it with Pinecone for vectors and whatever serverless database doesn't suck this week (spoiler: they all suck a little).

Pinecone Logo

Architecture Components:

  • Document ingestion: Lambda + S3 triggers
  • Embedding generation: Modal for cost efficiency (way cheaper than OpenAI APIs)
  • Vector storage: Pinecone serverless (starts cheap but scales fast)
  • Retrieval + Generation: Lambda functions with vLLM endpoints

What actually happens: Cold starts will fuck you for the first few hundred milliseconds, but then it's smooth sailing. We went from spending 3 hours every morning scaling pods to just... not caring. Traffic spike during a product launch? Lambda handles it. Late night when everyone's asleep? You're not paying for idle containers.

When it breaks: Lambda times out after 15 minutes, so don't try processing massive PDFs in one go. Found this out when our demo died trying to process some massive PDF during a client meeting. Took us forever to figure out what was happening because Lambda just... stops. No error, nothing useful in the logs. Also, complex retrieval with 1000+ candidates will eat your memory allocation and you'll get cryptic OOM errors that make no sense.

Don't use this if: You need sub-200ms response times, you're processing massive documents, or your queries are consistently complex. Use ECS or Kubernetes instead.

The "We Have a DevOps Person" Pattern

Kubernetes Logo

When to use this: You need predictable performance and have someone who actually knows kubectl

This is the pattern large companies typically use. When you need predictable performance and have someone who actually knows Kubernetes YAML hell, this works. Just make sure that someone isn't you unless you enjoy debugging ingress controllers at 2am while your entire system is down.

Architecture Components:

  • Ingestion pipeline: Airflow on Kubernetes for batch processing (prepare for YAML hell)
  • Embedding service: SentenceTransformers with GPU pods (T4 if you're budget-conscious, A10 if you need speed)
  • Vector database: Self-hosted Weaviate or Qdrant clusters
  • API gateway: Istio with intelligent routing and caching (if you hate yourself)

What actually happens: We got latency under 500ms most of the time, but it took three months of tweaking HPA configs and arguing about resource limits. The GPU bill hurts - T4 instances aren't cheap - but at least your latency doesn't randomly spike when someone decides to batch-process their entire document archive.

Here's the reality: You need someone who lives and breathes kubectl. Expect 2-3 months of absolute misery setting up Istio service mesh, Prometheus monitoring, and cert-manager. But once it's running and you've sacrificed your sanity to the YAML gods, it just fucking works.

Essential tools: Helm charts, ArgoCD, Grafana dashboards, Jaeger tracing. Good luck learning all of these without wanting to throw your laptop out the window.

The "We Have Compliance People" Pattern

When to use this: Enterprise with HIPAA/SOC2 requirements and lawyers who get nervous about cloud data

Enterprise RAG Security

The pattern that passes SOC2 audits combines on-premises document processing with cloud-based inference. Sensitive data never leaves the corporate network while still using cloud AI services for generation.

Architecture Components:

What actually happens: Network latency kills you - over a second average because your data has to hop through three different security layers. But when the HIPAA auditors show up, you sleep well knowing every query is logged and your sensitive docs never left the building.

Compliance tools: Falco runtime security, OPA policy engine, Vault secrets management.

Regulatory Benefits: Data residency compliance, complete audit trails, and air-gapped document processing. Essential for healthcare, finance, and government deployments.

The Anti-Patterns That Kill Systems

❌ The Monolithic API: Single container handling ingestion, retrieval, and generation

Why it fails: I've debugged this nightmare. Document processing slowly eats RAM until your container gets OOMKilled, taking down the entire API. One PDF parser bug crashes everything. Our monolith died on a busy shopping day when someone tried to upload a bunch of corrupted PDFs. Took us 2 hours to figure out it wasn't traffic - it was one bad document killing the whole damn thing.

Debugging tools: memory profiling with py-spy, container monitoring.

❌ The Everything-Custom Approach: Building vector databases and embedding models from scratch

Why it fails: "How hard can it be to build a vector database?" - famous last words. Spent 8 months building something that Pinecone or Weaviate does better out of the box. Don't reinvent the wheel unless you've got Spotify-level engineering talent.

❌ The Single-Framework Lock-in: Betting everything on one RAG framework

Why it fails: LangChain broke our production pipeline when they deprecated the entire chains API between 0.2 and 0.3. Spent two weeks rewriting everything because they decided to "improve" it. Had a production system serving 10K queries daily that just died overnight. LangChain's constant updates mean something breaks every month.

Choosing Your Architecture Pattern

Use Serverless if:

  • Monthly query volume < 100K
  • Cost optimization is the primary concern
  • Your team lacks dedicated infrastructure expertise
  • Traffic patterns are highly variable

Use Kubernetes if:

  • Latency requirements < 500ms p95
  • Monthly query volume > 500K
  • You have dedicated DevOps resources
  • Performance predictability matters more than cost

Use Hybrid Cloud if:

  • Regulatory compliance requirements
  • Sensitive document processing
  • Existing on-premises infrastructure investment
  • Air-gapped deployment requirements

The fundamental principle: start simple and add complexity only when simple stops working. Most RAG projects fail because teams try to build the perfect system instead of shipping something that works. Start simple with LangChain or LlamaIndex, get it working, then optimize. Premature optimization is the root of all evil - and bankrupted budgets.

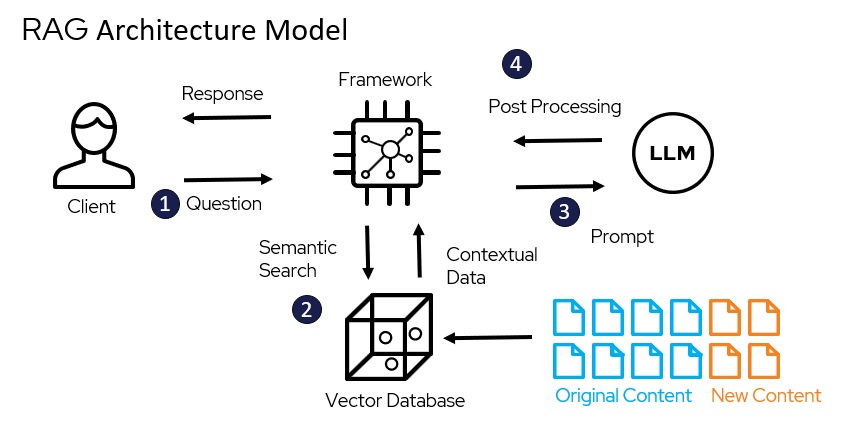
Scaling Patterns and Performance Optimization

Scaling RAG Systems

Here's the thing nobody tells you: your RAG system that runs perfectly on your laptop will shit the bed the moment real users touch it. I've seen systems handle 100 queries just fine, then completely fall apart at 1,000. Here's what I've learned from scaling systems that actually stayed up past the first week.

Stop Waiting Like an Idiot: Caching That Actually Works

Semantic caching cuts your bill in half by storing responses for similar questions, not just identical ones. So when someone asks "what's the refund policy" and later "how do I return something", it's smart enough to know they're basically the same question.

Implementation Strategy:

  • Query-level caching: Store LLM responses for identical queries (30-40% hit rate)
  • Embedding caching: Cache document vectors to avoid re-computation (60-80% savings)
  • Result caching: Store top-K retrieval results for popular documents (45-55% hit rate)

We implemented Redis caching and went from like 3+ second responses (users were bitching constantly) to something closer to 500ms most of the time. Cut our OpenAI bill from I think $800 to maybe $300 because we stopped regenerating the same answers constantly.

Caching options: Redis for vector similarity, Memcached for simple stuff, DragonflyDB if you need high performance and don't mind learning another tool.

Cache Invalidation Strategy:

Use document version hashing and time-based expiration. Legal documents get 24-hour cache TTL, while news content expires after 2 hours. Content-based cache keys prevent stale responses when documents update.

Parallel Processing: Stop Waiting Like an Idiot

Sequential processing kills performance. The default RAG pipeline - embed query, retrieve documents, rerank, generate - creates unnecessary latency bottlenecks.

Parallel Architecture Pattern:

User Query →
├─ Query Embedding (150ms)
├─ Document Retrieval (200ms) ←─ Both run simultaneously  
└─ Intent Classification (100ms)
     ↓
Combined Results → Reranking (300ms) → Generation (1200ms)

vs Sequential Pipeline:

Query → Embed (150ms) → Retrieve (200ms) → Rerank (300ms) → Generate (1200ms) = 1850ms total

Implementation with FastAPI and async/await:

async def parallel_rag_pipeline(query: str):
    # Start all operations simultaneously - this took me forever to debug the first time
    embed_task = asyncio.create_task(embed_query(query))
    retrieval_task = asyncio.create_task(retrieve_candidates(query))
    intent_task = asyncio.create_task(classify_intent(query))

    # Wait for all to complete - sometimes one of these fails and kills everything
    embedding, candidates, intent = await asyncio.gather(
        embed_task, retrieval_task, intent_task
    )

    # Continue with dependent operations
    reranked = await rerank_results(candidates, embedding)
    response = await generate_answer(reranked, intent)
    return response

We dropped latency from over 2 seconds (completely unacceptable) to usually under a second by running shit in parallel instead of waiting around like idiots.

Parallelization tools: asyncio docs, FastAPI async patterns, aiohttp for async HTTP. Warning: async debugging is a nightmare when things break.

Intelligent Load Balancing: Beyond Round-Robin

Query complexity varies dramatically. Simple factual queries complete in 300ms while complex multi-hop reasoning takes 5+ seconds. Standard load balancing fails because it doesn't account for computational complexity.

Complexity-Aware Routing:

  • Fast lane: Simple queries (< 50 words, factual intent) → optimized endpoints with smaller models
  • Standard lane: Regular queries → default processing pipeline
  • Heavy lane: Complex queries (> 200 words, multi-step reasoning) → dedicated high-memory pods

Implementation with Kong API Gateway:

routes:
  - name: fast-lane
    paths: ["/rag/simple"]
    service: 
      name: rag-optimized
      targets: ["pod-small-1", "pod-small-2"]
  
  - name: heavy-lane  
    paths: ["/rag/complex"]
    service:
      name: rag-intensive
      targets: ["pod-large-1", "pod-large-2"]

We set up query routing because our customer service queries were killing the simple product lookups. Simple "what's the price of X" questions got routed to lightweight Llama-7B instances, while "I need a refund because my order was damaged and shipped to the wrong address" went to the heavy artillery.

Load balancing options: Kong API Gateway, Nginx ingress, Envoy proxy, Traefik. Pick one and stick with it - they all do the job.

Memory Management: Preventing the Silent Killer

Memory leaks destroy RAG systems slowly, causing gradual performance degradation that's often attributed to "increased load." Document processing and embedding generation are particularly memory-intensive.

Common Memory Leak Sources:

  • Unclosed database connections during vector operations
  • Retained document chunks in memory after processing
  • Embedding model caches that grow unbounded
  • Tokenizer instances that accumulate with each request

Memory Optimization Strategies:

  1. Connection pooling: Use SQLAlchemy connection pools with strict limits
  2. Explicit cleanup: Clear document chunks after embedding generation
  3. Process recycling: Restart workers after processing N documents
  4. Memory monitoring: Alert when memory usage exceeds 80% of container limits

Our workers started at 2GB and somehow crept up to 8GB after processing maybe 50,000 documents over two weeks. Python's garbage collector is apparently not magic. Had to add explicit cleanup everywhere or we'd OOM every few hours and wonder why everything was slow as hell.

Memory debugging tools: memory_profiler, tracemalloc, pympler, Celery monitoring. Good luck making sense of the output.

@celery.task
def process_document_batch(document_ids):
    try:
        chunks = []
        for doc_id in document_ids:
            doc = load_document(doc_id)
            doc_chunks = chunk_document(doc)
            chunks.extend(doc_chunks)

            # Explicit cleanup - Python's GC is not magic
            del doc
            del doc_chunks
            gc.collect()  # This feels dirty but prevents OOM

        embeddings = generate_embeddings(chunks)
        store_embeddings(embeddings)

    finally:
        # Guaranteed cleanup - learned this the hard way
        del chunks
        del embeddings
        gc.collect()  # Yes, calling this everywhere looks stupid but it works

Horizontal Scaling: When Vertical Hits the Wall

Figure out if your shit is CPU-bound or memory-bound first. Scale wrong and you'll waste stupid money scaling the wrong things.

Horizontally Scalable Components:

  • Document embedding generation (CPU/GPU bound)
  • Query processing and intent classification
  • Response generation with smaller models

Vertically Scalable Components:

  • Vector database query processing (memory + I/O bound)
  • Large model inference (GPU memory bound)
  • Document parsing and chunking (memory bound for large files)

Hybrid Scaling Architecture:

┌─ Embedding Service ────┐    ┌─ Vector DB ────────┐
│  └─ Pod 1 (2 CPU)      │    │  └─ Large Instance  │
│  └─ Pod 2 (2 CPU)      │────│     (32GB RAM)     │
│  └─ Pod 3 (2 CPU)      │    │                    │
└────────────────────────┘    └────────────────────┘
         ↓                              ↓
┌─ Generation Service ───┐    ┌─ API Gateway ──────┐
│  └─ GPU Pod (A10)      │    │  └─ Load Balancer  │
│  └─ GPU Pod (A10)      │────│     (Kong/Nginx)   │
└────────────────────────┘    └────────────────────┘

The Performance Monitoring Stack That Actually Works

Set up monitoring or enjoy getting paged at 3am when everything's on fire. Here's what actually predicts failures before users start bitching:

Critical Metrics:

  • Query latency percentiles: p50, p95, p99 response times
  • Cache hit rates: Semantic cache effectiveness
  • Memory usage trends: Early warning for memory leaks
  • Error rates by query complexity: Indicates capacity limits
  • Cost per query: Tracks infrastructure efficiency

Monitoring Stack:

  • Prometheus: Metrics collection and alerting
  • Grafana: Dashboards and visualization
  • OpenTelemetry: Distributed tracing across services
  • Custom metrics: Domain-specific performance indicators

Alert Thresholds Based on Production Data:

  • p95 latency > 2 seconds: Immediate investigation
  • Cache hit rate < 40%: Cache strategy review needed
  • Memory usage > 80%: Scale up or optimize
  • Error rate > 1%: System degradation likely

Our Prometheus alerts saved our ass three times by catching memory growth before we hit container limits. The alternative was getting paged at 3 AM when everything crashed.

Monitoring Architecture

Monitoring stack: Grafana dashboards, AlertManager, PagerDuty integration, Datadog APM.

Cost Optimization Without Performance Loss

Infrastructure costs compound quickly. A typical enterprise RAG system costs tens of thousands monthly without optimization. These strategies cut costs significantly while maintaining performance:

Compute Optimization:

  • Spot instances: Use AWS Spot or GCP Preemptible for batch processing (way cheaper)
  • Auto-scaling: Scale down during off-hours (significant savings)
  • Reserved capacity: Commit to base load with Reserved Instances (big discount)

Model Optimization:

  • Smaller embedding models: BGE-small vs BGE-large (much cheaper, slight accuracy trade-off)
  • Quantized models: 4-bit quantization reduces memory by a lot
  • Model caching: Self-host popular models vs API calls

Storage Optimization:

  • Tiered storage: Hot/warm/cold document storage based on access patterns
  • Compression: Product quantization reduces storage costs significantly
  • Cleanup policies: Automatic deletion of old embeddings and cache entries with TTL

The most successful deployments treat performance optimization as an ongoing process, not a one-time effort. Weekly performance reviews and monthly cost optimization audits keep systems running efficiently as usage patterns evolve.

Production Monitoring and Cost Management

RAG Cost Monitoring

Here's what nobody tells you about RAG costs: they can go from "this is fine" to "holy shit we're bankrupt" in about two weeks if you're not paying attention. I've seen AWS bills explode because someone left auto-scaling on during a weekend load test and nobody noticed until Monday. Here's how to avoid that panicked phone call from your CTO.

The Essential Monitoring Framework

Most teams obsess over CPU graphs while their users are getting shitty answers. Here's what you actually need to watch across the four things that matter: whether users are happy, whether your system is dying, whether you're going bankrupt, and whether your AI is hallucinating bullshit.

User Experience Metrics:

  • Task completion rate: Percentage of queries that produce usable answers (target: >85%)
  • Time to answer: End-to-end latency from query to response (target: <3 seconds)
  • User satisfaction scores: Explicit feedback and implicit engagement signals
  • Query abandonment rate: Users giving up during processing (target: <5%)

System Performance Metrics:

  • Service availability: Uptime across all RAG pipeline components (target: >99.5%)
  • Error rates by component: Ingestion, retrieval, generation failure rates
  • Resource utilization: CPU, memory, GPU usage patterns
  • Throughput capacity: Queries processed per minute during peak load

Cost Efficiency Metrics:

  • Cost per query: Total infrastructure spend divided by query volume
  • Resource waste: Over-provisioned capacity during low-traffic periods
  • API consumption: LLM and embedding API usage and billing
  • Storage growth: Vector database and document storage expansion rates

Data Quality Metrics:

  • Retrieval relevance: Accuracy of document retrieval for user queries
  • Answer hallucination rate: Percentage of responses not supported by retrieved context
  • Citation accuracy: Correctness of source attributions in generated responses
  • Content freshness: Age of documents returned in search results

Real-Time Alerting That Prevents Outages

Alert fatigue kills monitoring effectiveness. The key is building alerting systems that distinguish between normal variance and actual problems requiring immediate attention.

Critical Alerts (Page immediately):

  • p95 latency exceeds 5 seconds for 5+ minutes straight (users will start complaining)
  • Error rate exceeds 3% for any minute (in production, this means something is dying)
  • Any service availability below 95% for more than 2 minutes (usually means cascading failures)
  • Memory usage exceeds 85% on production instances (don't wait for OOMKilled)
  • Cost per query jumps by 40%+ compared to last week (usually means inefficient scaling)

Warning Alerts (Investigate during business hours):

  • Cache hit rate drops below 35% for 20+ minutes (cache warming issues or traffic pattern change)
  • Document ingestion fails 3+ times in a row (usually PDF parsing errors or S3 permissions)
  • GPU utilization stays under 30% for an hour (you're burning $2/hour for nothing)
  • Storage usage increases 20%+ week-over-week without obvious reason (memory leaks or failed cleanup jobs)

Prometheus Alert Rules for RAG Systems:

groups:
- name: rag-production
  rules:
  - alert: RAG_HighLatency
    expr: histogram_quantile(0.95, rag_query_duration_seconds) > 5
    for: 5m  # Don't alert on brief spikes - gives false positives
    annotations:
      summary: "RAG p95 latency too high"
      description: "95th percentile query latency is {{ $value }} seconds"

  - alert: RAG_HighErrorRate
    expr: rate(rag_query_errors_total[1m]) > 0.05
    for: 1m  # This will fire during deployments - that's normal
    annotations:
      summary: "RAG error rate too high"
      description: "Error rate is {{ $value | humanizePercentage }}"

  - alert: RAG_CostSpike
    expr: increase(rag_cost_per_query[7d]) > 0.5
    for: 10m  # Costs fluctuate - don't panic on short spikes
    annotations:
      summary: "RAG cost per query increased significantly"

Cost Management: How We Cut Our Bill in Half

Cost optimization isn't about reducing quality - it's about eliminating waste while maintaining performance. The most effective cost reduction strategies target the highest-impact areas first.

Infrastructure Cost Breakdown (Typical Enterprise RAG):

  • LLM API calls: Usually half or more of your total spend - these eat your budget alive
  • Vector database hosting: Around 15-25% depending on scale
  • Embedding generation: Maybe 10-20% if you're using APIs heavily
  • Compute infrastructure: Varies wildly based on your architecture choice
  • Storage and networking: The "death by a thousand cuts" costs that add up

High-Impact Cost Optimizations:

1. LLM Cost Reduction (40-70% savings):

  • Response caching: Store answers for frequently asked questions
  • Model routing: Use smaller models for simple queries, large models for complex reasoning
  • Prompt optimization: Reduce token usage through better prompt engineering
  • Self-hosting: Deploy open-source models for high-volume, routine queries

War story: We were burning $12K monthly on GPT-4 API calls for basic fact lookups like "what's our shipping policy" that could've been handled by Llama-7B. Added semantic caching and self-hosted a smaller model for these brain-dead queries. Bill dropped to $4K. CFO actually smiled for once. Used vLLM for self-hosting - works great but debugging GPU memory issues at 2am sucks ass.

2. Vector Database Optimization (50-80% savings):

  • Compression techniques: Product quantization reduces storage significantly with minimal accuracy loss
  • Tiered storage: Move rarely accessed vectors to cheaper storage tiers
  • Index optimization: Tune HNSW parameters for your specific recall/cost trade-offs
  • Alternative architectures: pgvector on PostgreSQL can be much cheaper than managed solutions

3. Compute Resource Optimization:

  • Auto-scaling policies: Scale down during off-hours (nights typically see way less traffic)
  • Spot instances: Use for batch processing workloads (much cheaper)
  • GPU sharing: Multiple smaller models on one GPU instance rather than dedicated GPUs
  • Cold start optimization: Minimize serverless cold start penalties

Advanced Observability: What Production Teams Actually Monitor

Beyond basic metrics, mature RAG deployments track sophisticated observability indicators that predict problems before they impact users.

Semantic Quality Monitoring:

RAGAS framework provides automated evaluation of RAG system outputs:

  • Context relevance: How well retrieved documents match the query intent
  • Answer faithfulness: Whether the generated response is supported by retrieved context
  • Answer relevance: How well the response addresses the original question

Implementation with RAGAS:

from ragas import evaluate
from datasets import Dataset

def monitor_rag_quality(queries, responses, contexts):
    dataset = Dataset.from_dict({
        "question": queries,
        "answer": responses,
        "contexts": contexts
    })

    # This will take forever with large datasets - RAGAS evaluates every single query with an LLM call
    results = evaluate(dataset, metrics=[
        context_relevance,
        faithfulness,
        answer_relevance
    ])

    # Thresholds based on what actually matters in prod
    if results['context_relevance'] < 0.7:
        send_alert("Context relevance degraded")  # Users getting irrelevant docs
    if results['faithfulness'] < 0.8:
        send_alert("Answer faithfulness degraded")  # LLM making shit up

    return results

Performance Regression Detection:

Track query performance over time to catch gradual degradation:

def detect_performance_regression():
    current_week = get_latency_percentiles(days=7)
    previous_week = get_latency_percentiles(days=14, offset=7)
    
    regression_threshold = 1.2  # 20% increase
    
    if current_week['p95'] > previous_week['p95'] * regression_threshold:
        alert_team("Performance regression detected")
        trigger_investigation()

Security and Compliance Monitoring

Enterprise RAG systems process sensitive information and need monitoring that protects data and meets regulatory compliance.

Data Privacy Monitoring:

  • PII detection: Scan queries and responses for personally identifiable information
  • Access pattern analysis: Identify unusual data access that might indicate security breaches
  • Document classification: Tag sensitive documents properly and control access to them
  • Audit trail completeness: Verify all user interactions are logged for compliance

Compliance Automation:

def check_compliance_violations():
    recent_queries = get_queries(hours=24)
    
    for query in recent_queries:
        # Check for PII in queries
        if detect_pii(query.text):
            redact_pii(query)
            log_privacy_event(query.user_id)
        
        # Verify user has access to returned documents
        for doc in query.retrieved_docs:
            if not user_has_access(query.user_id, doc.classification):
                security_alert(f"Unauthorized access attempt: {query.id}")
                
        # Check document retention policies
        if doc.age > retention_policy[doc.type]:
            schedule_deletion(doc.id)

Production Incident Management

When RAG systems fail, they fail in unique ways that traditional web service incident management doesn't cover. Successful teams develop RAG-specific runbooks and incident response procedures.

Common RAG Failure Modes:

  1. Silent quality degradation: System appears healthy but answer quality drops
  2. Embedding drift: Model updates cause relevance score inflation/deflation
  3. Context overflow: Long documents cause token limit exceeded errors
  4. Memory leaks: Gradual performance degradation over hours/days
  5. Cache staleness: Outdated answers persist despite document updates

RAG-Specific Incident Runbook:

Step 1: Triage (5 minutes)

  • Check system availability and error rates
  • Verify LLM API connectivity and quotas
  • Examine recent deployments or configuration changes
  • Review cost spending for unexpected spikes

Step 2: Identify Impact Scope (10 minutes)

  • Determine affected user segments or query types
  • Check data quality metrics for recent degradation
  • Verify document ingestion pipeline status
  • Assess security breach indicators

Step 3: Immediate Mitigation (15 minutes)

  • Implement circuit breakers to prevent cascade failures
  • Route traffic to backup systems or cached responses
  • Scale up resources if capacity-related
  • Pause document ingestion if quality issues detected

Step 4: Root Cause Analysis

  • Analyze query patterns leading to failure
  • Review embedding model performance metrics
  • Check vector database query performance
  • Examine document processing pipeline logs

What Actually Keeps Systems Running

The unglamorous shit that prevents 3am pages: Most RAG failures happen because nobody's watching the obvious stuff.

Check this shit daily or regret it:

  • Did the overnight batch jobs actually finish?
  • Is the cost trending upward for no obvious reason?
  • Are error rates creeping up gradually?
  • Is memory usage slowly climbing again? (Memory leaks will fuck you every time)

Weekly reality check:

  • Run some actual queries and see if they're still good
  • Look at the cost breakdown and cry a little
  • Update your monitoring when new things break in interesting ways
  • Plan for next week's inevitable fire drill

Monthly "oh shit" prevention:

  • Actually test your backups (they're probably broken)
  • Check if your embedding model is still decent or if something better exists
  • Negotiate with vendors before they auto-renew at higher rates
  • Run disaster recovery tests because Murphy's Law is real

The teams that don't completely implode treat this operational stuff seriously. They build monitoring that actually helps instead of just pretty dashboards that nobody looks at.

What Each Pattern Actually Costs and When It Breaks

Pattern

When it works

When it doesn't

Framework reality check

Serverless

You're doing under 100K queries monthly and don't want to think about infrastructure. Costs maybe $500-3,000/month if you're not being stupid about it.

Latency is all over the place (800ms on a good day, 2+ seconds when Lambda is having a bad time). Cold starts will piss off your users. Complex queries timeout and you can't do anything about it.

LangChain is a pain in the ass to deploy serverless

  • the dependency tree is 300MB+ and Lambda throws ImportError: cannot import name 'ChatOpenAI' at random times. LlamaIndex works better but still has quirks. Most people end up writing custom code anyway because the frameworks fight with serverless.

Kubernetes

You're doing serious volume (500K+ queries monthly) and have someone who doesn't hate kubectl. Performance is predictable

  • usually 300-600ms p95 if you set it up right.

Setup takes forever (plan for 2-3 months of fighting with YAML). Monthly costs are $3K-$15K depending on how badly you configure GPU instances. Operational overhead is huge

  • expect one person full-time just keeping it running.

Haystack was built for this. LangChain works but you'll fight with it constantly. LlamaIndex is okay but limited. Most large deployments end up with custom solutions that actually fit their needs instead of forcing frameworks to do things they hate.

Hybrid Cloud

Enterprise with HIPAA/SOC2 requirements. Data stays on-premises, generation happens in the cloud. Auditors are happy.

Network latency murders your performance (1-2 seconds minimum because data hops through 3 VPN tunnels). Costs are $8K-$25K monthly because enterprise anything is expensive. Setup complexity is insane

  • expect 6 months just for security reviews.

Haystack handles this well. LangChain can work if you configure it right. LlamaIndex has limited hybrid support. Most enterprises build custom solutions because compliance requirements are weird.

Production Deployment FAQ

Q

How do I estimate infrastructure costs before deploying?

A

Use this cost calculator approach: Start with expected query volume, multiply by typical resource consumption, add 40% buffer for scaling headroom.

Q

What's the minimum viable monitoring for production RAG?

A

Essential monitoring stack (can be implemented in 2-3 days if you're not fighting with config files):

  • Application metrics: Query latency, error rates, throughput (Prometheus + Grafana)
  • Cost tracking: Daily spend alerts when >20% over budget (use AWS Cost Explorer or whatever doesn't suck)
  • Quality monitoring: Weekly RAGAS evaluation on sample queries
  • Uptime monitoring: Simple health checks every 30 seconds (don't overthink this shit)

Skip complex observability initially. Add advanced monitoring after establishing basic reliability.

Q

How do I handle document updates without breaking retrieval?

A

Implement versioned indexing: Keep old embeddings while generating new ones, then atomic swap after validation.

Production pattern:

  1. Generate embeddings for updated documents in parallel index
  2. Run quality tests comparing old vs new retrieval results
  3. Gradually shift traffic to new index (10% → 50% → 100%)
  4. Remove old embeddings after 24-48 hours

This prevents the "retrieval cliff" where document updates suddenly break existing query patterns.

Q

Why is my RAG system slow as hell after running fine for weeks?

A

Memory leaks will fuck you every time. Your document parser is probably hoarding RAM like a digital hoarder. I spent a weekend debugging this once - memory usage slowly climbing from 2GB to 16GB over two weeks processing PDFs from our legal team (those fuckers love 200-page contracts).

How to catch it before it kills you:

  • docker stats every few hours to watch memory trends
  • Set up Grafana alerts for memory usage >80%
  • Check if latency correlates with container uptime (usually does)
  • Use memory_profiler to find the leak (good luck understanding the output)

Nuclear option: Restart everything and add --memory=4g limits to your containers. Fix the leak later when you're not on fire.

Q

How do I prevent RAG costs from spiraling out of control?

A

Implement cost guardrails from day one:

  • Set monthly budget alerts at 50%, 80%, and 100% of expected spend
  • Monitor cost-per-query trends and alert on 25% increases
  • Implement query quotas per user/team to prevent abuse
  • Use semantic caching aggressively (typically 40-70% cost reduction)

Oh shit the bill hit $8K this month, fix it now: Turn on aggressive caching with Redis (30-second TTL for everything), route "what is X" queries to Llama-7B instead of GPT-4, and add rate limiting (100 queries/user/hour) before the CFO murders you. This should cut costs 60-70%.

Q

Which vector database should I use for production?

A

Depends on your constraints:

  • Budget-conscious: pgvector on managed PostgreSQL (way cheaper than dedicated vector DBs)
  • Performance-critical: Pinecone or Qdrant for sub-100ms retrieval
  • On-premises required: Self-hosted Weaviate or Qdrant
  • Hybrid needs: Combine pgvector for bulk storage with Pinecone for hot queries

Start with Pinecone or Qdrant Cloud and optimize when the bill actually hurts. Don't spend three months building a vector database when you could be shipping features that users actually want.

Q

How do I handle traffic spikes without breaking the bank?

A

Multi-tier caching strategy:

  • L1: In-memory cache for identical queries (Redis/Memcached)
  • L2: Semantic cache for similar queries (vector similarity matching)
  • L3: Precomputed answers for FAQ-style content

Auto-scaling configuration: Scale on queue depth, not just CPU. RAG systems are often I/O bound, so CPU metrics mislead scaling decisions.

Q

What's the fastest way to improve answer quality in production?

A

Hybrid search delivers the biggest immediate improvement (typically 25-40% better relevance):

  • Combine dense vector search with BM25 keyword search
  • Use cross-encoder reranking on top-20 results
  • Implement query expansion for technical terminology

This can be added to existing systems without major architecture changes.

Q

How do I debug why answers are wrong or irrelevant?

A

Systematic debugging approach:

  1. Check retrieval quality: Are the right documents being found?
  2. Examine context length: Is critical information being truncated?
  3. Verify prompt engineering: Is the LLM getting clear instructions?
  4. Test embedding quality: Do similar documents cluster together?

Production debugging tools: Log complete retrieval context (yes, all of it), implement answer rating workflows (thumbs up/down buttons), use RAGAS automated evaluation. Most of the time the problem is obvious once you see what documents were actually retrieved - usually it's retrieving the wrong shit entirely.

Q

Should I fine-tune embeddings for my domain?

A

Only if you have >10,000 high-quality query-document pairs and generic embeddings perform poorly (<0.6 retrieval accuracy).

Simpler alternatives that often work better:

  • Use domain-specific embedding models (legal, medical, technical)
  • Implement better chunking strategies for your document types
  • Add metadata filtering to improve precision
  • Use hybrid search with domain-specific keyword expansion

Fine-tuning is high-effort, high-risk. Exhaust other options first.

Q

How do I maintain GDPR/HIPAA compliance in production RAG?

A

Data flow controls are essential:

  • Input sanitization: Remove PII from queries before processing
  • Access logging: Record all document retrievals with user attribution
  • Right to deletion: Implement processes to remove specific user data
  • Data residency: Keep vector embeddings in appropriate geographic regions

Compliance architecture: Use on-premises document processing with cloud-only generation, or hybrid cloud patterns that keep sensitive data local.

Q

What happens when OpenAI/Anthropic APIs go down?

A

Implement fallback strategies or watch your system die:

  • Model redundancy: Support multiple LLM providers with automatic failover
  • Cached responses: Serve previous answers for identical queries
  • Degraded mode: Return retrieved documents without generation
  • Circuit breakers: Prevent cascade failures when external APIs are unavailable

Production requirement: No single point of failure for critical user journeys.

Related Tools & Recommendations

compare
Recommended

Milvus vs Weaviate vs Pinecone vs Qdrant vs Chroma: What Actually Works in Production

I've deployed all five. Here's what breaks at 2AM.

Milvus
/compare/milvus/weaviate/pinecone/qdrant/chroma/production-performance-reality
100%
compare
Recommended

LangChain vs LlamaIndex vs Haystack vs AutoGen - Which One Won't Ruin Your Weekend

By someone who's actually debugged these frameworks at 3am

LangChain
/compare/langchain/llamaindex/haystack/autogen/ai-agent-framework-comparison
80%
integration
Recommended

Pinecone Production Reality: What I Learned After $3200 in Surprise Bills

Six months of debugging RAG systems in production so you don't have to make the same expensive mistakes I did

Vector Database Systems
/integration/vector-database-langchain-pinecone-production-architecture/pinecone-production-deployment
73%
integration
Recommended

LangChain + Hugging Face Production Deployment Architecture

Deploy LangChain + Hugging Face without your infrastructure spontaneously combusting

LangChain
/integration/langchain-huggingface-production-deployment/production-deployment-architecture
55%
compare
Recommended

Python vs JavaScript vs Go vs Rust - Production Reality Check

What Actually Happens When You Ship Code With These Languages

python
/compare/python-javascript-go-rust/production-reality-check
53%
tool
Recommended

LangChain - Python Library for Building AI Apps

competes with LangChain

LangChain
/tool/langchain/overview
44%
tool
Recommended

LlamaIndex - Document Q&A That Doesn't Suck

Build search over your docs without the usual embedding hell

LlamaIndex
/tool/llamaindex/overview
43%
howto
Recommended

I Migrated Our RAG System from LangChain to LlamaIndex

Here's What Actually Worked (And What Completely Broke)

LangChain
/howto/migrate-langchain-to-llamaindex/complete-migration-guide
43%
news
Recommended

ChatGPT Just Got Write Access - Here's Why That's Terrifying

OpenAI gave ChatGPT the ability to mess with your systems through MCP - good luck not nuking production

The Times of India Technology
/news/2025-09-12/openai-mcp-developer-mode
43%
tool
Recommended

GPT-5 Migration Guide - OpenAI Fucked Up My Weekend

OpenAI dropped GPT-5 on August 7th and broke everyone's weekend plans. Here's what actually happened vs the marketing BS.

OpenAI API
/tool/openai-api/gpt-5-migration-guide
43%
review
Recommended

I've Been Testing Enterprise AI Platforms in Production - Here's What Actually Works

Real-world experience with AWS Bedrock, Azure OpenAI, Google Vertex AI, and Claude API after way too much time debugging this stuff

OpenAI API Enterprise
/review/openai-api-alternatives-enterprise-comparison/enterprise-evaluation
43%
tool
Recommended

Python 3.12 for New Projects: Skip the Migration Hell

built on Python 3.12

Python 3.12
/tool/python-3.12/greenfield-development-guide
38%
tool
Recommended

Python 3.13 Broke Your Code? Here's How to Fix It

The Real Upgrade Guide When Everything Goes to Hell

Python 3.13
/tool/python-3.13/troubleshooting-common-issues
38%
troubleshoot
Recommended

Pinecone Keeps Crashing? Here's How to Fix It

I've wasted weeks debugging this crap so you don't have to

pinecone
/troubleshoot/pinecone/api-connection-reliability-fixes
32%
tool
Recommended

Pinecone - Vector Database That Doesn't Make You Manage Servers

A managed vector database for similarity search without the operational bullshit

Pinecone
/tool/pinecone/overview
32%
tool
Recommended

ChromaDB Troubleshooting: When Things Break

Real fixes for the errors that make you question your career choices

ChromaDB
/tool/chromadb/fixing-chromadb-errors
32%
integration
Recommended

OpenAI API + LangChain + ChromaDB RAG Integration - Production Reality Check

Building RAG Systems That Don't Immediately Catch Fire in Production

OpenAI API
/integration/openai-langchain-chromadb-rag/production-rag-architecture
32%
howto
Recommended

Deploy Weaviate in Production Without Everything Catching Fire

So you've got Weaviate running in dev and now management wants it in production

Weaviate
/howto/weaviate-production-deployment-scaling/production-deployment-scaling
32%
tool
Recommended

Weaviate - The Vector Database That Doesn't Suck

integrates with Weaviate

Weaviate
/tool/weaviate/overview
32%
tool
Recommended

Haystack Editor - Code Editor on a Big Whiteboard

Puts your code on a canvas instead of hiding it in file trees

Haystack Editor
/tool/haystack-editor/overview
31%

Recommendations combine user behavior, content similarity, research intelligence, and SEO optimization