What Actually Breaks When You Deploy Weaviate in Production

Here's what the docs don't tell you about production deployments. We've deployed Weaviate clusters that handle billions of vectors, and I'm going to tell you exactly where shit goes sideways. Skip this section if you enjoy debugging mysterious memory leaks at 3am.

Memory Planning - Where Everyone Gets It Wrong

Look, I've watched teams blow their entire AWS budget because they trusted the memory planning docs. That (objects × dimensions × 4 bytes) + overhead formula works great in their lab environment, but here's what actually happens in production.

The Memory Formula is a Lie:
The formula assumes single-tenant, write-once workloads. Add multi-tenancy and suddenly you need 2x more memory. Add frequent updates and you're looking at 3x. I learned this after our staging cluster that handled 1M vectors fine completely shit itself when we hit production traffic. The resource requirements documentation glosses over these real-world multipliers.

What Actually Happens:

  • 1M vectors = 3GB RAM in theory, 6GB+ in practice
  • HNSW index rebuilding doubles memory usage temporarily
  • Garbage collection pauses will make your queries timeout
  • Memory fragmentation means you can't use all allocated RAM
  • Multi-tenancy overhead adds 50-100% memory usage per tenant

Kubernetes "High Availability" is a Joke:
3 nodes sounds good until one dies during a memory spike and suddenly your "highly available" cluster has all pods running on the same overloaded node. You need 5+ nodes and proper pod anti-affinity or your HA cluster becomes a single point of failure faster than a JavaScript framework falls out of fashion. The cluster architecture docs conveniently forget to mention this.

HNSW Index Structure: This fancy algorithm builds a bunch of graph layers. Higher layers let you jump around fast globally, lower layers let you find the exact shit you're looking for. It's clever but eats memory like crazy.

AWS Storage Bills Will Make Your CFO Cry:
Use SSDs, obviously. The docs push provisioned IOPS like they're getting kickbacks from AWS. Our first production bill hit $4,800 in IOPS charges because our write pattern was dogshit and the deployment guide somehow forgot to mention that burst credits run out faster than your patience during a failed deployment. Start with EBS gp3 - it's fine until you actually hit a bottleneck. Don't upgrade to io2 just because some AWS solutions architect convinced you it's "enterprise grade." Check AWS storage optimization and Kubernetes persistent volume guides before AWS drains your bank account.

Security - The Other Thing That'll Break Your Deployment

Alright, let's talk security. This is where good intentions meet reality and reality usually wins.

Authentication: A Comedy of Errors:
API key auth works great until your security team discovers hardcoded keys in your Git history and starts scheduling "urgent security reviews." OIDC integration adds 500ms to every request and dies spectacularly when Azure AD decides to take a coffee break during your product demo. Reference the authentication troubleshooting guide and Kubernetes secrets best practices before your CISO makes you rewrite everything.

Network Policies Will Destroy You:
K8s network policies sound great until they block legitimate traffic in ways that take hours to debug. Start without them, get everything working, then add policies incrementally. Otherwise you'll spend your first week troubleshooting "connection refused" errors. Reference the Kubernetes network policy guide and CNI troubleshooting docs when everything breaks.

Security Architecture is a Beautiful Disaster:
Your security setup will become a nightmare collection of API keys that get committed to Git, OIDC configs that break when someone sneezes on the identity provider, TLS certificates that expire during your vacation, network policies that block legitimate traffic in ways that make you question your life choices, and RBAC configs that work perfectly in staging but explode spectacularly in production. Every single layer of security will find new and creative ways to ruin your weekend.

TLS Certificates: Your 2AM Nightmare:
Weaviate requires TLS for production, because of course it does. cert-manager works perfectly in staging, then mysteriously stops renewing certificates in production and your entire search API goes dark during the holiday weekend. I watched this happen on Christmas Eve when Let's Encrypt rate limits kicked in and cert-manager just... gave up. Always have manual cert rotation scripts ready and test them monthly, not when you're getting paged while opening presents. Study TLS certificate management and Let's Encrypt production guidelines before your certificates expire during the IPO demo.

The RBAC Rabbit Hole:
RBAC configurations that work in staging will fail in prod because of subtle differences in service account permissions. Test your exact RBAC setup in a staging environment that mirrors production, not your local dev cluster. Study Kubernetes RBAC and service account documentation.

What You Actually Need to Monitor (Not What the Docs Say)

Production Monitoring Architecture: Set up Prometheus to collect metrics, Grafana to make pretty graphs, and alerts that'll wake you up when latency hits 100ms, memory usage goes above 80%, or index rebuilds take forever. Because someone needs to know when shit's about to hit the fan.

Metrics That Matter:
Prometheus metrics are fine, but focus on memory usage per node, query latency p99 (not p50), and index rebuild times. Everything else is noise until you're debugging a production incident. Set up Grafana dashboards and Prometheus alerting rules before you need them.

The Backup Disaster You Haven't Thought Of:
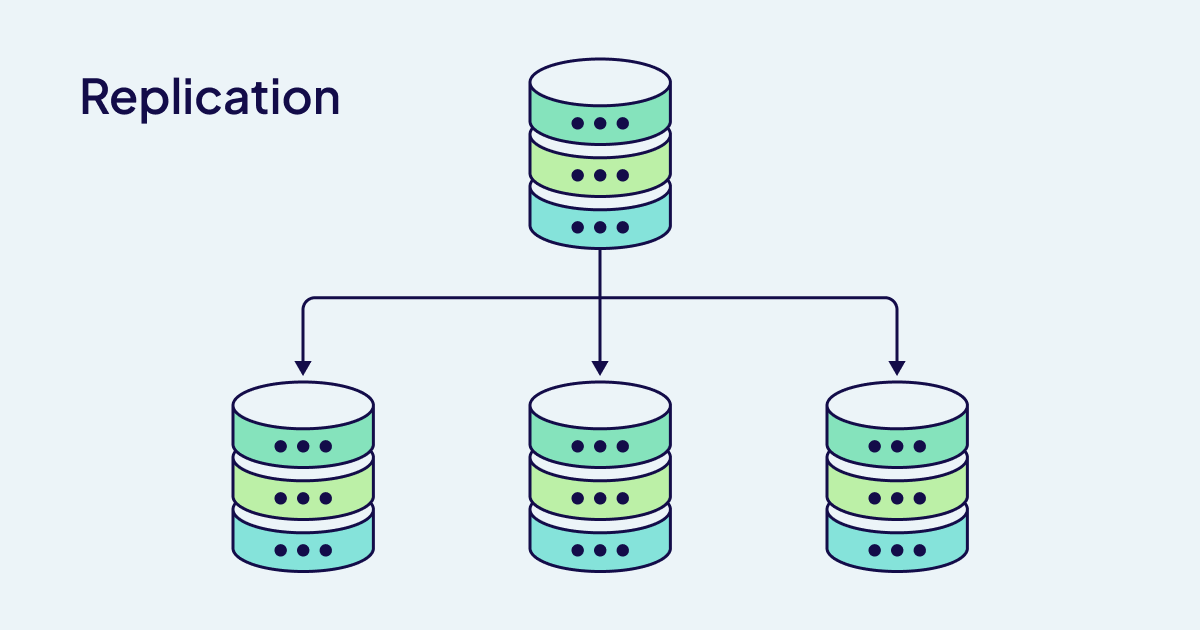
Weaviate backups work great until you need to restore them. Test your backup/restore process monthly, not when shit hits the fan. Cross-region replication sounds awesome until you deal with split-brain scenarios and data lag. Study backup configuration and disaster recovery patterns extensively.

Performance "Baselines" vs Reality:
Weaviate benchmarks show sub-millisecond latency in perfect conditions. In production, with network overhead, authentication, and real query patterns, expect 10-50ms response times. Plan accordingly. Check performance tuning guidelines and query optimization techniques.

The Hard Truth About "Production Ready":
Nobody is ever actually ready. You deploy to staging, everything breaks, you fix it, then deploy to production where it breaks in completely different ways that make you wonder if you're cursed. The entire "planning phase" is just elaborate guesswork until real users start hitting your API. Follow the production readiness checklist like scripture, but it'll still miss half the shit that actually goes wrong.

Weaviate Production Deployment Options Comparison

Feature

Weaviate Cloud (Serverless)

Weaviate Cloud (Enterprise)

Self-Managed Kubernetes

Setup Complexity

Minimal

  • managed service

Low

  • dedicated resources

High

  • full infrastructure management

Scaling

Automatic based on usage

Manual with auto-scaling options

Manual configuration required

Cost Structure

Pay-per-query (death by 1000 cuts)

Fixed monthly + usage (predictable pain)

Infrastructure + your sanity costs

Control Level

Limited configuration

Moderate customization

Full control over all settings

Security

Shared responsibility

Dedicated environment

Full responsibility

Maintenance

Fully managed

Managed with access

Your problem when shit breaks

SLA

99.9% uptime

99.95% uptime

Good fucking luck

Multi-Region

Available

Available

Manual setup required

Integration

REST API, GraphQL

REST API, GraphQL, VPC

Full access to all APIs

How to Actually Deploy Weaviate in Production (Without Everything Breaking)

Here's the deployment process that actually works in production. Forget the perfect-world tutorials - this is what happens when you deploy Weaviate at scale and need it to stay up.

Weaviate GKE Architecture

The Helm Deployment (That Will Fail Twice Before It Works)

1. Add the Helm Repo (The Easy Part)

helm repo add weaviate https://weaviate.github.io/weaviate-helm
helm repo update

Reference the official Helm chart documentation and Helm best practices before proceeding.

2. Create the Namespace (And Set Up For Debugging)

kubectl create namespace weaviate-production  
## Don't set the default namespace - you'll regret it when debugging
## Windows path limits will fuck you - kubectl fails if config path > 260 chars

Check Kubernetes namespace documentation and kubectl context management for proper namespace handling.

3. Production Values (Where Everyone Gets It Wrong)

Weaviate Scaling Architecture

Here's a production-values.yaml that's been battle-tested:

## 3 replicas sounds good until one node dies during a memory spike
replicas: 5  # You need more than you think
image:
  tag: "1.30.0"  # Pin your versions or prepare for surprises

## Resource limits that work in the real world
resources:
  requests:
    cpu: "2000m"     # CPU requests too low = throttling hell
    memory: "8Gi"     # Memory formula is a lie, double it
  limits:
    cpu: "4000m"     # Leave headroom for index rebuilds
    memory: "16Gi"    # OOMKilled errors are production killers

## Storage that won't bankrupt you
persistence:
  enabled: true
  storageClass: "gp3"  # Not io2 unless you hate money
  size: "1000Gi"       # Plan for growth, resizing is painful

## Auth that security won't hate
authentication:
  apikey:
    enabled: true
    allowedKeys: []  # Use secrets, not hardcoded keys

## Actually useful monitoring
monitoring:
  enabled: true
  prometheus:
    enabled: true    # You'll need this for debugging

Study the Helm values documentation thoroughly and check Kubernetes resource management guidelines before deployment.

The Deployment Process (Prepare for Disappointment)

4. Deploy and Watch Things Break

## First attempt - AWS/GCP will laugh at your storage class assumptions
helm install weaviate-prod weaviate/weaviate \
  --namespace weaviate-production \
  --values production-values.yaml

## Check what actually failed
kubectl get events -n weaviate-production --sort-by='.lastTimestamp'

Learn Helm troubleshooting techniques and kubectl debugging commands for proper namespace handling.

5. Debug the Inevitable Issues

Weaviate Monitoring Setup

Your deployment will fail. Here's how to debug it:

## Watch the pod creation process
kubectl get pods -n weaviate-production -w

## Check what's actually wrong (usually storage or networking)
kubectl describe pod -n weaviate-production -l app=weaviate

## Look at the logs for actual errors
kubectl logs -n weaviate-production -l app=weaviate --previous

Reality Check: Those "5-10 minutes" deployment times are complete fantasy, like Kubernetes documentation written by people who've never deployed anything to production. Budget 30 minutes if you're lucky, 2 hours when networking inevitably shits the bed, and a full day if you hit the EKS 1.28.2 ingress controller bug that makes pods disappear into the void. Check Kubernetes troubleshooting guide and pod debugging docs when reality crushes your deployment dreams.

Horizontal Scaling (The Hard Part)

6. Sharding Configuration (That Actually Works)

Weaviate Sharding Architecture

Sharding config that won't bite you later:

from weaviate.classes.config import Configure

## Don't just match node count - plan for growth
client.collections.create(
    "ProductCatalog", 
    sharding_config=Configure.sharding(
        virtual_per_physical=128,  # More virtuals = easier resharding
        desired_count=6,           # More shards than nodes
    ),
    replication_config=Configure.replication(
        factor=2,                  # 2 is enough, 3+ kills performance
        async_enabled=True         # Unless you love waiting
    )
)

Study Weaviate sharding configuration and replication strategies before implementing.

Monitoring Setup: Set up Prometheus to collect metrics, Grafana to show you which part of your infrastructure is currently on fire, and alerts that'll wake you up at 2am when everything collapses. Because it will collapse - usually right when you sit down for dinner with your family or during the company all-hands meeting.

7. Validate Scaling (Or Watch It Fail)

## Check if shards actually got created
kubectl logs -n weaviate-production -l app=weaviate | grep -i "shard\|replica"

## Verify data distribution (this will lie to you sometimes)
curl -H "Authorization: Bearer $API_KEY" \
     "https://weaviate.your-domain.com/v1/schema/ProductCatalog/shards"

Check cluster validation techniques and API documentation for verification methods.

Performance Tuning (The Fun Part)

8. Resource Planning That Works

Weaviate Replication Architecture

Forget the formula. Here's what actually works:

  • Memory Reality: That formula assumes perfect conditions. In production, multiply by 3x for frequent updates, 2x for read-heavy workloads
  • CPU Truth: 1 core per million vectors is bullshit during index rebuilds. You'll need 2-4x that
  • IOPS Reality: Start with gp3, upgrade to io2 when you actually hit limits (not before)

Reference resource sizing guidelines and performance optimization docs.

9. Networking (Where Everything Goes Wrong)

Ingress config that works:

apiVersion: networking.k8s.io/v1
kind: Ingress
metadata:
  name: weaviate-ingress
  annotations:
    nginx.ingress.kubernetes.io/ssl-redirect: "true"
    nginx.ingress.kubernetes.io/backend-protocol: "HTTP"
    nginx.ingress.kubernetes.io/proxy-connect-timeout: "600"
    nginx.ingress.kubernetes.io/proxy-send-timeout: "600"
    nginx.ingress.kubernetes.io/proxy-read-timeout: "600"  # Vector queries can be slow
    nginx.ingress.kubernetes.io/proxy-body-size: "10m"     # For batch imports
spec:
  tls:
    - hosts:
        - weaviate.your-domain.com
      secretName: weaviate-tls  # Don't forget the cert
  rules:
    - host: weaviate.your-domain.com
      http:
        paths:
          - path: /
            pathType: Prefix
            backend:
              service:
                name: weaviate-prod
                port:
                  number: 80

Study Kubernetes ingress documentation and NGINX ingress controller configuration thoroughly.

Production Reality Checks

10. Load Testing (That Actually Tells You Something)

import weaviate
import concurrent.futures
import time
import statistics

def stress_test():
    """Test that will actually break your cluster if it's not ready"""
    client = weaviate.connect_to_cluster(
        cluster_url="https://weaviate.your-domain.com",
        timeout_config=weaviate.connect.Timeout(query=30)  # Realistic timeout
    )
    
    start_time = time.time()
    try:
        # Test with realistic query complexity
        results = client.collections.get("ProductCatalog").query.near_text(
            query="artificial intelligence machine learning deep neural networks",
            limit=1000,  # Realistic result set
            return_metadata=["score", "distance"]
        )
        duration = time.time() - start_time
        return duration, True
    except Exception as e:
        print(f"Query failed: {e}")
        return time.time() - start_time, False

## This will break your cluster if it's not ready
## Fun fact: hits you with "weaviate: connection reset by peer" when it can't handle the load
latencies = []
errors = 0

with concurrent.futures.ThreadPoolExecutor(max_workers=50) as executor:  # Real load
    futures = [executor.submit(stress_test) for _ in range(200)]
    for future in concurrent.futures.as_completed(futures):
        latency, success = future.result()
        if success:
            latencies.append(latency)
        else:
            errors += 1

if latencies:
    print(f"P50 latency: {statistics.median(latencies):.3f}s")
    print(f"P95 latency: {statistics.quantiles(latencies, n=20)[18]:.3f}s")
    print(f"Error rate: {errors/(len(latencies)+errors):.1%}")
else:
    print("All queries failed. Your cluster is fucked.")

11. The Health Checks That Actually Matter

## Check if the cluster is actually working (not just "running")
for i in {1..10}; do
    curl -f -s "https://weaviate.your-domain.com/v1/meta" >/dev/null && echo "OK" || echo "FAIL"
    sleep 1
done

## Memory usage that will kill your cluster
kubectl top pods -n weaviate-production | awk 'NR>1 {print $3}' | sed 's/%//' | sort -nr

## Storage that's about to run out
kubectl get pvc -n weaviate-production -o jsonpath='{range .items[*]}{.metadata.name}: {.status.capacity.storage}{"
"}{end}'

Production Success Reality Check:

Sub-100ms latency is marketing bullshit. Plan for 50-200ms in the real world with real users doing real stupid things. The Loti case study handling 9 billion vectors looks amazing until you realize they have dedicated SREs, unlimited AWS credits, and probably sacrificed a goat to the database gods. Your success metrics are simpler: users stop bitching in Slack, queries don't timeout during the CEO demo, and you get to sleep through the night without getting woken up by PagerDuty.

Study load testing best practices and performance benchmarking guidelines for realistic expectations.

Common Production Deployment Issues and Solutions

Q

Why do my pods get stuck in Pending state and how do I fix it?

A

This is probably the first thing that'll go wrong during your deployment. Your pods just sit there mocking you with their Pending status for 5+ minutes.

What's actually happening: Your cluster is fucked - either no resources or storage config is broken. Here's how to unfuck it:

kubectl describe pod <pod-name>
kubectl get nodes -o wide
kubectl get storageclass

Usually happens because your cluster nodes are smaller than what Weaviate actually needs, or AWS/GCP decided your storage class doesn't exist today. You'll see helpful errors like "0/3 nodes are available: 3 Insufficient memory" that tell you exactly nothing useful. Check that your nodes aren't t2.micro instances trying to run enterprise software, and verify your storage classes exist before Kubernetes starts lying to you. Study minimum resource requirements and pray your cloud provider's dynamic provisioning works.

Q

Why are my queries taking forever in production when they were fast in dev?

A

Ah yes, the classic "works on my machine" but production is slow as molasses. If your queries are consistently taking over 100ms, here's what's probably wrong:

Solutions:

  • Memory pressure: Increase memory allocation if working set doesn't fit in RAM
  • CPU throttling: Check if CPU limits are being hit during peak load
  • Network latency: Verify ingress configuration and load balancer settings
  • Index optimization: Ensure proper HNSW parameters for your data distribution

Monitor with: kubectl top pods and check Prometheus metrics for weaviate_query_duration_seconds.

Q

How do I safely update Weaviate version in production?

A

Process for zero-downtime upgrades:

  1. Enable replication with factor ≥ 2
  2. Update one replica at a time using rolling updates
  3. Validate each node before proceeding to the next
helm upgrade weaviate-prod weaviate/weaviate \
  --set image.tag="1.30.1" \
  --set updateStrategy.type=RollingUpdate

Zero-downtime upgrade guide provides detailed procedures for production environments.

Q

What causes "connection refused" errors from applications?

A

Common causes:

  • Service discovery issues in Kubernetes
  • Network policies blocking traffic
  • Authentication configuration problems
  • Load balancer health check failures

Debugging steps:

kubectl get svc
kubectl get endpoints weaviate-prod
kubectl logs -l app=weaviate --tail=50

Verify service exposure and DNS resolution from client pods.

Q

How do I handle storage expansion when running out of disk space?

A

When you're about to run out of disk space (because you always underestimate storage growth):

  1. Check current usage: kubectl exec <pod> -- df -h
  2. Expand PVC if storage class supports it:
kubectl patch pvc weaviate-data-weaviate-prod-0 -p '{\"spec\":{\"resources\":{\"requests\":{\"storage\":\"1Ti\"}}}}'
  1. Monitor expansion progress: kubectl get pvc -w

Prevention: Set up alerts for 80% disk utilization and implement automated cleanup of old backup files.

Q

Why do I get different search results when I run the same query twice?

A

Welcome to the joys of eventual consistency. This one will drive you absolutely crazy because the same query returns different results seemingly at random.

Solutions:

  • Enable strong consistency for critical operations
  • Adjust consistency level: ONE, QUORUM, or ALL
  • Monitor replication lag through Prometheus metrics
Q

How do I configure monitoring for production alerting?

A

Essential metrics to monitor:

  • weaviate_query_duration_seconds - Query latency
  • weaviate_objects_total - Object count growth
  • weaviate_vector_index_operations_total - Index operation rate
  • weaviate_lsm_bloom_filters_duration_seconds - Storage performance

Grafana dashboard setup:

## Add to your monitoring stack
apiVersion: v1
kind: ConfigMap
metadata:
  name: weaviate-dashboard
data:
  dashboard.json: |
    {
      \"dashboard\": {
        \"title\": \"Weaviate Production Metrics\"
      }
    }

Reference the monitoring guide for complete setup instructions.

Q

What backup strategy should I implement for production data?

A

Recommended approach:

  1. Daily full backups to object storage (S3/GCS/Azure Blob)
  2. Point-in-time recovery capability
  3. Cross-region backup replication for disaster recovery
## Configure automated backups
kubectl apply -f - <<EOF
apiVersion: batch/v1
kind: CronJob
metadata:
  name: weaviate-backup
spec:
  schedule: \"0 2 * * *\"
  jobTemplate:
    spec:
      template:
        spec:
          containers:
          - name: backup
            image: weaviate/backup-tool:latest
            command: [\"backup\", \"--full\"]
EOF

Test restore procedures monthly to ensure backup integrity and recovery time objectives.

Q

How do I scale my cluster when approaching capacity limits?

A

Horizontal scaling process:

  1. Add new Kubernetes nodes to the cluster
  2. Update Helm configuration to increase replica count
  3. Configure new collections with appropriate shard count
  4. Migrate existing data if needed

Vertical scaling considerations:

  • Memory can be increased by updating resource limits
  • CPU scaling requires careful testing under production load
  • Storage expansion depends on your storage class capabilities

Monitor capacity with: kubectl top nodes and set alerts at 70% resource utilization for proactive scaling.

Advanced Scaling (Or How to Make Simple Things Complex)

So your Weaviate cluster is running and management wants to "optimize for scale." Here's what actually works when you're dealing with production traffic that wants to crush your carefully planned deployment.

Weaviate Vertical Scaling

Sharding Reality vs Documentation

The Virtual Sharding Lie:
The docs say 128 virtual shards per physical shard is "flexible." What they don't tell you is that resharding is a complete nightmare that requires downtime. I watched it take down our production cluster for 6 hours on a Tuesday morning because the resharding process ran out of memory at 87% completion. Here's what actually works based on painful experience - check sharding configuration and virtual shard planning before you commit to a strategy you'll regret:

## For datasets that will grow (all of them)
Configure.sharding(
    virtual_per_physical=512,  # Over-provision from day 1
    desired_count=10,          # Plan for growth, not current size
)

## Don't do this - you'll regret it
Configure.sharding(
    virtual_per_physical=64,   # "Lower overhead" = resharding hell later
    desired_count=3,           # "Minimal" = single point of failure
)

Hotspot Detection That Works:
Shard distribution will lie to you. Here's how to find real hotspots:

## Check CPU usage per pod, not shard distribution
kubectl top pods -n weaviate-production --sort-by=cpu

## Memory usage tells the real story
kubectl top pods -n weaviate-production --sort-by=memory

## Query latency by pod (requires Prometheus)
curl -s 'http://prometheus:9090/api/v1/query?query=weaviate_query_duration_seconds_sum' | jq

Reference Prometheus monitoring setup and Kubernetes resource monitoring for comprehensive metrics collection.

The Async Replication Lie

"300-500% Performance Improvement":
Yes, async replication improves write performance by 300-500%. It also introduces eventual consistency bugs that will drive you insane. Your application needs to handle the fact that reads might return stale data for seconds or minutes. Study consistency models and replication strategies before enabling.

from weaviate.classes.config import Configure, ReplicationDeletionStrategy

Configure.replication(
    factor=2,                # 3+ kills performance, 2 is enough
    async_enabled=True,      # Fast writes, stale reads
    deletion_strategy=ReplicationDeletionStrategy.TIME_BASED_RESOLUTION
)

Monitor replication lag or watch your app break:

## Check lag between replicas
kubectl logs -n weaviate-production -l app=weaviate | grep "replication.*lag"

Check replication monitoring and async replication troubleshooting guides.

Geographic Distribution Architecture: Multi-region deployments are a nightmare involving service mesh configs that break mysteriously, network latency that kills performance, failover mechanisms that fail to fail over, and data that magically disappears between regions.

Geographic Distribution Fantasy:
Cross-region replication sounds great in theory. In practice, you're debugging network latency, dealing with split-brain scenarios, and explaining to customers why their data sometimes disappears for a few minutes. Review multi-region deployment patterns and cross-region networking before attempting.

## This looks simple but will cause you pain
apiVersion: v1
kind: Service
metadata:
  name: weaviate-us-west
  labels:
    region: us-west-2
spec:
  selector:
    app: weaviate
    region: us-west-2
## FIXME: Weaviate v1.30.1 throws "region selector not found" - nice QA testing guys
## TODO: Add network policies or AWS will route your traffic through Mars for fun
## TODO: Add monitoring or discover your regions are out of sync from angry customers  
## TODO: Add circuit breakers or watch one EKS outage cascade into total failure

Query Optimization Techniques

HNSW Index Tuning
The Hierarchical Navigable Small World (HNSW) index is Weaviate's core for vector similarity search. Production tuning involves balancing query speed, memory usage, and index build time:

## High-performance configuration for production
collection_config = {
    "vectorizer": "text2vec-openai",
    "vectorIndexConfig": {
        "ef": 256,          # Query-time search depth
        "efConstruction": 512,  # Build-time search depth  
        "maxConnections": 32    # Node connectivity
    }
}

Reference HNSW index configuration and vector index tuning documentation.

Query Pattern Analysis
Different query patterns require different optimization approaches:

  • High-throughput, low-latency queries: Increase memory allocation, optimize ef parameter
  • Complex hybrid queries: Balance vector and keyword search performance
  • Batch processing: Optimize for sequential access patterns

Study query optimization techniques and performance tuning guidelines for specific patterns.

Memory and Storage Optimization

Memory Hierarchy is Your New Nemesis
Your Weaviate cluster will become a memory-hungry monster that eats RAM for breakfast:

## Optimized resource allocation
resources:
  requests:
    memory: "16Gi"  # Working set size
  limits:
    memory: "32Gi"  # Allow for index operations

Your working set needs to fit in memory or performance goes to hell. Watch memory pressure with kubectl top pods and bump allocation when things get tight - not before, because you'll just waste money on unused RAM. Study memory management best practices and Kubernetes memory monitoring before your pods get OOMKilled during the demo.

Storage Will Become Your Bottleneck
Your storage choice will make or break performance, and the wrong choice costs real money:

  • NVMe SSDs: 10x faster index builds, 3x higher AWS bills
  • Provisioned IOPS: Consistent performance until your budget runs out
  • Multiple volumes: Separate data and logs or watch I/O contention destroy query times
## High-performance storage configuration
volumeClaimTemplates:
  - metadata:
      name: weaviate-data
    spec:
      accessModes: ["ReadWriteOnce"]
      storageClassName: "gp3-nvme"
      resources:
        requests:
          storage: "1Ti"

Check storage class optimization and persistent volume configuration for production workloads.

Monitoring and Alerting for Scale

Metrics That Actually Matter
Monitor this stuff or get paged at 3am when everything explodes:

  • Query latency percentiles: P50, P95, P99 - because averages lie to you
  • Memory utilization trends: Catch capacity issues before OOMKiller strikes
  • Index operation rates: Background maintenance that'll crush your performance
  • Replication lag: How far behind your replicas are when consistency matters
## Prometheus alerting rules
groups:
  - name: weaviate.rules
    rules:
      - alert: WeaviateHighQueryLatency
        expr: weaviate_query_duration_seconds{quantile="0.95"} > 0.1
        for: 5m
        annotations:
          summary: "Weaviate query latency exceeded 100ms"

Study Prometheus alerting rules and monitoring best practices.

Automated Scaling That Actually Works
Build predictive scaling before you need it, because manual scaling at 2am sucks:

## Example capacity monitoring
import time
import psutil

def check_capacity_trends():
    memory_usage = psutil.virtual_memory().percent
    disk_usage = psutil.disk_usage('/').percent
    
    if memory_usage > 70:
        # Trigger memory expansion
        scale_memory_resources()
    
    if disk_usage > 80:
        # Trigger storage expansion  
        expand_storage_volumes()

Performance Validation Framework

Load Testing for Production Scale
Validate performance improvements using realistic workloads:

import concurrent.futures
import weaviate
from datetime import datetime

def production_load_test():
    """Simulate production query patterns"""
    client = weaviate.connect_to_cluster("https://weaviate-prod.company.com")
    
    # Test various query types
    test_cases = [
        {"query": "machine learning", "limit": 10},
        {"query": "artificial intelligence", "limit": 50}, 
        {"query": "data science", "limit": 100}
    ]
    
    results = []
    with concurrent.futures.ThreadPoolExecutor(max_workers=20) as executor:
        for test_case in test_cases:
            future = executor.submit(run_query_test, client, test_case)
            results.append(future)
    
    # Analyze performance metrics
    latencies = [f.result() for f in concurrent.futures.as_completed(results)]
    avg_latency = sum(latencies) / len(latencies)
    
    return avg_latency < 50  # 50ms target (took me 3 weeks to get there)

The Reality of "Advanced" Scaling:

Most of this "advanced" stuff is premature optimization. Start simple, measure what actually breaks, then fix those specific bottlenecks. The Loti case study with 9 billion vectors is impressive, but they also have a dedicated team and enterprise support. Your scaling success is measured by: queries not timing out, users not complaining, and you not getting paged at 3am.

Reference scaling best practices and performance optimization guides for realistic scaling expectations.

Essential Resources for Production Weaviate Deployment

Related Tools & Recommendations

pricing
Similar content

Vector DB Cost Analysis: Pinecone, Weaviate, Qdrant, ChromaDB

Pinecone, Weaviate, Qdrant & ChromaDB pricing - what they don't tell you upfront

Pinecone
/pricing/pinecone-weaviate-qdrant-chroma-enterprise-cost-analysis/cost-comparison-guide
100%
tool
Similar content

LangChain Production Deployment Guide: What Actually Breaks

Learn how to deploy LangChain applications to production, covering common pitfalls, infrastructure, monitoring, security, API key management, and troubleshootin

LangChain
/tool/langchain/production-deployment-guide
89%
howto
Similar content

FastAPI Kubernetes Deployment: Production Reality Check

What happens when your single Docker container can't handle real traffic and you need actual uptime

FastAPI
/howto/fastapi-kubernetes-deployment/production-kubernetes-deployment
69%
howto
Similar content

Deploy Production RAG Systems: Vector DB & LLM Integration Guide

Master production RAG deployment with vector databases & LLMs. Learn to prevent crashes, optimize performance, and manage costs effectively for robust AI applic

/howto/rag-deployment-llm-integration/production-deployment-guide
55%
tool
Similar content

Weaviate: Open-Source Vector Database - Features & Deployment

Explore Weaviate, the open-source vector database for embeddings. Learn about its features, deployment options, and how it differs from traditional databases. G

Weaviate
/tool/weaviate/overview
51%
troubleshoot
Similar content

Kubernetes Crisis Management: Fix Your Down Cluster Fast

How to fix Kubernetes disasters when everything's on fire and your phone won't stop ringing.

Kubernetes
/troubleshoot/kubernetes-production-crisis-management/production-crisis-management
51%
tool
Similar content

pyenv-virtualenv Production Deployment: Best Practices & Fixes

Learn why pyenv-virtualenv often fails in production and discover robust deployment strategies to ensure your Python applications run flawlessly. Fix common 'en

pyenv-virtualenv
/tool/pyenv-virtualenv/production-deployment
51%
tool
Similar content

Bolt.new Production Deployment Troubleshooting Guide

Beyond the demo: Real deployment issues, broken builds, and the fixes that actually work

Bolt.new
/tool/bolt-new/production-deployment-troubleshooting
51%
integration
Recommended

Claude + LangChain + Pinecone RAG: What Actually Works in Production

The only RAG stack I haven't had to tear down and rebuild after 6 months

Claude
/integration/claude-langchain-pinecone-rag/production-rag-architecture
50%
tool
Similar content

etcd Overview: The Core Database Powering Kubernetes Clusters

etcd stores all the important cluster state. When it breaks, your weekend is fucked.

etcd
/tool/etcd/overview
47%
review
Similar content

Vector Databases 2025: The Reality Check You Need

I've been running vector databases in production for two years. Here's what actually works.

/review/vector-databases-2025/vector-database-market-review
47%
tool
Similar content

Bun Production Optimization: Deploy Fast, Monitor & Fix Issues

Master Bun production deployments. Optimize performance, diagnose and fix common issues like memory leaks and Docker crashes, and implement effective monitoring

Bun
/tool/bun/production-optimization
45%
tool
Similar content

Grok Code Fast 1: Emergency Production Debugging Guide

Learn how to use Grok Code Fast 1 for emergency production debugging. This guide covers strategies, playbooks, and advanced patterns to resolve critical issues

XAI Coding Agent
/tool/xai-coding-agent/production-debugging-guide
45%
troubleshoot
Recommended

Docker Won't Start on Windows 11? Here's How to Fix That Garbage

Stop the whale logo from spinning forever and actually get Docker working

Docker Desktop
/troubleshoot/docker-daemon-not-running-windows-11/daemon-startup-issues
43%
howto
Recommended

Stop Docker from Killing Your Containers at Random (Exit Code 137 Is Not Your Friend)

Three weeks into a project and Docker Desktop suddenly decides your container needs 16GB of RAM to run a basic Node.js app

Docker Desktop
/howto/setup-docker-development-environment/complete-development-setup
43%
news
Recommended

Docker Desktop's Stupidly Simple Container Escape Just Owned Everyone

compatible with Technology News Aggregation

Technology News Aggregation
/news/2025-08-26/docker-cve-security
43%
tool
Similar content

SvelteKit Deployment Troubleshooting: Fix Build & 500 Errors

When your perfectly working local app turns into a production disaster

SvelteKit
/tool/sveltekit/deployment-troubleshooting
42%
howto
Similar content

Bun Production Deployment Guide: Docker, Serverless & Performance

Master Bun production deployment with this comprehensive guide. Learn Docker & Serverless strategies, optimize performance, and troubleshoot common issues for s

Bun
/howto/setup-bun-development-environment/production-deployment-guide
41%
tool
Similar content

Node.js Production Deployment - How to Not Get Paged at 3AM

Optimize Node.js production deployment to prevent outages. Learn common pitfalls, PM2 clustering, troubleshooting FAQs, and effective monitoring for robust Node

Node.js
/tool/node.js/production-deployment
41%
tool
Similar content

Fix Astro Production Deployment Nightmares: Troubleshooting Guide

Troubleshoot Astro production deployment issues: fix 'JavaScript heap out of memory' build crashes, Vercel 404s, and server-side problems. Get platform-specific

Astro
/tool/astro/production-deployment-troubleshooting
41%

Recommendations combine user behavior, content similarity, research intelligence, and SEO optimization