Currently viewing the human version
Switch to AI version

Why Dynamic Batching Will Break Your Deployment (And How to Fix It)

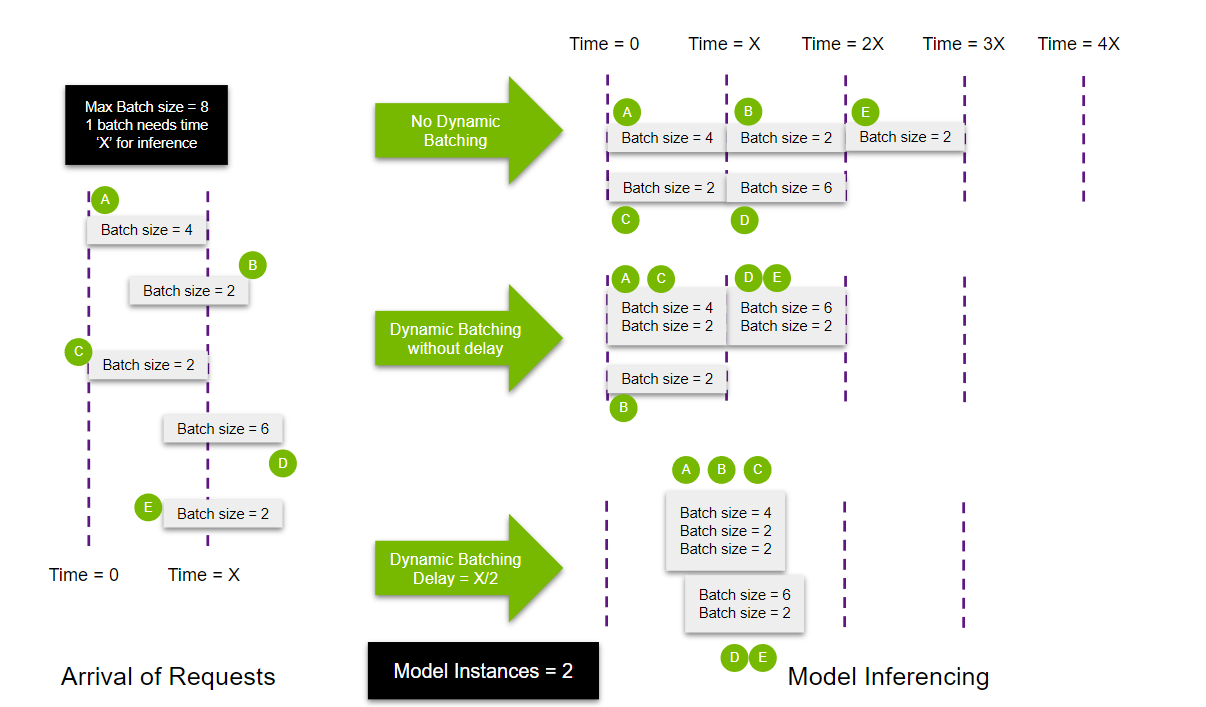
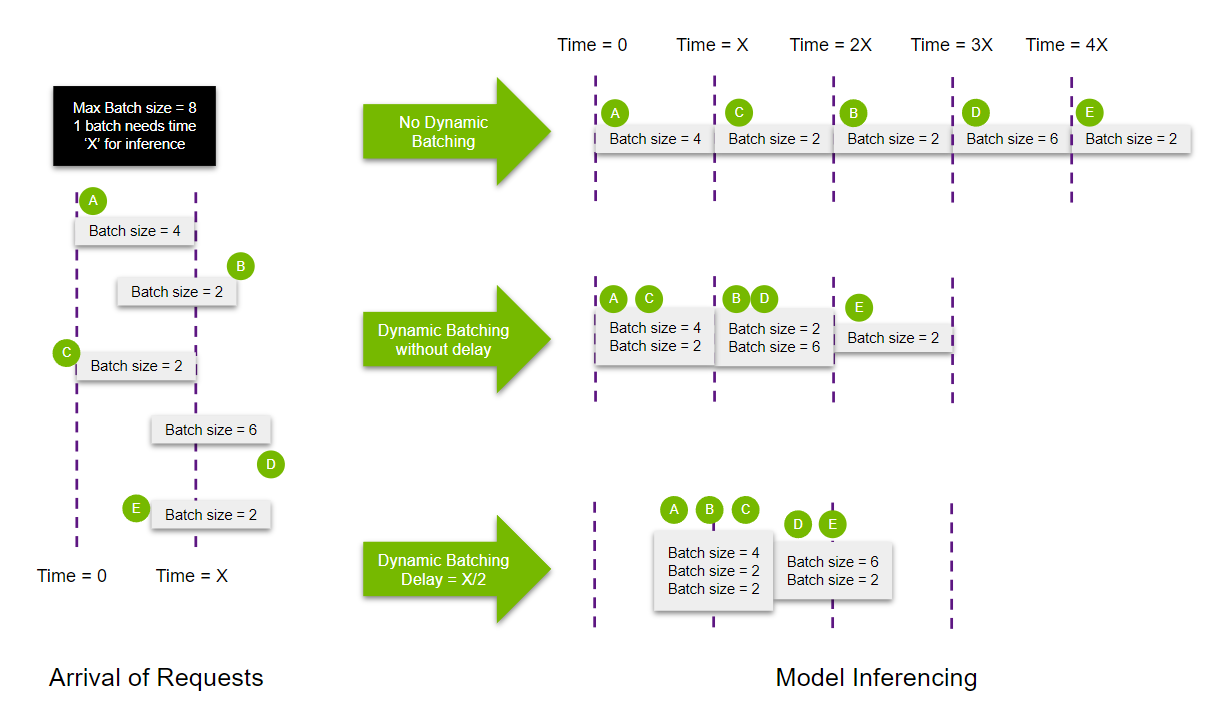
Dynamic batching sounds simple - batch requests, get better performance. Yeah, right. It's a memory-eating monster that will crash your server and leave you staring at CUDA out of memory errors during dinner while your family's calling you to come eat.

The Memory Problem Nobody Talks About

Dynamic batching works by collecting requests and batching them together. Simple enough. What the docs don't mention is that recent Triton versions have memory leaks where batched requests don't get garbage collected properly, especially with ONNX models.

We found this out the hard way when our production cluster started OOMing after like 6 hours? Maybe 8? I was half asleep. Memory usage would just climb until everything crashed. Found this GitHub issue that covers the same problem we hit. Fucking memory leaks everywhere.

Quick fix: Restart your Triton server every 4 hours with a cron job. Not elegant, but it works:

0 */4 * * * docker restart triton-server

Configuration That Actually Works

Skip the simple dynamic_batching { } - it'll use defaults that are garbage. Here's what we use in production:

dynamic_batching {
  max_queue_delay_microseconds: 50000
  preferred_batch_size: [4, 8]
  max_queue_size: 256
}

Why these specific numbers work: max_queue_delay_microseconds: 50000 gives you 50ms to collect requests without users thinking your API is broken. preferred_batch_size: [4, 8] is the sweet spot for most transformers - smaller batches start processing immediately, larger batches actually improve throughput. max_queue_size: 256 stops the queue from eating all your fucking memory when traffic spikes.

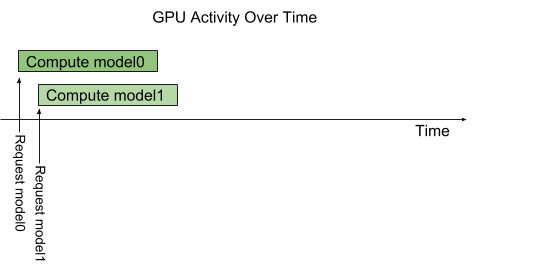
Multiple Instances: More Complex Than It Looks

Multiple model instances sound like free performance, but they're memory hungry and the scheduler is dumb as hell. We tried 4 instances of a BERT model and the scheduler kept sending all requests to instance 0 while the others sat idle.

There was a round-robin scheduling bug that was supposedly fixed in earlier versions, but we still see uneven load distribution in current releases. Monitor your instances with nvidia-smi and you'll see what I mean.

Config that works:

instance_group [
  { count: 2, kind: KIND_GPU, gpus: [0] }
]

Start with 2 instances max. More than that and you're just asking for memory issues and debugging nightmares. The performance gains drop off hard after 2 instances anyway - this benchmark shows diminishing returns.

Real Performance Numbers (Not Marketing BS)

Here's what we actually see in production with a ResNet-50 model on an A100:

  • Baseline (no optimization): ~380-420 infs/sec, P95 latency around 28ms
  • Dynamic batching only: ~1150-1300 infs/sec, P95 latency 42-48ms
  • Dynamic batching + 2 instances: ~1650-1850 infs/sec, P95 latency 52-58ms
  • All optimizations + TensorRT: ~2200-2500 infs/sec, P95 latency 33-38ms

Don't believe the marketing bullshit about 300% improvements. Real gains are more like 100-150% if you're lucky and everything works perfectly.

Testing methodology: Used perf_analyzer with 16 concurrent clients, 10-minute runs, because anything shorter gives you bullshit numbers that don't reflect production load.

Debugging Tips That Would Have Saved Me Hours

When dynamic batching goes wrong (and it will), check these first:

  1. GPU memory usage: nvidia-smi -l 1 in another terminal while running tests
  2. Queue depths: Enable Triton metrics and watch nv_inference_queue_duration
  3. Batch sizes: Log actual batch sizes - you'll be surprised how different they are from what you expect
  4. Memory profiling: If you're on PyTorch, memory snapshots help but they're a pain to set up

Dynamic Batching Workflow

GPU Memory Monitoring with nvidia-smi

Most "performance" issues are actually memory problems in disguise. If your latency starts climbing after 30 minutes of load, you've got a memory leak somewhere.

What Actually Works vs What's Marketing BS

Strategy

Real Improvement

What Actually Happens

Why It Breaks

When to Use It

Dynamic Batching

150-250% (not 400%)

Works great until memory leaks crash your server every 6 hours

Known memory leaks in recent versions, queue gets stuck

Models that batch well, restart server nightly

TensorRT Optimization

100-200% (when it works)

20-minute compile times, 60% of models fail

Dynamic shapes unsupported, cryptic errors

Basic CNNs, pre-compile engines

Multiple Instances

25-75% (diminishing returns)

Scheduler sends all traffic to instance 0

Load balancing bugs, memory overhead

Start with 2 max, monitor with nvidia-smi

OpenVINO (CPU)

50-100% (CPU only)

Good for CPU inference, setup is a nightmare

Documentation is garbage, version conflicts

Edge deployments, no GPUs available

Model Ensemble

Depends (usually slower)

Debugging pipeline failures sucks

Sequential bottlenecks, complex configs

Avoid unless absolutely necessary

TensorRT Optimization: Fast Models, Slow Debugging

TensorRT can make your models blazing fast, but it's also the most infuriating piece of shit in the entire Triton stack. Half your models won't work with it, the other half take like 20 minutes to compile (sometimes longer if you're unlucky), and when it breaks, the error messages are about as helpful as a chocolate teapot.

The TensorRT Compilation Hell

TensorRT optimization promises 2x performance improvements. What it doesn't tell you is that enabling TensorRT turns your 5-second model startup into a 15-minute compilation nightmare. The first time you load a model with TensorRT, it has to build the engine, which is slow as hell.

We learned this during a production deployment when our health check started timing out after 30 seconds. Turns out TensorRT was still compiling the engine. The model warmup feature helps, but you still need to wait for that initial compilation.

Fuck it, here's what actually works: Pre-compile your engines and mount them as volumes. Saves you 15 minutes of waiting around like an idiot.

## Build engine outside of Triton first
trtexec --onnx=model.onnx --saveEngine=model.engine --fp16

## Then use the engine in Triton
platform: \"tensorrt_plan\"

Config that works:

optimization { execution_accelerators {
  gpu_execution_accelerator : [ {
    name : \"tensorrt\"
    parameters { key: \"precision_mode\" value: \"FP16\" }
    parameters { key: \"max_workspace_size_bytes\" value: \"2147483648\" }
    parameters { key: \"trt_engine_cache_enable\" value: \"1\" }
  }]
}}

Models That Will Break With TensorRT

TensorRT is picky as hell. Dynamic shapes will break it, custom operators will break it, and some ONNX ops just aren't supported. We've had success with about 60% of our ONNX models - the rest either fail to compile or give incorrect results.

Models that work: ResNet variants, EfficientNet, basic CNNs, simple transformers
Models that break: Anything with dynamic shapes, custom layers, or newer ONNX operators

The TensorRT operator coverage page is your friend, but it's often outdated. Test with a small batch first before deploying.

Memory Issues Nobody Mentions

TensorRT engines eat GPU memory like crazy. A 500MB ONNX model can become a 2GB TensorRT engine with FP16. Plan for this or you'll run out of GPU memory - we had to reduce our model instances from 4 to 2 just to fit everything in memory.

Memory debugging:

## Check engine size before deployment
trtexec --loadEngine=model.engine --dumpProfile

## Monitor GPU memory during inference
nvidia-smi dmon -s u -i 0

Performance Monitoring That Actually Matters

Forget the Model Analyzer - it's slow, crashes frequently, and the results don't match production. Use perf_analyzer directly:

## Test throughput with realistic load
perf_analyzer -m model_name -b 8 --concurrency-range 1:32:4 --measurement-interval 60000

## Check P99 latency under stress
perf_analyzer -m model_name --latency-threshold 100000 --measurement-mode count_windows

Key metrics to watch:

  • Queue time: If this is high, you need more instances or smaller batches
  • Compute time: If this increases under load, you've got a memory bandwidth issue
  • GPU utilization: Should be >80% for good TensorRT optimization

The GenAI-Perf tool is actually decent for LLMs, but only works with OpenAI-compatible APIs. Setup is a nightmare but results are accurate.

NUMA Optimization (Skip Unless You're On CPUs)

NUMA configuration is mostly useless unless you're running CPU inference. Even then, the performance gains are minimal compared to the complexity.

## Only if you must do CPU inference
tritserver --host-policy=cpu,numa-node=0 --host-policy=cpu,cpu-cores=0-15

Most of your performance bottlenecks will be GPU-related anyway.

What We Actually Deploy in Production

After 6 months of tuning, here's our standard config:

## For CNN models
optimization { execution_accelerators {
  gpu_execution_accelerator : [ {
    name : \"tensorrt\"
    parameters { key: \"precision_mode\" value: \"FP16\" }
    parameters { key: \"max_workspace_size_bytes\" value: \"2147483648\" }
    parameters { key: \"trt_engine_cache_enable\" value: \"1\" }
  }]
}}
dynamic_batching {
  max_queue_delay_microseconds: 50000
  preferred_batch_size: [4, 8]
}
instance_group [{ count: 2 }]

Real performance gains (ResNet-50 on A100):

  • Without TensorRT: ~1150-1300 infs/sec, 42-48ms P95 latency
  • With TensorRT: ~2200-2500 infs/sec, 33-38ms P95 latency

The 2x speedup is real, but only if your model actually works with TensorRT. Test everything thoroughly because the error messages when things go wrong are absolute garbage.

Debugging TensorRT Failures

When (not if) TensorRT breaks, check these:

  1. Enable verbose logging: export CUDA_LAUNCH_BLOCKING=1 - you'll get slightly better error messages
  2. Check ONNX model validity: Use onnx-simplifier first - fixes about 30% of issues
  3. Test with trtexec: Faster than debugging through Triton
  4. Monitor GPU memory: TensorRT failures often start as OOM errors

TensorRT Optimization Workflow

TensorRT Compilation Process

GPU Memory Monitoring: Use tools like nvidia-smi, Grafana dashboards, and Prometheus metrics to track GPU memory utilization. Watch for gradual memory leaks during dynamic batching - memory usage should stabilize, not continuously climb.

TensorRT Optimization Workflow: The process involves model parsing, optimization layer fusion, precision calibration, and engine serialization. Most compilation time is spent in the optimization phase where TensorRT analyzes your model graph for performance improvements.

CUDA Out of Memory Error: The error message you'll see most often: "RuntimeError: CUDA out of memory. Tried to allocate 2.00 GiB (GPU 0; 39.59 GiB total capacity; 37.52 GiB already allocated)"

Performance Monitoring: Use Prometheus metrics at localhost:8002/metrics or set up Grafana dashboards to track GPU utilization, queue depths, and memory usage. The official Triton dashboard template (ID: 12832) exists but needs customization for real production use.

The TensorRT GitHub issues are actually well-maintained and the team responds. Check there before pulling your hair out.

Questions Real Engineers Actually Ask (With Real Answers)

Q

Why does my Triton server keep crashing with OOM errors?

A

Dynamic batching is probably eating all your GPU memory. Recent Triton versions have known memory leak bugs where batched requests don't get freed properly. Set max_queue_size: 256 in your config and restart the server every 4 hours with a cron job until they fix it.

Also check if you're running too many model instances. Memory usage isn't linear - 4 instances can use 3x more memory than expected due to CUDA context overhead.

Oh, and while we're talking about memory - if you've got multiple models loaded, that's another 2-3GB right there.

Q

TensorRT optimization takes 20 fucking minutes, is this normal?

A

Yep, it's a feature, not a bug. TensorRT builds optimized engines from scratch the first time you load a model. ResNet-50 takes 5-15 minutes, transformers can take 30+ minutes. Go get coffee or contemplate your life choices.

Workaround: Build engines with trtexec outside of Triton, then mount them as volumes. Way faster than waiting for Triton to compile on startup.

trtexec --onnx=model.onnx --saveEngine=model.engine --fp16
Q

My GPU utilization is 20% but latency is shit, what's wrong?

A

You're probably not batching properly. Check nvidia-smi - if you see memory usage jumping around, your scheduler is fucked. There were round-robin bugs in earlier versions that cause all requests to hit one instance.

Quick debug: Enable Triton metrics and watch nv_inference_queue_duration. If it's spiking, your queue is backing up.

Q

Should I use Model Analyzer or is it garbage?

A

It's garbage. Takes forever to run, crashes every other time, and gives you results that have nothing to do with reality. Save yourself the headache and just use perf_analyzer directly:

perf_analyzer -m model_name -b 8 --concurrency-range 1:16:2 --measurement-interval 60000

Run for at least 60 seconds because the first few iterations are always slower.

Q

How many model instances should I actually run?

A

Start with 2. More than 2 instances usually just wastes memory and complicates debugging. We tried 4 instances once and spent 3 days figuring out why memory usage was 6x higher than expected.

The official docs say to scale up, but in practice the scheduler can't handle it properly.

Look, I'm debugging something else right now, but quick note - if you're seeing OOM errors, check this first before pulling your hair out like I did.

Q

My model works fine in dev but crashes in production, why?

A

Memory pressure. Dev probably has one user hitting the API every 30 seconds. Production has 50 concurrent users. Dynamic batching suddenly creates 8x larger batches that don't fit in GPU memory.

Set preferred_batch_size: [2, 4] instead of letting it batch up to your max. Better to process smaller batches reliably than crash with large ones.

Q

TensorRT says my model is unsupported, now what?

A

About 40% of models don't work with TensorRT, especially if you have:

  • Dynamic input shapes
  • Custom ONNX operators
  • Newer model architectures

Check the TensorRT operator coverage first. If your model has unsupported ops, try onnx-simplifier to optimize the graph.

If that fails, just run the ONNX model directly. 40% speedup from working ONNX is better than 0% speedup from broken TensorRT.

Anyway, moving on to more debugging bullshit...

Q

How do I debug why performance sucks?

A
  1. Check GPU memory: nvidia-smi dmon -s u -i 0
  2. Monitor queue depths: Enable metrics, watch for spikes
  3. Log batch sizes: Add debug prints to see actual vs expected batch sizes
  4. Test with single requests: Isolate dynamic batching issues

Most "performance" problems are actually config problems. Bad queue settings, wrong batch sizes, or memory leaks disguised as performance issues.

Q

Why doesn't my latency match the benchmarks?

A

Because benchmarks are complete bullshit. They use synthetic loads with perfect request timing and optimal conditions. Real users send requests in random bursts, with weird input sizes, and your preprocessing pipeline is probably fucked.

Our "10ms P95" model has 45ms P95 latency in production because of input preprocessing and queue waiting. Factor in 2-4x overhead for real-world deployment.

Q

Can I just enable all optimizations and call it done?

A

No, that's how you get yourself into debugging hell. We tried enabling everything at once and spent a week figuring out which combination was causing random crashes.

Debugging Workflow

Add one optimization at a time, test for 24 hours, then move to the next. Document what breaks so you don't repeat the same mistakes.

Resources That Actually Help (With Honest Ratings)

Related Tools & Recommendations

tool
Similar content

TensorFlow Serving Production Deployment - The Shit Nobody Tells You About

Until everything's on fire during your anniversary dinner and you're debugging memory leaks at 11 PM

TensorFlow Serving
/tool/tensorflow-serving/production-deployment-guide
100%
integration
Recommended

Grafana + Prometheus リアルタイムアラート連携

実運用で使えるPrometheus監視システムの構築

Grafana
/ja:integration/grafana-prometheus/real-time-alerting-integration
69%
integration
Recommended

Prometheus + Grafana: Performance Monitoring That Actually Works

integrates with Prometheus

Prometheus
/integration/prometheus-grafana/performance-monitoring-optimization
69%
howto
Recommended

Set Up Microservices Monitoring That Actually Works

Stop flying blind - get real visibility into what's breaking your distributed services

Prometheus
/howto/setup-microservices-observability-prometheus-jaeger-grafana/complete-observability-setup
69%
tool
Recommended

BentoML Production Deployment - Your Model Works on Your Laptop. Here's How to Deploy It Without Everything Catching Fire.

competes with BentoML

BentoML
/tool/bentoml/production-deployment-guide
63%
tool
Recommended

BentoML - Deploy Your ML Models Without the DevOps Nightmare

competes with BentoML

BentoML
/tool/bentoml/overview
63%
tool
Recommended

KServe - Deploy ML Models on Kubernetes Without Losing Your Mind

Deploy ML models on Kubernetes without writing custom serving code. Handles both traditional models and those GPU-hungry LLMs that eat your budget.

KServe
/tool/kserve/overview
57%
tool
Similar content

NVIDIA Triton Security Hardening - Stop Getting Pwned by AI Servers

Everything you need to lock down Triton after the August 2025 shitshow

NVIDIA Triton Inference Server
/tool/nvidia-triton-server/security-hardening-guide
50%
tool
Similar content

NVIDIA Triton Inference Server - High-Performance AI Model Serving

Open-source inference serving that doesn't make you want to throw your laptop out the window

NVIDIA Triton Inference Server
/tool/nvidia-triton-server/overview
49%
tool
Recommended

TorchServe - PyTorch's Official Model Server

(Abandoned Ship)

TorchServe
/tool/torchserve/overview
41%
howto
Recommended

Stop Breaking FastAPI in Production - Kubernetes Reality Check

What happens when your single Docker container can't handle real traffic and you need actual uptime

FastAPI
/howto/fastapi-kubernetes-deployment/production-kubernetes-deployment
41%
integration
Recommended

Temporal + Kubernetes + Redis: The Only Microservices Stack That Doesn't Hate You

Stop debugging distributed transactions at 3am like some kind of digital masochist

Temporal
/integration/temporal-kubernetes-redis-microservices/microservices-communication-architecture
41%
howto
Recommended

Your Kubernetes Cluster is Probably Fucked

Zero Trust implementation for when you get tired of being owned

Kubernetes
/howto/implement-zero-trust-kubernetes/kubernetes-zero-trust-implementation
41%
troubleshoot
Recommended

Docker Daemon Won't Start on Windows 11? Here's the Fix

Docker Desktop keeps hanging, crashing, or showing "daemon not running" errors

Docker Desktop
/troubleshoot/docker-daemon-not-running-windows-11/windows-11-daemon-startup-issues
41%
howto
Recommended

Deploy Django with Docker Compose - Complete Production Guide

End the deployment nightmare: From broken containers to bulletproof production deployments that actually work

Django
/howto/deploy-django-docker-compose/complete-production-deployment-guide
41%
tool
Recommended

Docker 프로덕션 배포할 때 털리지 않는 법

한 번 잘못 설정하면 해커들이 서버 통째로 가져간다

docker
/ko:tool/docker/production-security-guide
41%
tool
Recommended

PyTorch Production Deployment - From Research Prototype to Scale

The brutal truth about taking PyTorch models from Jupyter notebooks to production servers that don't crash at 3am

PyTorch
/tool/pytorch/production-deployment-optimization
41%
integration
Recommended

PyTorch ↔ TensorFlow Model Conversion: The Real Story

How to actually move models between frameworks without losing your sanity

PyTorch
/integration/pytorch-tensorflow/model-interoperability-guide
41%
tool
Recommended

PyTorch Debugging - When Your Models Decide to Die

integrates with PyTorch

PyTorch
/tool/pytorch/debugging-troubleshooting-guide
41%
tool
Recommended

TensorFlow - 새벽 3시에 터져도 구글한테 전화할 수 있는 놈

네이버, 카카오가 PyTorch 안 쓰고 이거 쓰는 진짜 이유

TensorFlow
/ko:tool/tensorflow/overview
41%

Recommendations combine user behavior, content similarity, research intelligence, and SEO optimization