PyTorch debugging has gotten better with the latest profiling tools, but the fundamental challenges remain the same: cryptic error messages, dynamic computation graphs that make stack traces useless, and memory management that fails in ways that make you question your understanding of computers. Knowing which debugging approach to take when your model decides to break is half the battle.
Rule #1: Learn to Read PyTorch's Terrible Error Messages
PyTorch error messages are designed to confuse you. Here's how to decode the most common ones:
"RuntimeError: mat1 and mat2 shapes cannot be multiplied"
This means you're trying to multiply tensors that don't match up dimensionally. The error tells you the shapes, but not where in your code this happens. Add shape debugging everywhere:
def debug_shapes(tensor, name="tensor"):
    print(f"{name}: {tensor.shape}")
    return tensor

## Wrap your tensors to see what's happening
x = debug_shapes(x, "input")
hidden = debug_shapes(self.linear1(x), "after_linear1")
output = debug_shapes(self.linear2(hidden), "final_output")
"CUDA error: device-side assert triggered"
Something went wrong on the GPU, but PyTorch won't tell you what. Usually caused by index out of bounds in loss functions or embedding layers. Run the same code on CPU to get actual Python exceptions:
## This debugging pattern has saved me countless hours
if torch.cuda.is_available():
    try:
        result = model(batch.cuda())
    except RuntimeError as e:
        if "device-side assert" in str(e):
            print("CUDA error detected, switching to CPU for debugging...")
            model_cpu = model.cpu()
            batch_cpu = batch.cpu()
            result = model_cpu(batch_cpu)  # This will give you the real error
        else:
            raise e
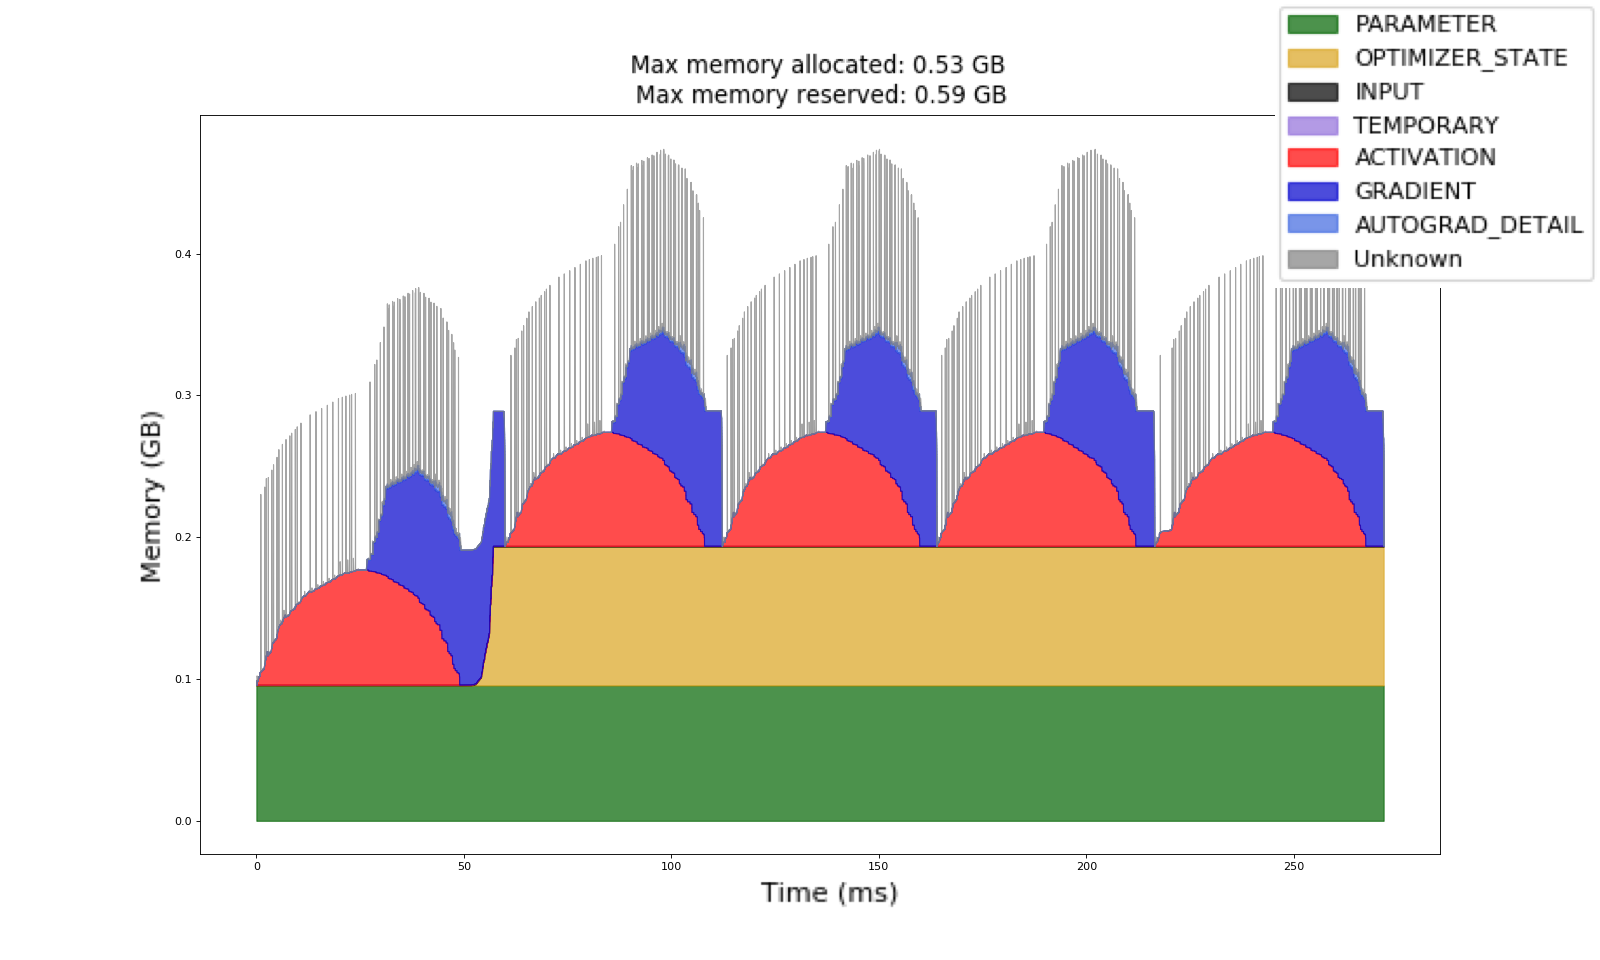
![]()
PyTorch's memory profiler showing GPU memory allocation patterns - essential for debugging OOM errors
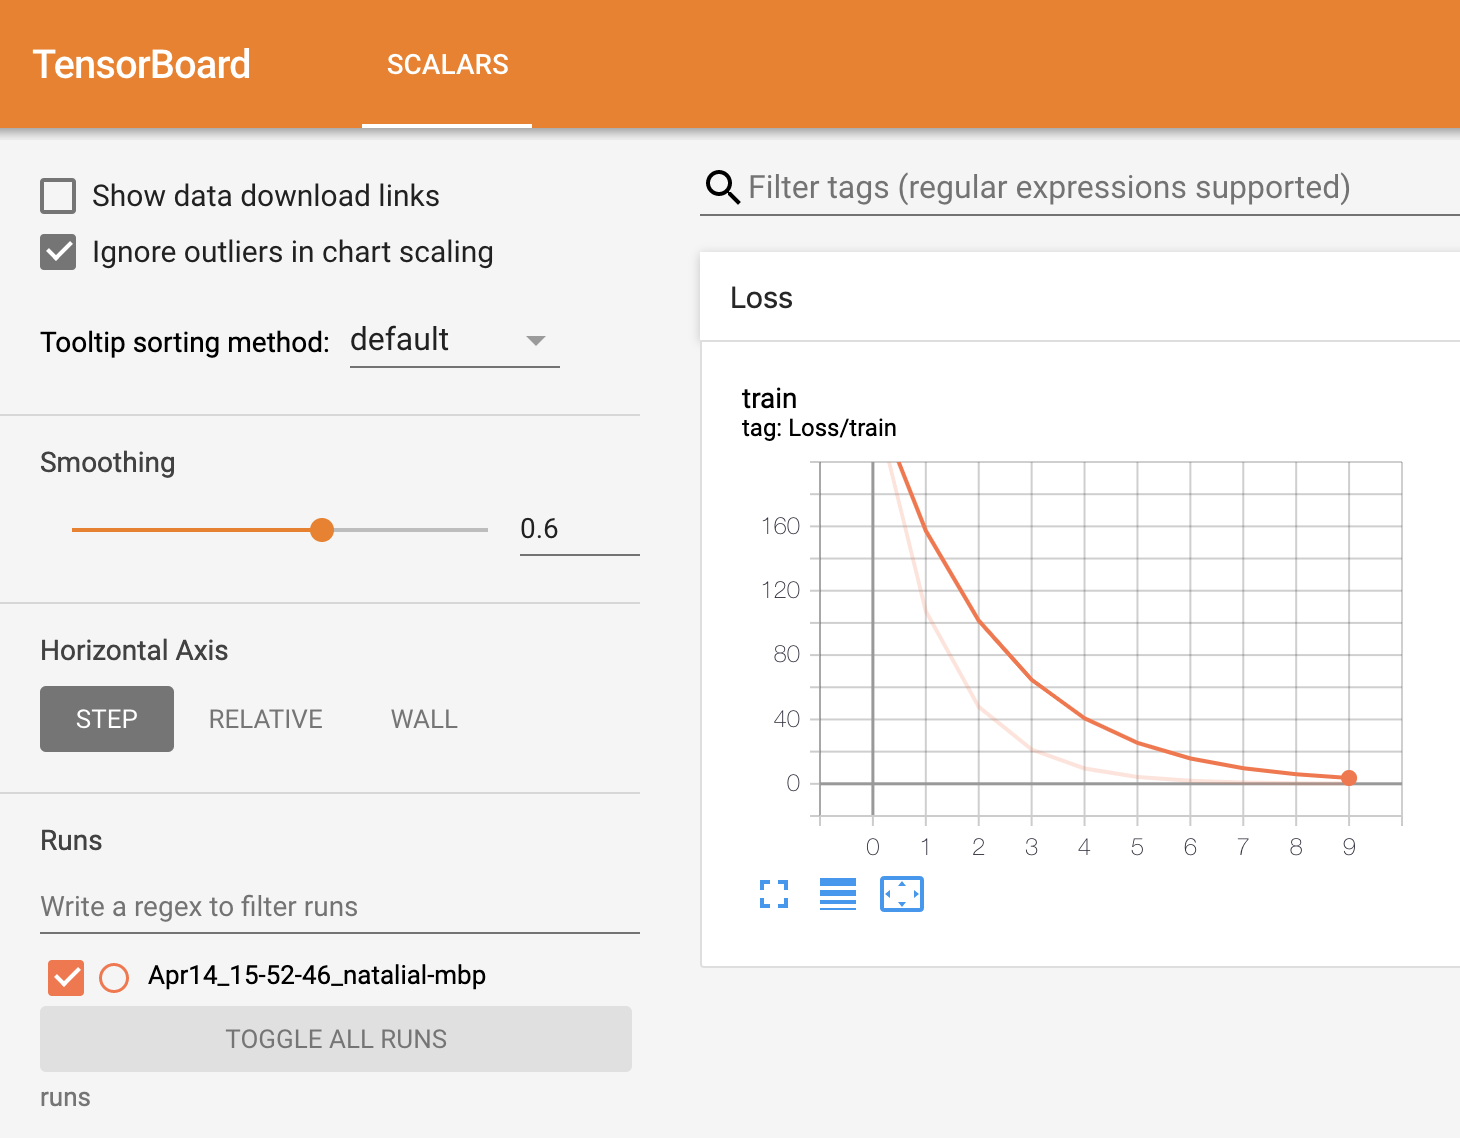
TensorBoard visualization showing loss curves and debugging metrics for PyTorch training
"RuntimeError: Expected all tensors to be on the same device"
You mixed CPU and GPU tensors somewhere. The stack trace usually points to the wrong line. Add device checking to your forward pass:
def check_device_consistency(self, x):
    """Add this to your model's forward method during debugging"""
    model_device = next(self.parameters()).device
    if x.device != model_device:
        raise ValueError(f"Input on {x.device}, model on {model_device}")
    return x
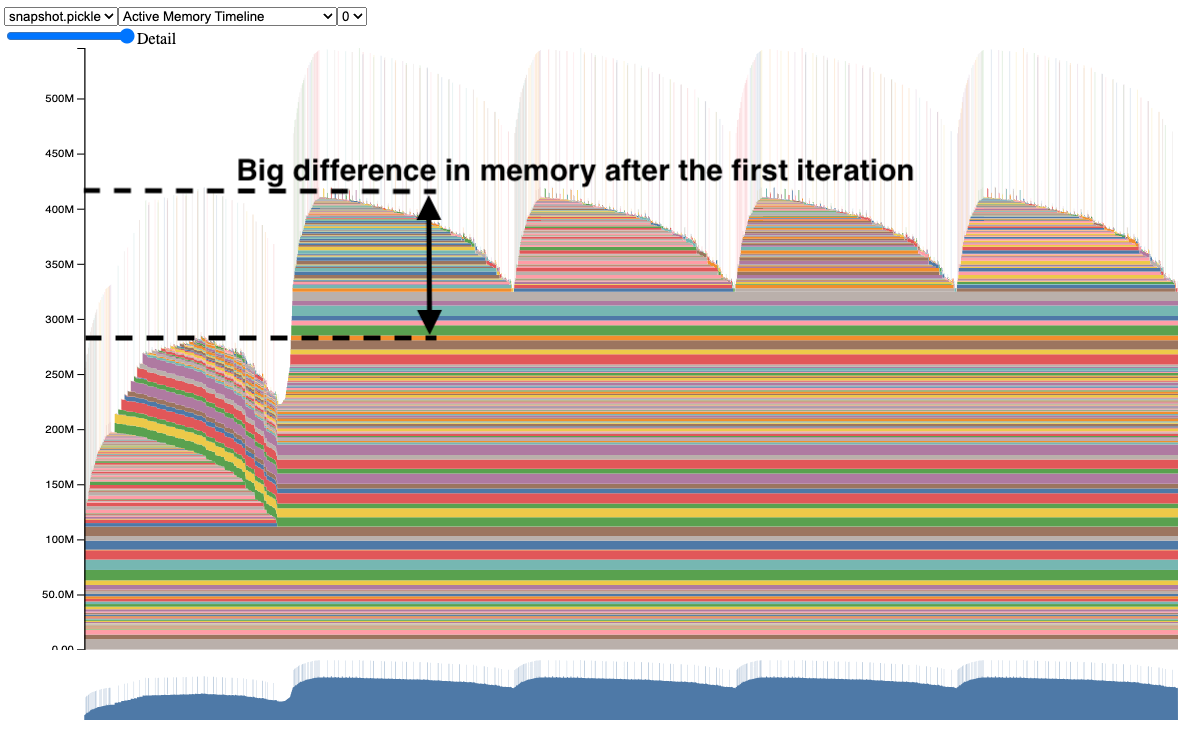
PyTorch memory allocation timeline showing allocation patterns and potential leak detection points
Memory Leak Detection That Actually Works
PyTorch has memory leaks that are well-documented in the community. The official CUDA memory management guide explains the theory, but here's what actually helps in practice when you're dealing with gradual memory growth that kills your training runs.
import torch
import gc

class MemoryTracker:
    def __init__(self):
        self.start_memory = torch.cuda.memory_allocated()

    def check_memory_leak(self, tolerance_mb=100):
        gc.collect()  # Force garbage collection
        torch.cuda.empty_cache()  # Clear PyTorch cache

        current_memory = torch.cuda.memory_allocated()
        leak_mb = (current_memory - self.start_memory) / 1024**2

        if leak_mb > tolerance_mb:
            print(f"Potential memory leak: {leak_mb:.2f}MB increase")
            return True
        return False

## Use it in your training loop
tracker = MemoryTracker()
for epoch in range(num_epochs):
    for batch in dataloader:
        loss = training_step(batch)
        loss.backward()
        optimizer.step()
        optimizer.zero_grad()

        # Check for leaks every 100 batches
        if batch_idx % 100 == 0:
            tracker.check_memory_leak()
The PyTorch profiler provides detailed memory tracking, but it's overkill for simple leak detection. The above approach catches 90% of memory issues without the complexity.
Gradient Debugging: When Backprop Goes Wrong
Gradient problems are the worst to debug because they fail silently. Your model trains but learns nothing, or worse, explodes into NaN values after 50 epochs of seemingly normal training. Here are the practical tools that actually work when gradient flow goes sideways.
Essential gradient debugging tools:
def register_gradient_hooks(model):
    """Add hooks to monitor gradient flow"""
    def hook_fn(module, grad_input, grad_output):
        if grad_output[0] is not None:
            grad_norm = grad_output[0].norm().item()
            if grad_norm > 10 or grad_norm != grad_norm:  # NaN check
                print(f"Gradient issue in {module.__class__.__name__}: norm={grad_norm}")

    for name, module in model.named_modules():
        if len(list(module.children())) == 0:  # Leaf modules only
            module.register_backward_hook(hook_fn)

## Use during training
register_gradient_hooks(model)

## Also check for dead neurons
def check_gradient_flow(named_parameters):
    ave_grads = []
    layers = []
    for n, p in named_parameters:
        if p.requires_grad and p.grad is not None:
            layers.append(n)
            ave_grads.append(p.grad.abs().mean().cpu().item())

    # Visualize gradient magnitudes
    import matplotlib.pyplot as plt
    plt.plot(ave_grads, alpha=0.3, color="b")
    plt.hlines(0, 0, len(ave_grads)+1, linewidth=1, color="k")
    plt.xticks(range(0,len(ave_grads), 1), layers, rotation="vertical")
    plt.xlim(xmin=0, xmax=len(ave_grads))
    plt.ylabel("average gradient")
    plt.title("Gradient flow")
    plt.grid(True)
    plt.show()

## Call after loss.backward()
check_gradient_flow(model.named_parameters())
![]()
PyTorch gradient debugging tools help identify vanishing/exploding gradient problems
![]()
PyTorch computational graph structure showing how operations and tensors are connected during forward pass
The Nuclear Option: Deterministic Debugging
When your model behaves differently between runs, even with the same random seed, you need deterministic mode. This is essential for reproducing bugs:
import torch
import numpy as np
import random

def set_deterministic_mode(seed=42):
    """Make PyTorch completely deterministic - slow but necessary for bug hunting"""
    torch.manual_seed(seed)
    torch.cuda.manual_seed(seed)
    torch.cuda.manual_seed_all(seed)
    np.random.seed(seed)
    random.seed(seed)

    # The nuclear option - makes everything deterministic but slow
    torch.backends.cudnn.deterministic = True
    torch.backends.cudnn.benchmark = False

    # For even more determinism (PyTorch 1.12+)
    torch.use_deterministic_algorithms(True)

## Call at the start of your debugging session
set_deterministic_mode()
Warning: This will slow down training significantly, but it's the only way to guarantee reproducible debugging sessions. Use only when hunting specific bugs.
Tensor Shape Debugging with Assertions
The most underused debugging technique in PyTorch is strategic assertions. They catch shape errors at the source instead of 20 lines later in some random linear layer:
def assert_shape(tensor, expected_shape, name="tensor"):
    """Assert tensor has expected shape with helpful error message"""
    if tensor.shape != torch.Size(expected_shape):
        raise ValueError(
            f"{name} has shape {tensor.shape}, expected {torch.Size(expected_shape)}"
        )

class DebuggableModel(nn.Module):
    def forward(self, x):
        batch_size = x.size(0)

        # Assert input shape
        assert_shape(x, (batch_size, 3, 224, 224), "input")

        features = self.backbone(x)
        assert_shape(features, (batch_size, 512), "features")

        logits = self.classifier(features)
        assert_shape(logits, (batch_size, num_classes), "logits")

        return logits
This approach catches 80% of tensor shape bugs immediately at their source. Remove the assertions once your model is stable.
The key insight: PyTorch debugging is about building visibility into the black box of tensor operations. The dynamic graph is powerful but opaque - you need to explicitly add debugging instrumentation to understand what's happening during training.