The Production Architecture Nobody Talks About

Here's the thing about PyTorch production deployments: most blog posts show you toy examples with single models and perfect conditions. Real production looks different.

The Memory Leak Nightmare

PyTorch has memory leaks in production. Not maybe, not sometimes - it has them. I've seen GPU memory leaks with torch.nn.Linear that accumulate over days until your serving crashes with OOM errors. The community pretends these don't exist, but go check GitHub issues - there are hundreds of them. The CUDA memory management documentation explains how to visualize memory allocation patterns, but doesn't solve the fundamental leak issues in long-running inference services.

PyTorch Memory Usage Over Time

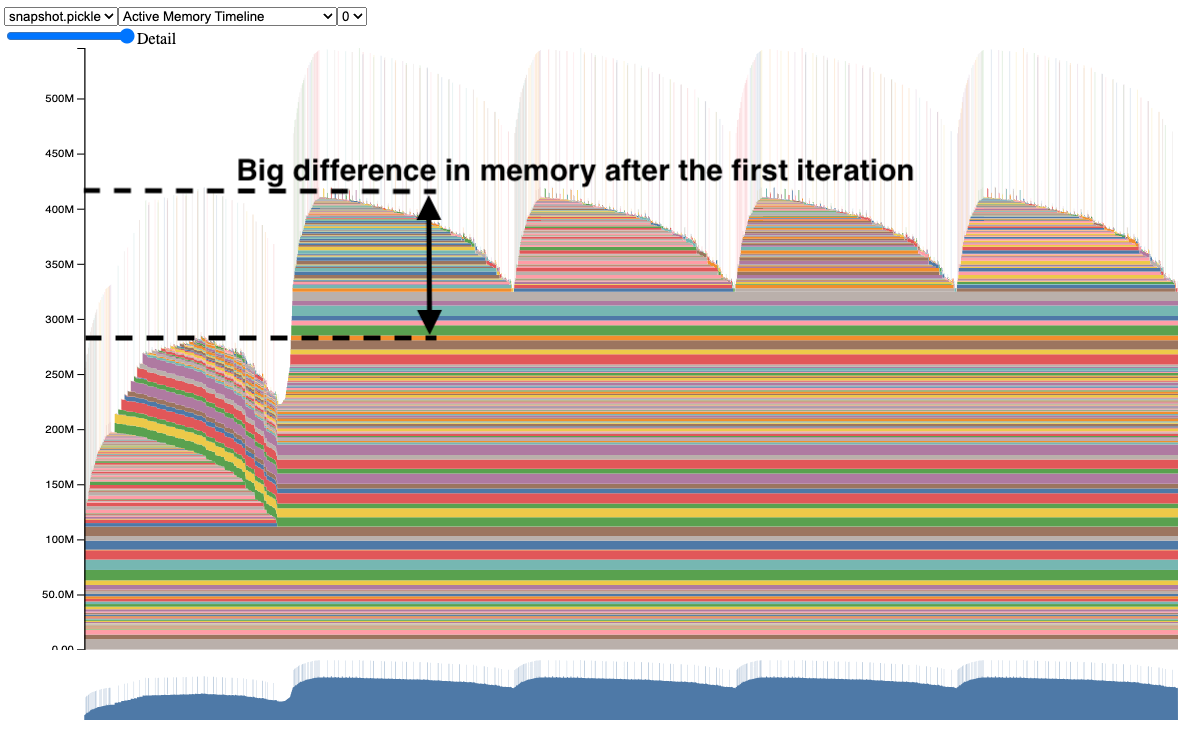
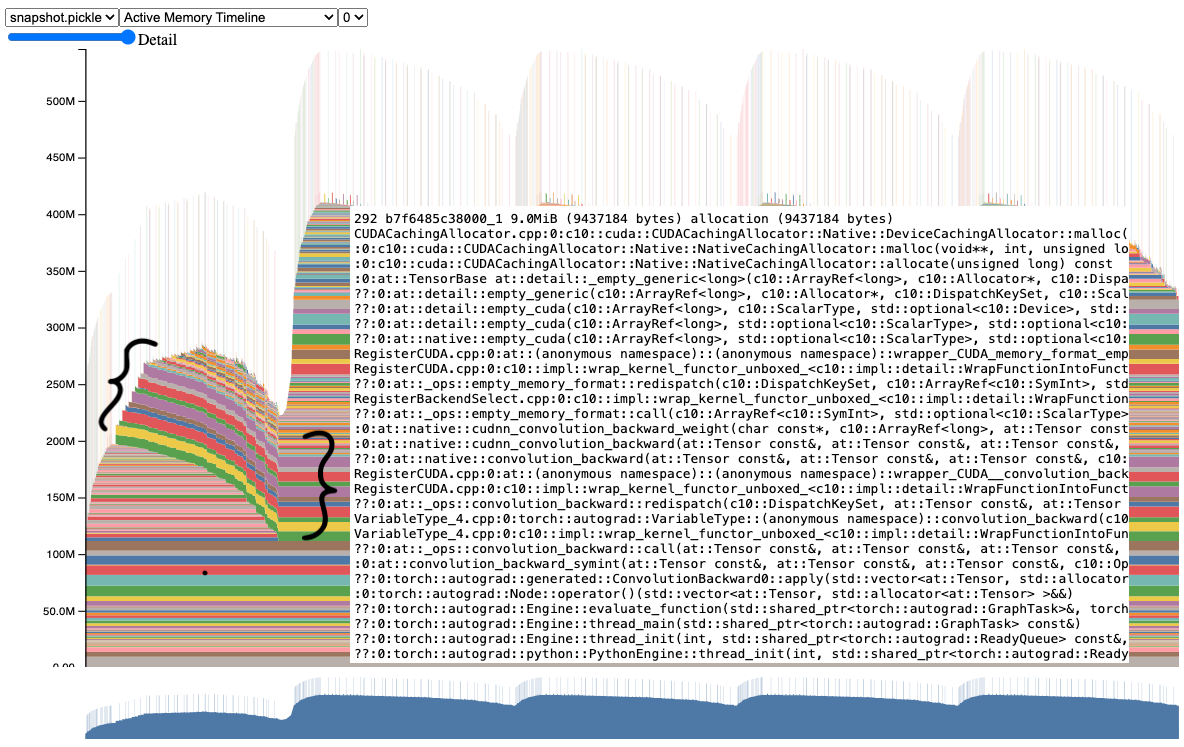
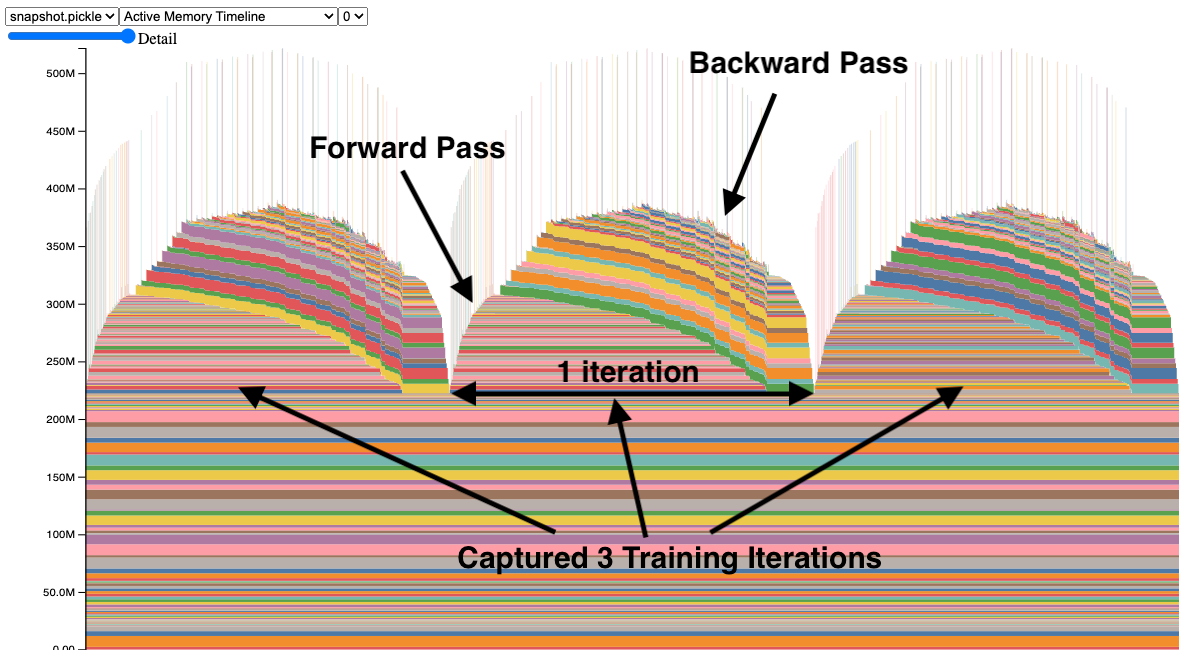
Memory profiler visualization showing GPU memory allocation over time - notice the gradual memory accumulation from leaks

The solution? Restart your workers regularly. Don't fight the memory leaks, manage them:

## This saved my production deployment
MAX_REQUESTS_PER_WORKER = 1000  
WORKER_RESTART_INTERVAL = 3600  # 1 hour

## In your serving config
gunicorn --max-requests ${MAX_REQUESTS_PER_WORKER} \
         --max-requests-jitter 100 \
         --timeout 120 app:application

TorchServe vs FastAPI: The Real Performance Numbers

Everyone debates TorchServe vs FastAPI for serving PyTorch models. I've benchmarked both extensively. The model deployment landscape in 2025 includes multiple options, and TorchServe remains a popular choice for PyTorch-specific serving workflows:

TorchServe is better for:

  • Multi-model serving (version management, A/B testing)
  • Built-in batching and auto-scaling
  • Model archiving and deployment workflows

FastAPI is better for:

  • Simple single-model serving
  • Custom preprocessing/postprocessing
  • Debugging (you can actually step through the code)
  • Lower latency for simple models (50-100ms faster)

TorchServe vs FastAPI Performance

Performance comparison showing TorchServe vs FastAPI latency and throughput under different load conditions

In practice, I use FastAPI for prototypes and simple models, TorchServe for complex multi-model production setups. Don't use TorchServe unless you need its specific features - the complexity isn't worth it for basic serving.

torch.compile in Production: When It Helps vs When It Hurts

torch.compile can give you 1.5-2x speedups, but it comes with production gotchas:

The Good:

  • Real speedups for transformer models (I've seen 40% faster inference)
  • Works well with static input shapes
  • Reduces memory usage for some models

The Bad:

  • Compilation happens on first inference (cold start penalty)
  • Breaks debugging completely (issue #97224)
  • Memory usage can actually increase with dynamic shapes
  • Compilation errors are cryptic as hell
## Production pattern: compile after warmup
@torch.no_grad()
def load_and_warmup_model():
    model = MyModel()
    model.load_state_dict(torch.load('model.pth'))
    model.eval()
    
    # Warmup with expected input shape
    dummy_input = torch.randn(1, 3, 224, 224)
    for _ in range(10):  # Warmup runs
        _ = model(dummy_input)
    
    # Now compile for production
    if not DEBUG_MODE:
        model = torch.compile(model, mode=\"max-autotune\")
        
    return model

Memory Optimization That Actually Works

The 7 hidden memory techniques everyone talks about are mostly academic bullshit. Here's what actually reduces memory usage in production:

1. Gradient Checkpointing (saves 30-50% memory):

from torch.utils.checkpoint import checkpoint

class CheckpointedModel(nn.Module):
    def forward(self, x):
        return checkpoint(self.heavy_layer, x)

2. Mixed Precision (halves memory usage):

## This actually works and is stable
from torch.cuda.amp import autocast

with autocast():
    output = model(input)  # Automatically uses FP16 where safe

3. Manual Memory Management (essential for long-running services):

## Call this between batches in long-running services
def cleanup_gpu_memory():
    if torch.cuda.is_available():
        torch.cuda.empty_cache()
        torch.cuda.ipc_collect()

Don't bother with activation offloading or parameter partitioning unless you're training massive models. For inference, these techniques add complexity without meaningful benefits.

PyTorch Production Optimization

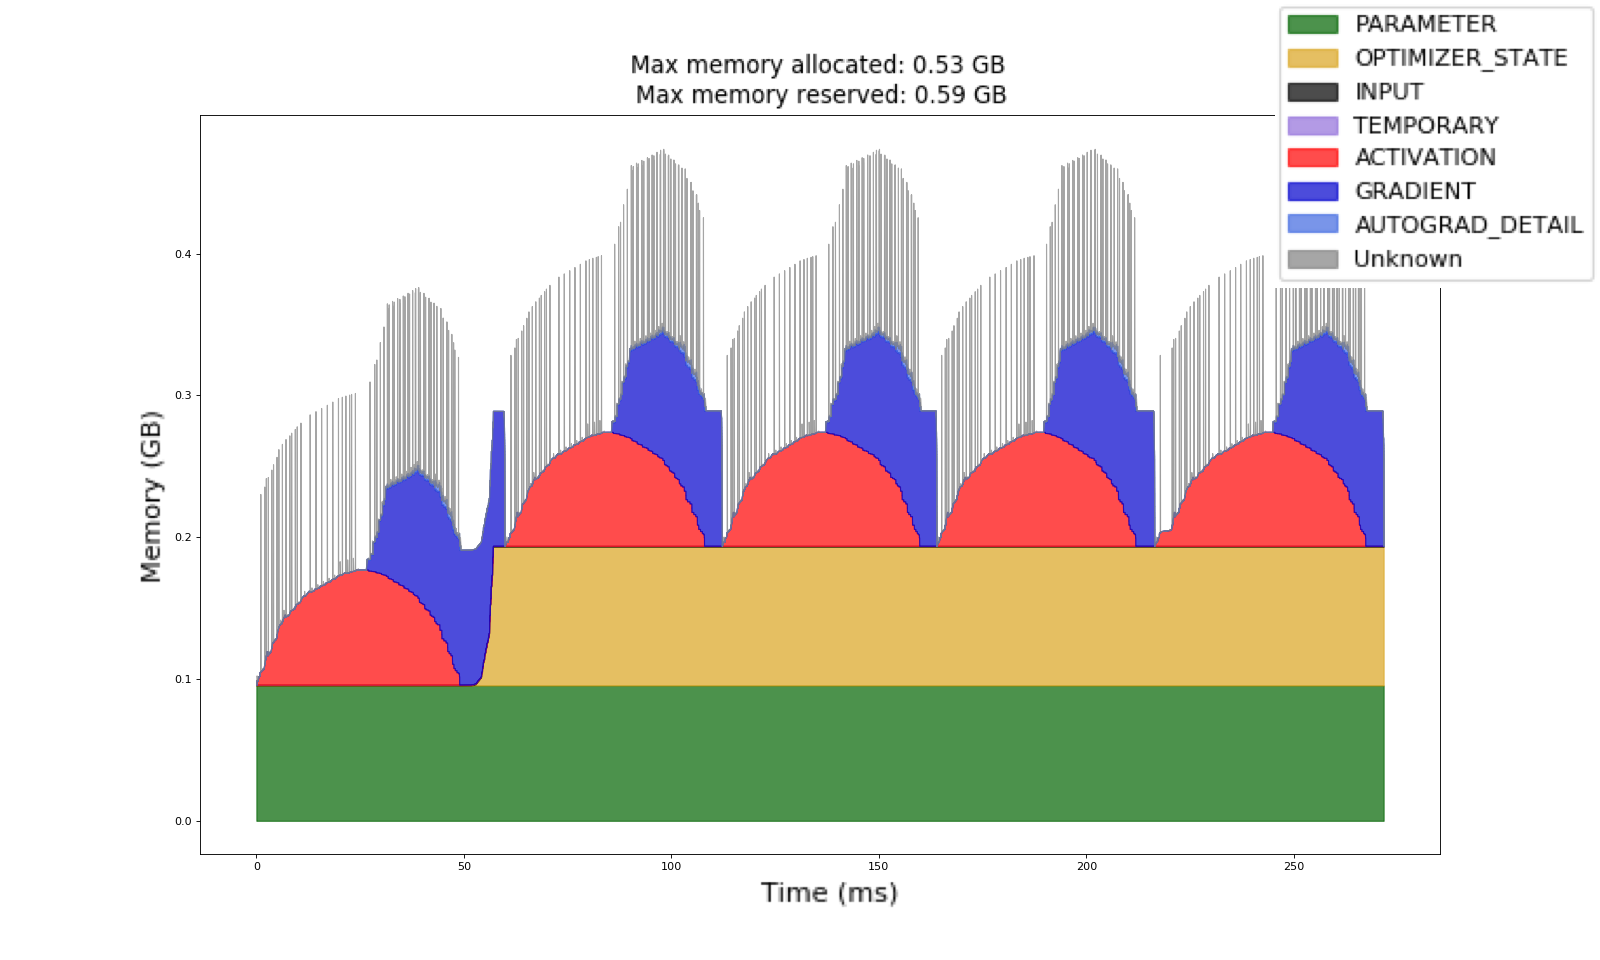
Production PyTorch optimization pipeline showing graph transformations and performance improvements

Production Deployment Problems You'll Actually Face

Q

Why does my PyTorch serving randomly crash with OOM after running fine for days?

A

Memory leaks. PyTorch accumulates memory over time, especially with MPS backend on macOS and CUDA operations. Set max-requests in your server config to restart workers before they consume all memory:

## This prevents memory leak crashes
gunicorn --max-requests 1000 --max-requests-jitter 100 app:app

Also call torch.cuda.empty_cache() between batch inferences and monitor memory usage with nvidia-smi or gpustat.

Q

Should I use torch.compile for production inference?

A

Only if you can accept the tradeoffs. I've seen 30-40% speedups on transformer models, but compilation adds 10-30 seconds to cold start time. For serving APIs where cold start matters, skip it. For batch processing where you can afford warmup time, use it.

Critical: Never use torch.compile with dynamic input shapes in production. It recompiles constantly and kills performance.

Q

How do I debug PyTorch memory usage in production?

A

Use PyTorch's built-in profiler, not external tools:

import torch.profiler

with torch.profiler.profile(
    activities=[torch.profiler.ProfilerActivity.CPU, torch.profiler.ProfilerActivity.CUDA],
    profile_memory=True,
    record_shapes=True
) as prof:
    output = model(input)

print(prof.key_averages().table(sort_by="cuda_memory_usage", row_limit=10))

This shows exactly which operations consume GPU memory. I've found memory leaks in custom layers this way.

GPU Memory Profiling

PyTorch memory profiler output showing GPU memory segments and allocation patterns for debugging

Q

TorchServe vs FastAPI: which should I use for production?

A

FastAPI for simple single-model serving where you need custom preprocessing or debugging capability. Response times are typically 50-100ms faster due to less overhead.

TorchServe for enterprise deployments needing model versioning, A/B testing, or serving multiple models simultaneously. The performance tuning guide shows how to optimize it properly.

I start with FastAPI and migrate to TorchServe when I need its advanced features.

Q

Why is my first inference so slow after deploying?

A

CUDA lazy initialization and torch.compile overhead. The first forward pass initializes CUDA contexts and JIT compilation. Warmup your model during startup:

@torch.no_grad() 
def warmup_model(model, input_shape, device, warmup_steps=5):
    dummy_input = torch.randn(input_shape).to(device)
    for _ in range(warmup_steps):
        _ = model(dummy_input)
    torch.cuda.synchronize()  # Ensure completion

This eliminates the 2-5 second delay on first real inference.

Q

How do I handle batch size optimization in production?

A

Dynamic batching is harder than it looks. Most production deployments use fixed batch sizes determined by memory constraints:

## Calculate max batch size for your GPU memory
def find_max_batch_size(model, input_shape, max_memory_gb=10):
    batch_size = 1
    while True:
        try:
            dummy_input = torch.randn(batch_size, *input_shape[1:])
            output = model(dummy_input)
            del dummy_input, output
            torch.cuda.empty_cache()
            batch_size *= 2
        except RuntimeError:  # OOM
            return batch_size // 2

For real-time serving, batch size 1 often gives better latency than trying to batch requests.

Q

What's the best way to deploy PyTorch models on Kubernetes?

A

Use init containers for model loading and separate containers for serving. Here's the pattern that works:

## Model loading takes time - do it once in init container
initContainers:
- name: model-loader
  image: your-model-image
  command: ['python', '-c', 'torch.jit.load(\"model.pt\")']  # Validate model loads

containers:
- name: pytorch-server  
  resources:
    limits:
      nvidia.com/gpu: 1
      memory: "16Gi"
    requests:
      memory: "8Gi"

Critical: Set memory requests/limits based on actual profiling, not guesswork. Under-provisioned memory causes OOM kills.

Q

How do I monitor PyTorch model performance in production?

A

Track these metrics, not just generic system metrics:

  • Model inference time (excluding preprocessing)
  • GPU memory utilization over time (watch for leaks)
  • CUDA kernel launch overhead (high values indicate batching issues)
  • Queue depth for batching systems

Use torch.profiler scheduled runs to catch performance regressions:

## Run profiler every 1000 requests
def conditional_profiling(step, model_fn, inputs):
    if step % 1000 == 0:
        with torch.profiler.profile(...) as prof:
            result = model_fn(inputs)
        prof.export_chrome_trace(f"profile_step_{step}.json")
    else:
        result = model_fn(inputs)
    return result
Q

Should I use quantization for production inference?

A

8-bit quantization typically gives 1.5-2x speedup with minimal accuracy loss, but it's model-dependent. Test extensively:

## Post-training quantization - easiest approach
import torch.quantization

quantized_model = torch.quantization.quantize_dynamic(
    model, {torch.nn.Linear}, dtype=torch.qint8
)

## Compare accuracy on validation set before deploying

Don't quantize if your model uses custom operations or if accuracy degradation exceeds your tolerance. The speedup isn't worth broken predictions.

PyTorch Production Serving Options: Real Performance Data

Deployment Method

Latency (P95)

Throughput

Memory Usage

Learning Curve

When to Use

FastAPI + Gunicorn

120-200ms

50-200 req/sec

2-4GB per worker

Easy

Single model, custom logic

TorchServe

150-250ms

100-500 req/sec

3-6GB per model

Moderate

Multiple models, A/B testing

ONNX Runtime

80-150ms

100-300 req/sec

1-3GB

Hard

Maximum performance

TensorRT

60-120ms

200-800 req/sec

2-5GB

Very Hard

NVIDIA GPUs only

Ray Serve

200-300ms

500-2000 req/sec

4-8GB

Moderate

Auto-scaling, distributed

Kubernetes + FastAPI

150-300ms

50-1000 req/sec

3-6GB per pod

Hard

Enterprise, scaling

Scaling and Monitoring: What Actually Breaks in Production

The hardest part about PyTorch production deployments isn't getting them working - it's keeping them working under real traffic patterns. Here's what I've learned from running PyTorch models that serve millions of requests.

The Auto-Scaling Trap

Auto-scaling PyTorch deployments is harder than it looks. Unlike stateless web services, model serving has warm-up time, memory characteristics, and batching considerations that break naive scaling approaches. The MLOps architecture patterns for 2025 emphasize the complexity of orchestrating ML workloads with Kubernetes, and traditional auto-scaling approaches don't work for ML inference services.

Kubernetes Auto-scaling Architecture

Kubernetes auto-scaling architecture for ML workloads - note the longer stabilization windows needed for PyTorch deployments

I've seen production deployments that scale pods too aggressively, leading to:

  • Cold start penalties: New pods take 30-60 seconds to warm up models
  • Memory fragmentation: Rapid scale-up/down causes GPU memory fragmentation
  • Batch optimization loss: New pods haven't optimized their batching parameters

The solution: Scale gradually with longer stabilization windows:

## Kubernetes HPA config that actually works for ML workloads
apiVersion: autoscaling/v2
kind: HorizontalPodAutoscaler
spec:
  scaleTargetRef:
    apiVersion: apps/v1
    kind: Deployment
    name: pytorch-model
  minReplicas: 2  # Always keep minimum for availability
  maxReplicas: 10
  behavior:
    scaleUp:
      stabilizationWindowSeconds: 300  # Wait 5 minutes before scaling up
      policies:
      - type: Percent
        value: 50  # Scale by 50% at most
        periodSeconds: 60
    scaleDown:
      stabilizationWindowSeconds: 600  # Wait 10 minutes before scaling down
      policies:
      - type: Percent  
        value: 25  # Scale down slowly
        periodSeconds: 120

Monitoring That Actually Helps Debug Issues

Generic system monitoring (CPU, memory, network) is useless for ML deployments. You need to monitor model-specific metrics that correlate with user-visible problems. The PyTorch profiler documentation shows how to collect performance data, but production monitoring for ML models requires specialized approaches beyond traditional APM tools.

Essential PyTorch Production Metrics:

  1. Inference latency distribution (not just averages)
  2. GPU memory usage over time (catch memory leaks early)
  3. Model loading time (detect model corruption/network issues)
  4. Batch utilization (optimization opportunity)
  5. CUDA kernel launch overhead (batching efficiency)

PyTorch Profiler Memory Visualization

PyTorch profiler showing memory allocation patterns and potential leak detection points

## Production monitoring code I actually use
import time
import psutil
import torch
from prometheus_client import Counter, Histogram, Gauge

## Metrics that matter
inference_duration = Histogram('pytorch_inference_seconds', 
                             'Time spent in model inference')
gpu_memory_used = Gauge('pytorch_gpu_memory_bytes', 
                       'GPU memory usage')  
batch_size_used = Histogram('pytorch_batch_size', 
                          'Actual batch sizes processed')
model_errors = Counter('pytorch_model_errors_total',
                      'Model inference errors', ['error_type'])

@inference_duration.time()
def monitored_inference(model, batch):
    try:
        torch.cuda.synchronize()  # Ensure GPU ops complete
        start_mem = torch.cuda.memory_allocated()
        
        result = model(batch)
        
        end_mem = torch.cuda.memory_allocated()
        gpu_memory_used.set(end_mem)
        batch_size_used.observe(len(batch))
        
        return result
    except RuntimeError as e:
        if "out of memory" in str(e):
            model_errors.labels(error_type="oom").inc()
        else:
            model_errors.labels(error_type="runtime").inc()
        raise

The Performance Regression Detection Nobody Talks About

Model performance degrades in production for reasons that have nothing to do with your code:

Set up automated regression detection:

## Performance baseline monitoring
class PerformanceBaseline:
    def __init__(self, model, sample_inputs):
        self.model = model
        self.sample_inputs = sample_inputs
        self.baseline_times = self._establish_baseline()
    
    def _establish_baseline(self):
        times = []
        for _ in range(100):  # 100 runs for statistical significance
            start = time.time()
            with torch.no_grad():
                _ = self.model(random.choice(self.sample_inputs))
            torch.cuda.synchronize()
            times.append(time.time() - start)
        return np.percentile(times, [50, 95])  # median, P95
    
    def check_regression(self, current_times):
        current_p95 = np.percentile(current_times, 95)
        baseline_p95 = self.baseline_times[1]
        
        if current_p95 > baseline_p95 * 1.2:  # 20% regression threshold
            alert_performance_regression(current_p95, baseline_p95)

Disaster Recovery for ML Deployments

Traditional backup strategies don't work for ML services. Model files are large, loading is slow, and you need to maintain consistency between model versions and serving code. The evolution of model inference patterns shows how deployment strategies have changed, and modern MLOps platforms emphasize the importance of proper disaster recovery planning for production ML services.

Here's what actually works:

  1. Model Versioning with Rollback: Keep the last 3 working model versions
  2. Gradual Rollouts: Never deploy to all replicas simultaneously
  3. Health Check Sophistication: Test actual inference, not just HTTP responses
  4. Circuit Breaker Pattern: Fail gracefully when models error
## Circuit breaker for model inference
class ModelCircuitBreaker:
    def __init__(self, failure_threshold=5, recovery_timeout=60):
        self.failure_count = 0
        self.failure_threshold = failure_threshold
        self.last_failure_time = None
        self.recovery_timeout = recovery_timeout
        self.state = "CLOSED"  # CLOSED, OPEN, HALF_OPEN
        
    def call_model(self, model, inputs):
        if self.state == "OPEN":
            if time.time() - self.last_failure_time > self.recovery_timeout:
                self.state = "HALF_OPEN"
            else:
                raise Exception("Circuit breaker OPEN - model unavailable")
        
        try:
            result = model(inputs)
            if self.state == "HALF_OPEN":
                self.reset()  # Recovery successful
            return result
        except Exception as e:
            self.record_failure()
            raise
            
    def record_failure(self):
        self.failure_count += 1
        self.last_failure_time = time.time()
        if self.failure_count >= self.failure_threshold:
            self.state = "OPEN"

The key insight: ML deployments fail differently than web services. Plan for GPU memory exhaustion, model corruption, and inference quality degradation - not just network connectivity issues. Understanding PyTorch's deployment patterns and performance profiling techniques is essential for production reliability.

Production Monitoring Dashboard

Production PyTorch monitoring dashboard showing GPU memory usage, inference latency, and error rates over time

Production PyTorch Resources That Actually Help

Related Tools & Recommendations

tool
Recommended

TensorFlow Serving Production Deployment - The Shit Nobody Tells You About

Until everything's on fire during your anniversary dinner and you're debugging memory leaks at 11 PM

TensorFlow Serving
/tool/tensorflow-serving/production-deployment-guide
73%
integration
Recommended

PyTorch ↔ TensorFlow Model Conversion: The Real Story

How to actually move models between frameworks without losing your sanity

PyTorch
/integration/pytorch-tensorflow/model-interoperability-guide
73%
tool
Recommended

TensorFlow - End-to-End Machine Learning Platform

Google's ML framework that actually works in production (most of the time)

TensorFlow
/tool/tensorflow/overview
73%
tool
Recommended

CUDA Development Toolkit 13.0 - Still Breaking Builds Since 2007

NVIDIA's parallel programming platform that makes GPU computing possible but not painless

CUDA Development Toolkit
/tool/cuda/overview
66%
tool
Recommended

CUDA Performance Optimization - Making Your GPU Actually Fast

From "it works" to "it screams" - a systematic approach to CUDA performance tuning that doesn't involve prayer

CUDA Development Toolkit
/tool/cuda/performance-optimization
66%
tool
Recommended

CUDA Production Debugging - When Your GPU Code Breaks at 3AM

The real-world guide to fixing CUDA crashes, memory errors, and performance disasters before your boss finds out

CUDA Development Toolkit
/tool/cuda/debugging-production-issues
66%
tool
Recommended

Hugging Face Inference Endpoints - Skip the DevOps Hell

Deploy models without fighting Kubernetes, CUDA drivers, or container orchestration

Hugging Face Inference Endpoints
/tool/hugging-face-inference-endpoints/overview
66%
tool
Recommended

Hugging Face Inference Endpoints Cost Optimization Guide

Stop hemorrhaging money on GPU bills - optimize your deployments before bankruptcy

Hugging Face Inference Endpoints
/tool/hugging-face-inference-endpoints/cost-optimization-guide
66%
tool
Recommended

Hugging Face Inference Endpoints Security & Production Guide

Don't get fired for a security breach - deploy AI endpoints the right way

Hugging Face Inference Endpoints
/tool/hugging-face-inference-endpoints/security-production-guide
66%
troubleshoot
Recommended

Docker Won't Start on Windows 11? Here's How to Fix That Garbage

Stop the whale logo from spinning forever and actually get Docker working

Docker Desktop
/troubleshoot/docker-daemon-not-running-windows-11/daemon-startup-issues
66%
howto
Recommended

Stop Docker from Killing Your Containers at Random (Exit Code 137 Is Not Your Friend)

Three weeks into a project and Docker Desktop suddenly decides your container needs 16GB of RAM to run a basic Node.js app

Docker Desktop
/howto/setup-docker-development-environment/complete-development-setup
66%
news
Recommended

Docker Desktop's Stupidly Simple Container Escape Just Owned Everyone

integrates with Technology News Aggregation

Technology News Aggregation
/news/2025-08-26/docker-cve-security
66%
tool
Recommended

MLflow - Stop Losing Your Goddamn Model Configurations

Experiment tracking for people who've tried everything else and given up.

MLflow
/tool/mlflow/overview
60%
tool
Recommended

MLflow Production Troubleshooting Guide - Fix the Shit That Always Breaks

When MLflow works locally but dies in production. Again.

MLflow
/tool/mlflow/production-troubleshooting
60%
tool
Recommended

Google Kubernetes Engine (GKE) - Google's Managed Kubernetes (That Actually Works Most of the Time)

Google runs your Kubernetes clusters so you don't wake up to etcd corruption at 3am. Costs way more than DIY but beats losing your weekend to cluster disasters.

Google Kubernetes Engine (GKE)
/tool/google-kubernetes-engine/overview
60%
troubleshoot
Recommended

Fix Kubernetes Service Not Accessible - Stop the 503 Hell

Your pods show "Running" but users get connection refused? Welcome to Kubernetes networking hell.

Kubernetes
/troubleshoot/kubernetes-service-not-accessible/service-connectivity-troubleshooting
60%
integration
Recommended

Jenkins + Docker + Kubernetes: How to Deploy Without Breaking Production (Usually)

The Real Guide to CI/CD That Actually Works

Jenkins
/integration/jenkins-docker-kubernetes/enterprise-ci-cd-pipeline
60%
tool
Recommended

Amazon SageMaker - AWS's ML Platform That Actually Works

AWS's managed ML service that handles the infrastructure so you can focus on not screwing up your models. Warning: This will cost you actual money.

Amazon SageMaker
/tool/aws-sagemaker/overview
60%
pricing
Popular choice

What It Actually Costs to Choose Rust vs Go

I've hemorrhaged money on Rust hiring at three different companies. Here's the real cost breakdown nobody talks about.

Rust
/pricing/rust-vs-go/total-cost-ownership-analysis
57%
tool
Popular choice

Thunder Client Migration Guide - Escape the Paywall

Complete step-by-step guide to migrating from Thunder Client's paywalled collections to better alternatives

Thunder Client
/tool/thunder-client/migration-guide
55%

Recommendations combine user behavior, content similarity, research intelligence, and SEO optimization