The Reality of ServiceNow's Lightstep Acquisition

ServiceNow acquired Lightstep for $512 million in 2021 and immediately started turning decent startup tech into expensive enterprise bullshit. Lightstep was actually a decent distributed tracing platform built by some smart people who understood the pain of debugging microservices at scale. The acquisition details show ServiceNow's strategic push into the rapidly growing observability market, but now it's been absorbed into ServiceNow's enterprise machine.

Distributed Tracing Flow

What Actually Works (The Lightstep Legacy)

The core distributed tracing is still solid. When you have 50+ microservices and your checkout flow dies at 2 AM, this thing can actually help you figure out which service is the culprit. The intelligent sampling isn't just marketing bullshit - it really does prioritize error traces and slow requests over the boring successful ones.

Real Example: I've seen teams track down a timeout issue that was happening in 0.1% of requests across 12 different services. Without proper distributed tracing fundamentals, that's a needle-in-haystack nightmare. With ServiceNow Cloud Observability, you can actually see the full request path and identify that one service that's occasionally taking 30 seconds to respond.

The change intelligence is also genuinely useful. It correlates deployments with performance changes, which sounds obvious but most observability tools suck at this. When your latency spikes 200ms after a deployment, it'll actually show you the correlation between changes and incidents instead of making you guess.

The ServiceNow Tax in Action

The three pillars of observability (metrics, logs, and traces) all come at enterprise pricing when bundled with ServiceNow's platform.

Here's where reality hits you in the face: pricing starts at $275/month with no free tier. Compare that to New Relic's 100GB free tier or Grafana Cloud's generous free plan and you can see the enterprise premium in action.

The real kicker? You don't get the full value unless you're already paying for ServiceNow ITSM. The integration with ServiceNow's incident management is legitimately good - when a trace shows an error, it can automatically create a ServiceNow ticket with all the context. But if you're not in the ServiceNow ecosystem already, you're paying premium prices for features you can't use.

When It Actually Makes Sense

Don't buy this for a simple Node.js app with 3 services. You need real complexity - think 20+ services, multiple teams, production traffic that would make sampling mandatory anyway. The intelligence in their sampling algorithm shines when you're dealing with millions of traces per day and need to keep costs reasonable.

If you're already a ServiceNow shop with ITSM and the works, then the integration story is compelling. Your observability data flows directly into your incident management process, which can significantly reduce the time between "something's broken" and "engineer is looking at the right data."

Otherwise? Grafana Cloud will do 90% of what you need for a fraction of the cost, and Datadog has more features if you can stomach their equally ridiculous pricing.

Bottom line: Great distributed tracing tech buried under ServiceNow's sales hell and enterprise pricing. The Lightstep team knew what they were doing, but now you need to justify $3,300/year to your CFO instead of just spinning up a free tier.

How ServiceNow Cloud Observability Stacks Up (Real Talk)

What You Actually Care About

ServiceNow Cloud Observability

Datadog

New Relic

Dynatrace

Grafana Cloud

Monthly Cost Reality

$275+/month

  • no free tier

$15/host

  • adds up fast

100GB free, then expensive

Custom = "call for quote" = expensive

Generous free tier

Distributed Tracing Quality

🔥 Actually excellent (Lightstep DNA)

👍 Good enough for most

👍 Solid, well-integrated

🔥 PurePath is impressive

👌 Basic but functional

How Much Setup Pain

Low if ServiceNow shop, high otherwise

Medium

  • lots of config options

Low

  • good auto-discovery

Very low

  • AI does the work

High

  • DIY everything

When Production Breaks

Great for microservice hell

Swiss army knife approach

Solid APM, weaker infra

Finds problems you didn't know existed

You better know what you're doing

Will Your CFO Approve It

Only if already paying ServiceNow

Prepare for sticker shock

Most reasonable of the "big" options

Enterprise budgets only

Developers will love you

Free Trial

Nope

  • sales demo only

14 days

100GB/month forever

15 days

Actually free

What Actually Happens When You Implement This

Here's the reality of rolling out ServiceNow Cloud Observability, without the marketing bullshit.

The OpenTelemetry Setup (Actually Pretty Good)

OpenTelemetry Components

ServiceNow Cloud Observability uses OpenTelemetry, which means you're not completely locked into their ecosystem. This is one of the few things they got right. The OpenTelemetry ecosystem provides standardized instrumentation across languages and frameworks, making the tool more future-proof than proprietary vendor-specific agents.

Auto-instrumentation works...mostly: For Java Spring Boot and Node.js Express apps, the auto-instrumentation is solid. Drop in the agent, set a few environment variables, and you're getting traces. But if you're running anything exotic (Rust microservices, custom C++ stuff, weird Python frameworks), you'll be writing custom instrumentation.

Real implementation time: Plan for 2-4 weeks to get meaningful data flowing, not the "30 minutes" their sales demo shows. You'll need to:

Gotcha that will bite you: The default sampling rates will murder your budget. Start conservative (like 1% sampling) and tune up from there. I've seen teams get a $5,000 surprise bill because they were sampling everything at 100% for two weeks.

ServiceNow Integration (If You're Already Paying Them)

Distributed Tracing Spans

Distributed tracing visualizes request flows across microservices, showing exactly where failures occur in complex architectures.

The ITSM integration is legitimately good if you're already a ServiceNow shop. When a trace shows an error rate spike, it can automatically create an incident with:

  • The actual trace data showing which service failed
  • Performance baselines so you know how bad things are
  • Correlation with recent deployments from ServiceNow's change management

This actually works and can save you hours during outages. But it's completely useless if you're not already using ServiceNow for incident management.

The Real Implementation Pain Points

Enterprise Sales Process: You can't just sign up and start using it like a normal human being. Everything goes through enterprise sales, which means demo calls, 'discovery sessions', procurement bullshit, and contracts that require a lawyer to read. Budget 2-3 months from "let's try this" to "we have working access."

Data retention costs creep up: They don't emphasize this in sales calls, but trace storage adds up fast. The intelligent sampling helps, but you'll still pay more for retention than you expect. Budget for at least 2x what they quote for "production usage."

Kubernetes Observability

Kubernetes observability requires monitoring across pods, services, nodes, and the control plane - a complex architecture that benefits from proper instrumentation.

Kubernetes support is solid but not magical: The Kubernetes integration works well with standard deployments, but if you're doing anything creative with service meshes or custom networking, expect to spend time debugging why traces aren't connected properly.

What Works in Production

Change intelligence is genuinely useful: When your API latency suddenly jumps from 100ms to 400ms, and it correlates with a deployment from 20 minutes ago, that saves hours of investigation. This feature alone has justified the cost for teams I've worked with.

Intelligent sampling doesn't suck: Unlike naive random sampling that might miss your rare but critical error cases, their algorithm actually captures the traces you need for debugging while keeping costs reasonable.

Performance impact is minimal: The OpenTelemetry agents don't noticeably impact application performance, even under high load. This isn't always true with other observability tools.

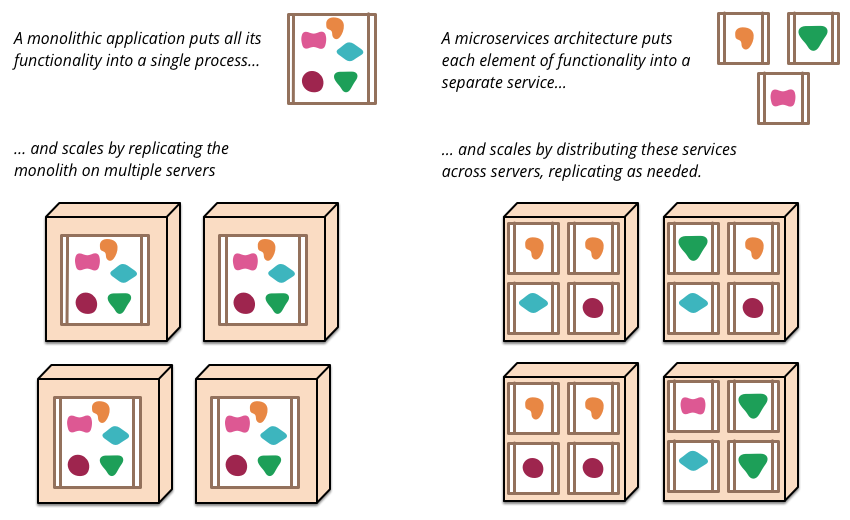
Microservices Architecture
Complex microservice architectures are exactly where ServiceNow Cloud Observability shines - and where the cost actually becomes justified.

When Implementation Goes Wrong

Common failure modes I've seen:

  1. "We set everything to 100% sampling" - Bill shock in month 2
  2. "Our custom service names are inconsistent" - Traces that don't connect properly
  3. "We didn't configure proper error handling" - Missing traces when things actually break
  4. "We assumed all our services were supported" - Manual instrumentation takes 10x longer than expected

The Migration Reality

If you're moving from Jaeger or Zipkin, the migration is pretty smooth thanks to OpenTelemetry. If you're coming from Datadog or New Relic, expect to rewrite your dashboards and alerts. The data model is different enough that you can't just port everything over.

Bottom line: It's good tech with enterprise complexity. If you have the budget and already deal with ServiceNow's enterprise processes, it works well. If you're a small team looking for simple observability, Grafana Cloud will be way less painful to set up and use.

Questions People Actually Ask

Q

Why is this so damn expensive?

A

*Enterprise software pricing reality: when a good startup gets acquired, expect the prices to reflect enterprise "value".*Because ServiceNow bought a startup and decided to milk it. Pricing starts at $275/month with no free tier. Compare that to New Relic's 100GB free or Grafana's generous free plan. You're paying the "enterprise tax" for ServiceNow's brand and sales process.

Q

Is this worth it if I'm not already using ServiceNow?

A

Probably not.

The real value comes from integration with Service

Now ITSM

  • automatic incident creation, change correlation, etc. Without that, you're paying premium prices for distributed tracing that Jaeger can do for free (with more setup work).
Q

Will this break my production when I install it?

A

The OpenTelemetry agents are pretty lightweight, but the gotcha is sampling configuration. If you accidentally sample 100% of your traces, you'll either get a massive bill or hit rate limits that could affect your app. Start at 1% sampling and work up.

Q

What happened to the original Lightstep team?

A

ServiceNow acquired Lightstep for $512M in 2021. Some of the team stayed, some left. The core tech is still solid, but now it's wrapped in enterprise sales processes and ServiceNow branding.

Q

Can I just try this without talking to sales?

A

Nope. There's no free trial, no self-signup. Everything goes through enterprise sales, which means demo calls, procurement processes, and contracts. Budget 2-3 months from interest to actually using it.

Q

Does the intelligent sampling actually work or is it marketing bullshit?

A

It actually works. Unlike random sampling that might miss your rare but critical errors, their algorithm prioritizes error traces and slow requests. It's one of the few features that lives up to the hype. But you still need to configure it properly.

Q

How long does implementation actually take?

A

Sales will say "30 minutes." Reality is 2-4 weeks to get meaningful data. You need to:

  • Configure sampling rates that won't bankrupt you
  • Set up service naming conventions
  • Debug why some traces are incomplete
  • Train your team on the new interface
Q

Is the Kubernetes support any good?

A

It's solid for standard deployments. Auto-discovery works well, and the service mesh integration (especially with Istio) is good. But if you're doing anything creative with networking or have custom operators, expect some debugging time.

Q

Should I choose this over Datadog/New Relic?

A

Choose ServiceNow Cloud Observability if: You're already a ServiceNow shop, need serious distributed tracing, and budget isn't a concern.

Choose New Relic if: You want balance of features vs cost, like the free tier, and don't need deep ServiceNow integration.

Choose Datadog if: You want comprehensive monitoring across everything, have a big budget, and like their interface.

Choose Grafana Cloud if: You know your shit, want to save money, and don't mind some setup work.

Q

What breaks when you migrate from other tools?

A

If you're coming from Jaeger/Zipkin, migration is smooth thanks to OpenTelemetry. From Datadog/New Relic, expect to rebuild dashboards and alerts. The data models are different enough that you can't just port everything.

Q

Any gotchas that will bite me in production?

A
  • Sampling rate mistakes: Start conservative or face bill shock
  • Service naming inconsistency: Traces won't connect properly
  • Missing error handling: Traces disappear when you need them most
  • Storage costs: They creep up faster than you expect, budget 2x their quote
Q

Is there actual competition or is this all the same shit?

A

The distributed tracing space has real differences:

  • ServiceNow: Best intelligent sampling, expensive, enterprise sales
  • Datadog: Swiss army knife, also expensive, better infra monitoring
  • New Relic: Most reasonable pricing, good enough for most teams
  • Grafana: Actually free option if you can handle the complexity
  • Jaeger/Zipkin: Open source, you run it, you fix it when it breaks

Bottom line: ServiceNow Cloud Observability is good tech strangled by enterprise pricing and bureaucratic sales hell. Most teams would be better served by New Relic's free tier until they actually need the advanced features.

Actually Useful Resources (That Work)

Related Tools & Recommendations

integration
Similar content

OpenTelemetry, Jaeger, Grafana, Kubernetes: Observability Stack

Stop flying blind in production microservices

OpenTelemetry
/integration/opentelemetry-jaeger-grafana-kubernetes/complete-observability-stack
100%
howto
Similar content

Set Up Microservices Observability: Prometheus & Grafana Guide

Stop flying blind - get real visibility into what's breaking your distributed services

Prometheus
/howto/setup-microservices-observability-prometheus-jaeger-grafana/complete-observability-setup
79%
tool
Similar content

OpenTelemetry Overview: Observability Without Vendor Lock-in

Because debugging production issues with console.log and prayer isn't sustainable

OpenTelemetry
/tool/opentelemetry/overview
59%
tool
Similar content

Jaeger: Distributed Tracing for Microservices - Overview

Stop debugging distributed systems in the dark - Jaeger shows you exactly which service is wasting your time

Jaeger
/tool/jaeger/overview
59%
tool
Similar content

Datadog Enterprise Deployment Guide: Control Costs & Sanity

Real deployment strategies from engineers who've survived $100k+ monthly Datadog bills

Datadog
/tool/datadog/enterprise-deployment-guide
54%
tool
Similar content

Datadog Monitoring: Features, Cost & Why It Works for Teams

Finally, one dashboard instead of juggling 5 different monitoring tools when everything's on fire

Datadog
/tool/datadog/overview
51%
tool
Similar content

Datadog Cost Management Guide: Optimize & Reduce Your Monitoring Bill

Master Datadog costs with our guide. Understand pricing, billing, and implement proven strategies to optimize spending, prevent bill spikes, and manage your mon

Datadog
/tool/datadog/cost-management-guide
47%
tool
Similar content

Elastic Observability: Reliable Monitoring for Production Systems

The stack that doesn't shit the bed when you need it most

Elastic Observability
/tool/elastic-observability/overview
45%
tool
Similar content

New Relic Overview: App Monitoring, Setup & Cost Insights

New Relic tells you when your apps are broken, slow, or about to die. Not cheap, but beats getting woken up at 3am with no clue what's wrong.

New Relic
/tool/new-relic/overview
44%
tool
Similar content

ServiceNow App Engine - Build Apps Without Coding Much

ServiceNow's low-code platform for enterprises already trapped in their ecosystem

ServiceNow App Engine
/tool/servicenow-app-engine/overview
41%
alternatives
Similar content

Best OpenTelemetry Alternatives & Migration Ready Tools

I spent last Sunday fixing our collector again. It ate 6GB of RAM and crashed during the fucking football game. Here's what actually works instead.

OpenTelemetry
/alternatives/opentelemetry/migration-ready-alternatives
38%
tool
Similar content

AWS X-Ray: Distributed Tracing & 2027 Migration Strategy Guide

Explore AWS X-Ray for distributed tracing, identify slow microservices, and learn implementation tips. Prepare your 2027 migration strategy before the X-Ray sun

AWS X-Ray
/tool/aws-x-ray/overview
35%
integration
Recommended

Setting Up Prometheus Monitoring That Won't Make You Hate Your Job

How to Connect Prometheus, Grafana, and Alertmanager Without Losing Your Sanity

Prometheus
/integration/prometheus-grafana-alertmanager/complete-monitoring-integration
30%
tool
Similar content

Grafana: Monitoring Dashboards, Observability & Ecosystem Overview

Explore Grafana's journey from monitoring dashboards to a full observability ecosystem. Learn about its features, LGTM stack, and how it empowers 20 million use

Grafana
/tool/grafana/overview
28%
tool
Similar content

Prometheus Monitoring: Overview, Deployment & Troubleshooting Guide

Free monitoring that actually works (most of the time) and won't die when your network hiccups

Prometheus
/tool/prometheus/overview
28%
pricing
Similar content

Datadog, New Relic, Sentry Enterprise Pricing & Hidden Costs

Observability pricing is a shitshow. Here's what it actually costs.

Datadog
/pricing/datadog-newrelic-sentry-enterprise/enterprise-pricing-comparison
26%
tool
Similar content

Elastic APM Overview: Monitor & Troubleshoot Application Performance

Application performance monitoring that won't break your bank or your sanity (mostly)

Elastic APM
/tool/elastic-apm/overview
23%
tool
Similar content

Datadog Setup & Config Guide: Production Monitoring in One Afternoon

Get your team monitoring production systems in one afternoon, not six months of YAML hell

Datadog
/tool/datadog/setup-and-configuration-guide
23%
tool
Similar content

Datadog Security Monitoring: Good or Hype? An Honest Review

Is Datadog Security Monitoring worth it? Get an honest review, real-world implementation tips, and insights into its effectiveness as a SIEM alternative. Avoid

Datadog
/tool/datadog/security-monitoring-guide
22%
tool
Similar content

Datadog Production Troubleshooting Guide: Fix Agent & Cost Issues

Fix the problems that keep you up at 3am debugging why your $100k monitoring platform isn't monitoring anything

Datadog
/tool/datadog/production-troubleshooting-guide
22%

Recommendations combine user behavior, content similarity, research intelligence, and SEO optimization