Currently viewing the human version
Switch to AI version

I've Debugged Three Cluster-Wide Disasters (And They're All Horrible)

Cluster disasters suck. I've been through a few of them now. Middle of the night, everything was fucked. Not just some pods - the entire cluster was dead. kubectl was hanging, monitoring was dark, couldn't even SSH anywhere. Management was freaking out because we were bleeding money.

That was my introduction to cascade failures - when Kubernetes doesn't just have a problem, it has ALL the problems simultaneously. I've survived three of these disasters now, and they're uniquely horrible because all your debugging tools stop working exactly when you need them most. Oh, and 67% of organizations deal with cluster-wide outages annually - so you're not alone in this hell.

Kubernetes troubleshooting documentation covers the basics, but real cascade failures require understanding the architecture and failure modes. The SIG-Scalability group documents common failure patterns and performance limits. The disaster recovery guide explains backup strategies, while monitoring best practices help detect issues early.

The Control Plane Death Spiral (When kubectl Becomes Useless)

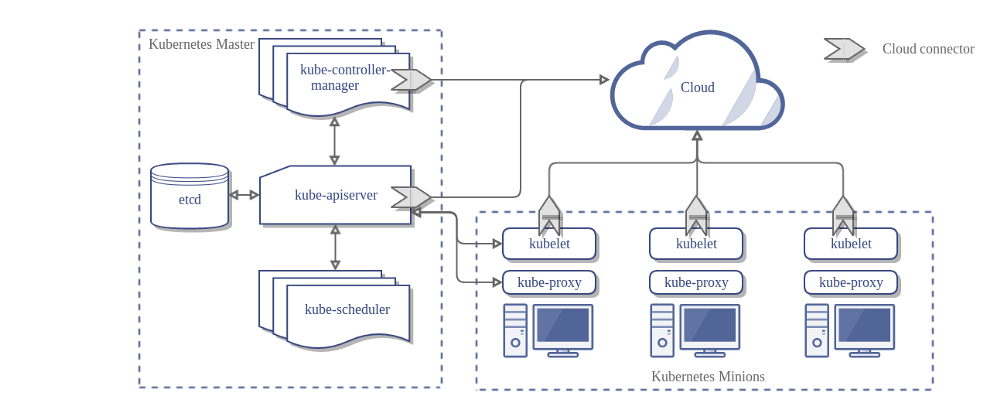
Kubernetes Architecture Diagram

When the control plane dies, all your kubectl knowledge becomes useless. I spent way too long trying to run kubectl get pods while it hung for 45+ seconds before spitting out "Unable to connect to the server: dial tcp: i/o timeout". The API server was getting hammered with 20k+ requests/second, but I didn't know that because my monitoring went dark first. This is where you realize those performance thresholds actually matter.

The API server troubleshooting guide explains timeout configurations, while etcd monitoring helps track control plane health. kubectl timeout settings and client configuration become critical during outages.

The vicious cycle that will ruin your night:

  1. Something stupid happens - A new monitoring agent, some intern's config change, or resource exhaustion hits your API server
  2. DNS shits the bed - Services can't find each other because DNS needs the control plane, but the control plane is busy dying
  3. Nodes start panicking - Kubelet can't talk to the API server, so nodes go "Not Ready" and everything goes to hell
  4. Your debugging tools abandon you - kubectl hangs, monitoring dies, and you're left staring at spinning cursors while revenue bleeds

The worst part? Your applications might be perfectly healthy, but they're isolated in their own little islands because the networking fabric fell apart. DNS can't find services, pods can't talk to each other, and everything looks broken even though the actual apps are fine.

CoreDNS troubleshooting covers DNS failures, while kubelet debugging explains node communication issues. Network policy debugging and service mesh troubleshooting help diagnose networking failures.

The OpenAI Disaster: When Observability Kills Your Cluster
Kubernetes Cluster Monitoring

OpenAI's December 2024 meltdown is every SRE's nightmare - they deployed a monitoring service that murdered their own clusters. Some genius decided to add telemetry to improve observability, but the service hammered the API server with requests that scaled with cluster size. Their huge clusters died first - I think it was like 7,500 nodes or something insane like that, maybe more, fucking massive - because the API calls scaled O(n²) and completely obliterated the control plane. Each node was making like 50+ API calls per minute, multiplied by thousands of nodes = API server death spiral.

Here's the really fucked up part: DNS caching hid the problem for a while. Everyone thought things were fine until the caches expired and suddenly nothing could resolve anything. By then, the API server was so overloaded they couldn't even rollback the deployment that caused it.

What actually happened (not the sanitized version):

  • Deploy "harmless" telemetry service across hundreds of clusters
  • Service makes expensive API calls * cluster_size (oops)
  • Large clusters die first because n² scaling is a bitch
  • DNS masks the problem for a while (false sense of security)
  • Cache expires, services can't find each other, everything dies
  • kubectl becomes useless, can't rollback the thing killing you
  • Takes hours of parallel recovery because standard tools are fucked

This is why I always test new services on tiny clusters first. Scale kills you in ways you never expect.

Circular Dependencies (The Architecture That Bites You Back)
Kubernetes Dependencies Flow

You know what makes cluster disasters extra fun? All those "clever" architectural decisions that seemed brilliant until they created circular death spirals. I learned this the hard way when our authentication service went down and took the entire service mesh with it, which prevented authentication from coming back up. Spent way too long in that deadlock - like 6 hours because Istio 1.17.x has this bug where service discovery fails silently when authentication is down.

The dependency hell that will ruin your weekend:

DNS needs the control plane, control plane needs DNS - Applications can't find services without DNS, but DNS can't resolve anything without a healthy API server. When the control plane chokes, DNS dies, and now your apps can't find the services needed to fix the control plane. It's like needing your car keys to get your car keys out of your locked car.

Monitoring dies when you need it most - Your monitoring infrastructure runs on the same cluster it's supposed to monitor. So when everything goes to hell, your dashboards go dark right when you're desperately trying to figure out what's broken. It's the most useless feature ever.

etcd and storage hate each other - etcd stores cluster state but might depend on cluster-managed storage. If storage fails, etcd can't maintain state. If etcd fails, you can't manage storage. I've seen this kill clusters for entire weekends.

Service mesh + auth = deadlock paradise - Service mesh needs authentication to secure traffic, auth service needs service mesh to communicate. When one dies, they both stay dead forever. Breaking this deadlock usually involves some ugly manual intervention.

When Scale Murders Your Cluster (Staging Never Reveals This Shit)

Kubernetes Scaling Challenges

Large clusters fail in ways that small ones never do, which is why your 50-node staging environment gives you false confidence. I learned this the hard way when we hit around 1,000 nodes, maybe more, and suddenly operations that worked perfectly at 100 nodes brought the entire control plane to its knees. Scale is a cruel mistress - especially with Kubernetes 1.25+ where watch events can overwhelm the API server at scale.

The n² death spiral - Network policies, API calls, and node communication all scale quadratically with cluster size. That monitoring service that barely registers on your 100-node cluster? It'll murder your 1,000-node cluster because it's making 10x more API calls, not just 10% more.

When 1,000 things fail simultaneously - Resource exhaustion in large clusters isn't just worse, it's catastrophic. When 1,000 nodes run out of disk space at the same time, they all scream at the API server simultaneously, creating a secondary failure that kills the control plane. It's like a DDoS attack from your own infrastructure.

Multi-region clusters are split-brain hell - Geographic distribution sounds great until network partitions happen. I've spent entire nights debugging "split-brain" scenarios where half the cluster thinks it's healthy and the other half is panicking. The recovery procedures are completely different from single-region failures and infinitely more complex.

The Warning Signs (If You're Lucky)

Most cascade failures don't just appear instantly - they give you some warning signs if you know what to look for. I missed these signs during my first disaster and regretted it.

The control plane starts choking first:

  • API response times get noticeably slow (your first real warning)
  • etcd watch latency spikes (etcd is struggling)
  • Control plane CPU/memory usage climbs rapidly
  • Scheduler and controller-manager logs start showing timeout errors

Network fabric starts getting flaky:

  • DNS queries take longer than usual
  • Pod-to-pod connections become intermittent (this drove me insane for hours)
  • Service discovery fails sporadically
  • CNI logs fill with network policy errors

Everything runs out of resources simultaneously:

  • Multiple nodes hit resource limits at once (not just one or two)
  • PVCs start pending across namespaces
  • Ingress controllers can't reach upstream services
  • Image pulls timeout cluster-wide (this is when you know you're fucked)

How to Not Panic (And Avoid Making It Worse)

When everything's on fire, your brain wants to try every fix at once. Don't. I've seen smart engineers turn a 2-hour outage into an 8-hour disaster by panicking.

Shit that makes outages worse:

  • Multiple people making changes without talking (coordination hell)
  • Throwing more resources at the problem without understanding it (expensive and useless)
  • Making rapid config changes without waiting to see results (thrashing)
  • Switching between recovery approaches every 5 minutes (start over hell)

What actually works when you're stressed:

  • One person calls the shots, everyone else follows orders
  • Follow the runbook even when it feels slow (improvisation kills you)
  • Parallel teams work on different problems (not the same problem)
  • Updates every 15 minutes with actual status, not technical details that confuse management

Now that you understand how cluster disasters unfold and what warning signs to watch for, the next section covers what to actually do when kubectl stops working and you need to debug a cluster that's actively dying. Because understanding the theory is one thing - having commands that work at 3AM when everything's broken is what separates experienced engineers from those who panic.

What to Actually Run When kubectl Is Dead (Your 3AM Survival Guide)

Here's the harsh reality: when your cluster is having a cascade failure, all that kubectl knowledge becomes worthless. Commands hang for minutes, your fancy monitoring is dark, and you're sitting there at 3AM with a completely unresponsive cluster wondering what the fuck to do next.

I've been there. Multiple times. Here are the commands that actually work when everything else is broken - learned through painful trial and error during real outages where I was scrambling to fix shit while management was breathing down my neck.

Emergency troubleshooting guides and disaster recovery procedures become essential references. Direct etcd operations and systemd troubleshooting replace normal kubectl workflows. SSH troubleshooting techniques and direct container runtime debugging become your primary tools.

Step 1: Is the Control Plane Even Alive? (30 Second Test)

Don't waste time with kubectl when you don't even know if the API server is responsive. Test the basics first:

## The most important command you'll run - can you even reach the API server?
curl -k https://kubernetes.io/docs/reference/using-api/health-checks/
## If this takes more than 5 seconds or times out, you're fucked
## Should return \"ok\" if there's any hope

## Time the response to see how bad the overload is
time curl -k https://kubernetes.io/docs/reference/kubernetes-api/cluster-resources/namespace-v1/
## Takes 2.3s on my M1 Mac normally, >5 seconds = severe overload, >30 seconds = might as well be dead

Step 2: Emergency kubectl Settings (When You're Desperate)

If the API server is technically alive but slow as molasses, configure kubectl to not hang forever:

## Set timeouts so kubectl doesn't waste your entire night
export KUBECONFIG=/path/to/kubeconfig
export KUBECTL_TIMEOUT=10s

## Quick and dirty cluster status - how many nodes do we think we have?
timeout 30s kubectl get nodes --no-headers 2>/dev/null | wc -l
## If this returns 0 or hangs with \"Waiting for server response\", kubectl is useless tonight

## Are the control plane pods even running?
timeout 15s kubectl get pods -n kube-system --no-headers | grep -E \"(api|etcd|scheduler|controller)\" | grep Running
## If nothing shows up, you're debugging control plane death

Step 3: SSH to Nodes (When kubectl Abandons You)

If kubectl is useless, time to get dirty with direct node access. This is where real debugging happens:

## SSH to a control plane node (pray it's still reachable)
ssh control-plane-node

## Is kubelet even alive? This tells you if nodes can talk to API server
systemctl status kubelet
## If kubelet is failing, that's your smoking gun

## Check the last few minutes of kubelet logs for the real story
journalctl -u kubelet --since \"5 minutes ago\" | grep -E \"(ERROR|WARN)\" | tail -20
## Look for \"connection refused\", \"x509: certificate has expired\", \"no space left on device\"
## Also watch for \"failed to create pod sandbox\" and \"cgroup: no such file or directory\" - means nodes are fucked

## Test etcd directly (the nuclear option)
etcdctl endpoint health --endpoints=https://127.0.0.1:2379 \
  --cacert=/etc/kubernetes/pki/etcd/ca.crt \
  --cert=/etc/kubernetes/pki/etcd/server.crt \
  --key=/etc/kubernetes/pki/etcd/server.key
## If etcd is unhappy, your entire cluster state is fucked

## The quick \"is this node dying?\" check
df -h | grep -E \"(9[0-9]%|100%)\"  # Any filesystems >90% full?
free -h | grep Mem                # How much memory is left?
uptime                            # Load average over 5-10 is bad news

Figure Out Which Type of Disaster You're In

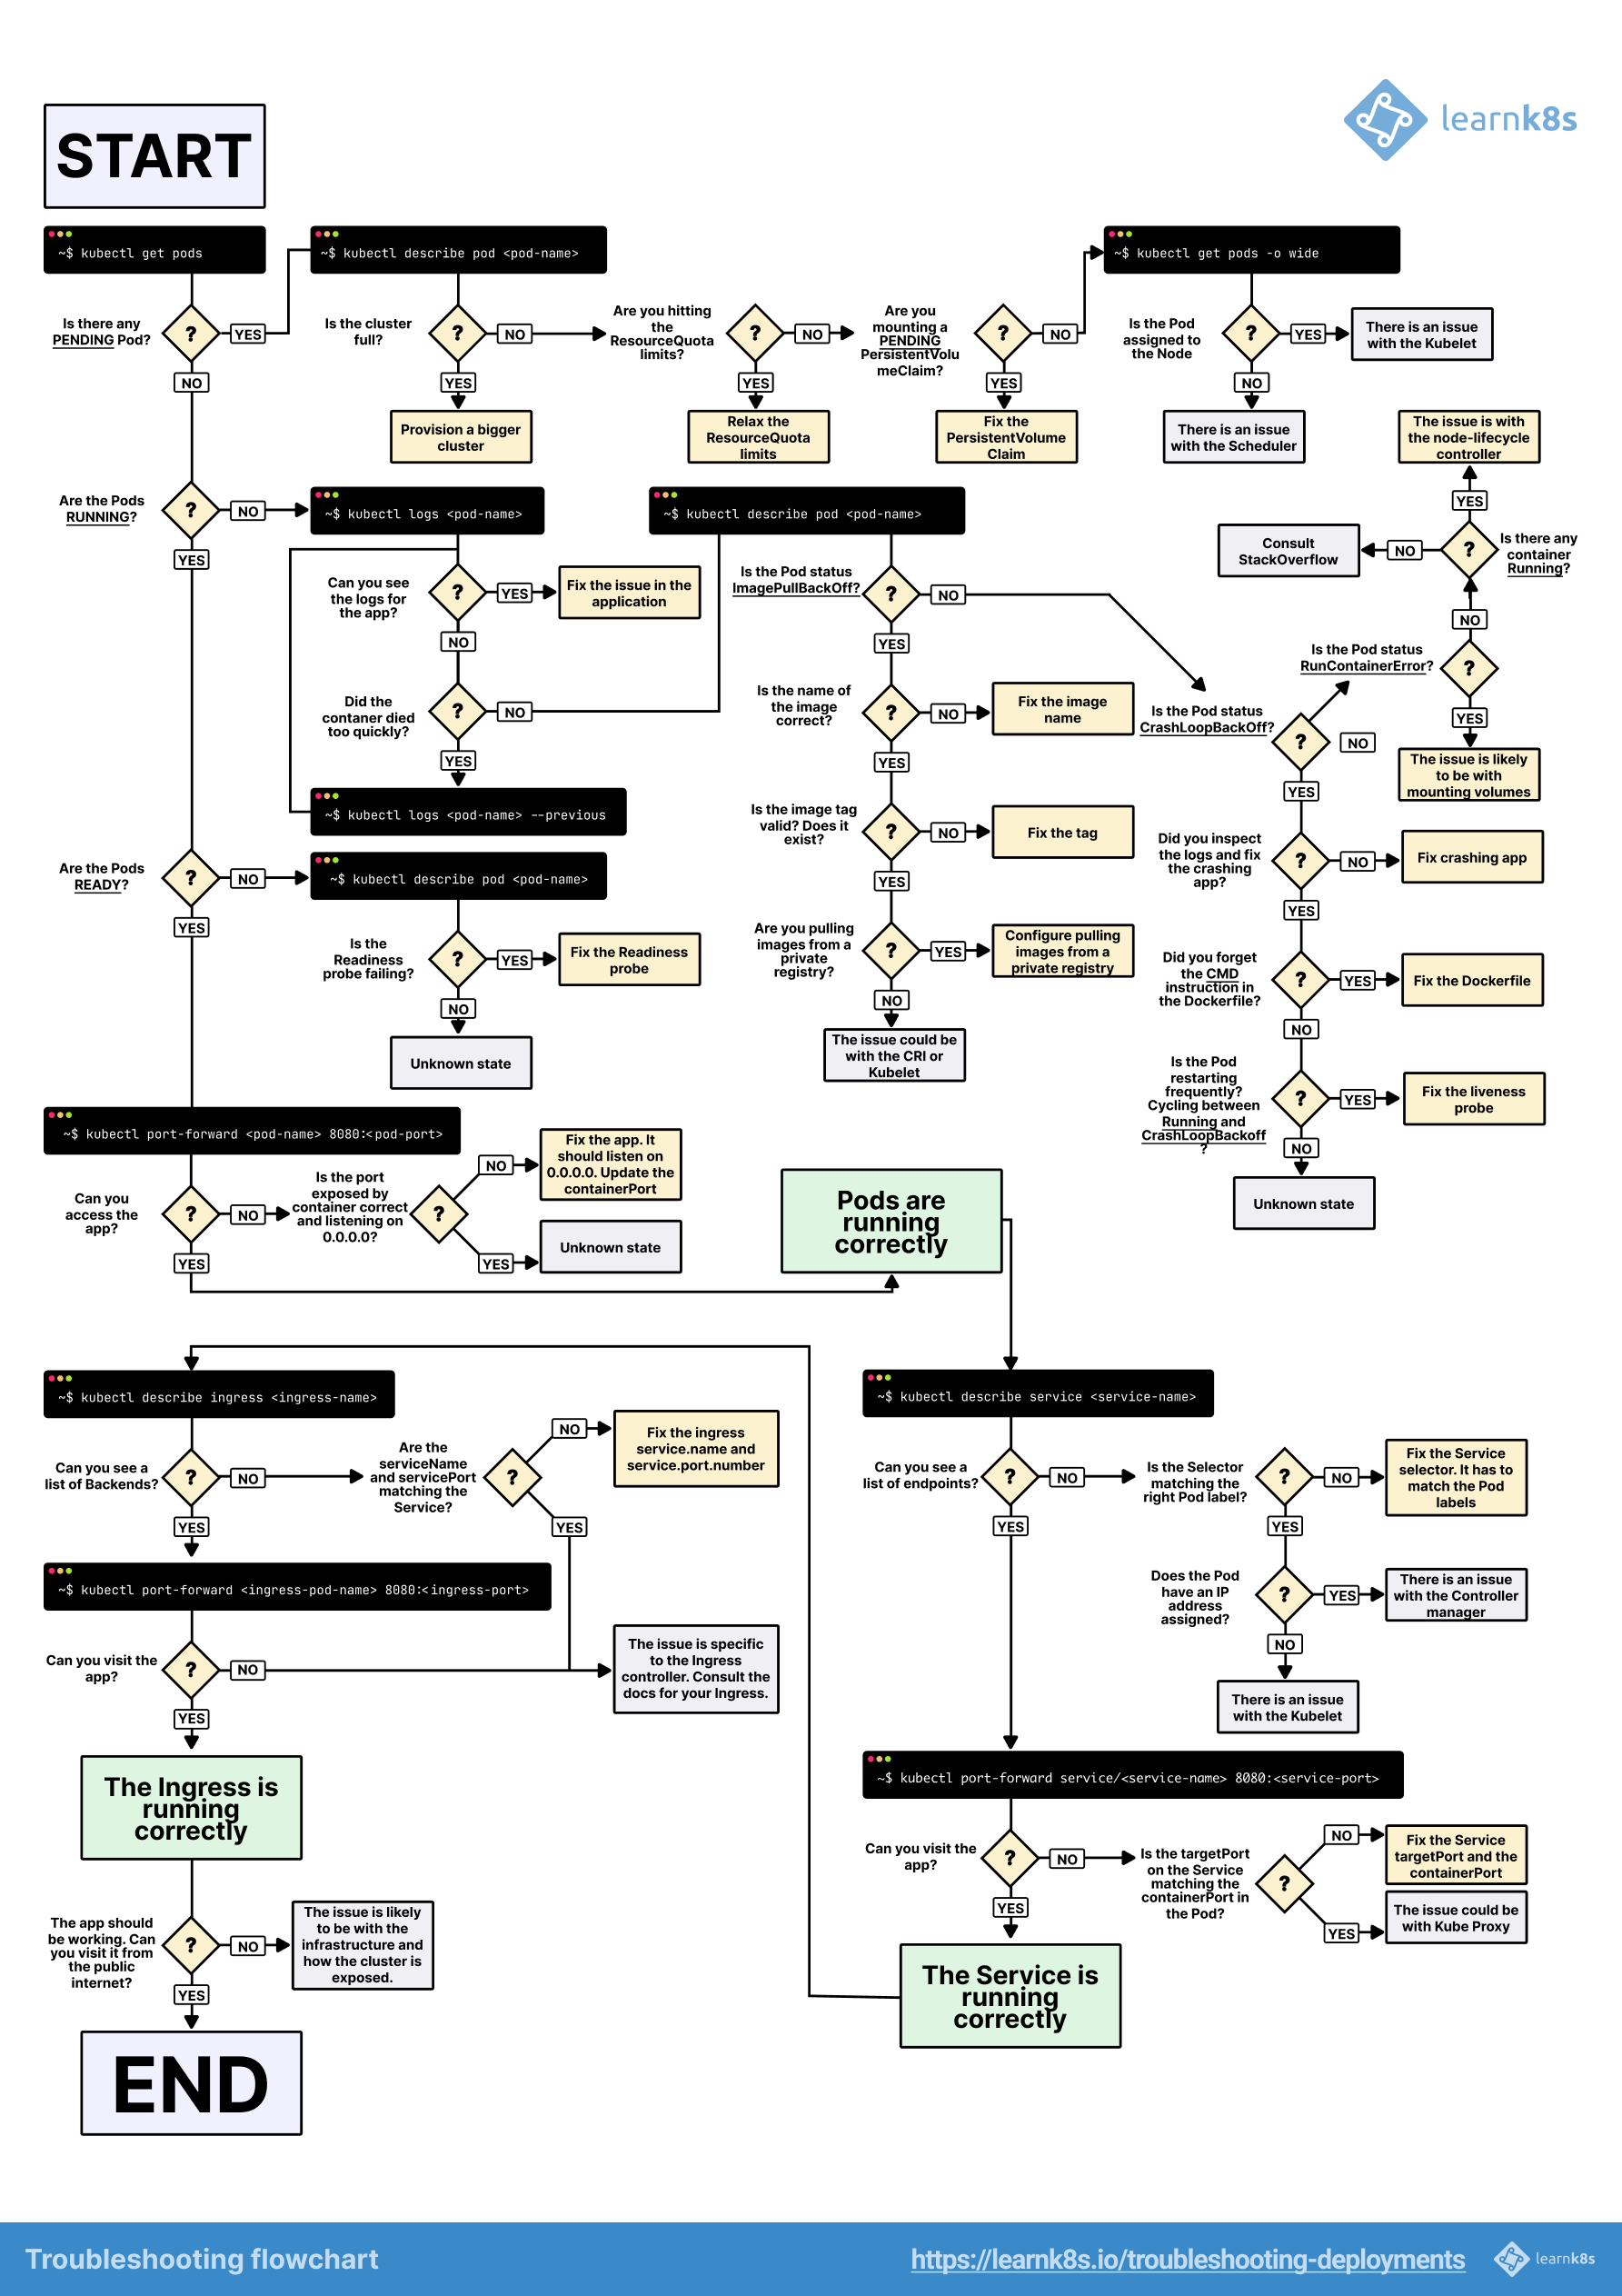
Kubernetes Troubleshooting Decision Tree

There are basically three ways your control plane can die, and you need to know which one you're dealing with because the fixes are completely different.

Pattern 1: API Server Overload Death Spiral (The OpenAI Special)

## Symptoms: API server is technically alive but slow as shit
## This is what killed OpenAI - too many requests crushing the API server

## Check if the API server process is eating all the CPU/memory
top -p $(pgrep kube-apiserver)
## If it's pegged at 100% CPU, you found your bottleneck

## Look for \"rate limit\" or \"timeout\" spam in API server logs
journalctl -u kube-apiserver | tail -100 | grep -E \"(rate|limit|timeout|overload)\"

## Find what's hammering your API server (this saved my ass once at 2AM)
journalctl -u kube-apiserver | grep -E \"verb=.*uri=\" | awk '{print $NF}' | sort | uniq -c | sort -nr | head -20
## Look for one URI with way more requests than others - that's your smoking gun
## Common culprits: /api/v1/nodes, /metrics, /api/v1/pods, or some fucking monitoring endpoint

Pattern 2: etcd Is Fucked (The Database From Hell)

etcd Performance Monitoring

## Symptoms: API calls hang forever, cluster state is inconsistent
## etcd problems are the worst because they can cause data loss

## Check if etcd is even responding (this either works or you're completely fucked)
etcdctl endpoint status --write-out=table \
  --endpoints=https://127.00.1:2379 \
  --cacert=/etc/kubernetes/pki/etcd/ca.crt \
  --cert=/etc/kubernetes/pki/etcd/server.crt \
  --key=/etc/kubernetes/pki/etcd/server.key

## How big is the etcd database? (>8GB is usually trouble, >16GB means someone's been storing shit in etcd they shouldn't)
etcdctl endpoint status --write-out=json | jq '.[] | {endpoint, dbSize}'

## Check if the disk is the problem (etcd hates slow disks)
iostat -x 1 3
## Look for %util > 90% or await > 10ms - that's your problem

Pattern 3: Network Hell (When Nodes Can't Talk)

## Symptoms: Some nodes work, others don't, everything is flaky
## This is the most frustrating type because it's intermittent

## Can nodes even reach each other?
ping -c 3 -W 2 other-control-plane-node
ping -c 3 -W 2 worker-node
## If pings fail or have high latency, network infrastructure is broken

## Is DNS completely fucked?
nslookup kubernetes.default.svc.cluster.local
## If this fails, services can't find each other

## Check if CoreDNS is even running (if kubectl works)
timeout 10s kubectl get pods -n kube-system | grep -E \"(dns|coredns)\" | grep Running
## If no DNS pods are running, that's your problem

Ghetto Monitoring (When Your Fancy Dashboards Are Dead)

Your monitoring went dark first, so you need to collect metrics the old-fashioned way. Here's what I run on multiple nodes to get a quick picture:

## Copy/paste this to get a quick node health snapshot
#!/bin/bash
echo \"=== Node $(hostname) Status $(date) ===\"
echo \"Load: $(uptime | awk -F'load average:' '{print $2}')\"
echo \"Memory: $(free -h | grep Mem | awk '{print $3 \\\"/\\\" $2 \\\" used\\\"}')\"
echo \"Disk: $(df -h / | tail -1 | awk '{print $5 \" full\"}')\"
echo \"Connections: $(ss -tuln | wc -l)\"
echo \"Running containers: $(docker ps -q | wc -l)\"
echo \"Recent OOM kills and disk errors: $(dmesg | grep -E \"(killed|oom|ext4)\" | tail -5)\"
echo \"\"

Grab API Server Metrics If Possible

## If the API server is slow but responding, grab its metrics
curl -s -k --max-time 10 https://kubernetes.io/docs/concepts/cluster-administration/system-metrics/ | grep -E \"(apiserver_request_duration|etcd_request_duration)\" > api-metrics.txt

## Find the slowest endpoints
grep \"quantile=\\\"0.99\\\"\" api-metrics.txt | sort -k2 -nr | head -10
## Look for anything over 1 second - that's your bottleneck

Prometheus metrics and API server monitoring help identify performance bottlenecks. etcd performance tuning and API server configuration become critical for recovery.

Now that you know what type of disaster you're dealing with and have some basic metrics, you've completed the critical diagnosis phase. The next step is where things get real - executing recovery procedures under pressure while your cluster is burning money and your monitoring is dark. This is where diagnostic knowledge transforms into actual solutions.

Recovery Strategies That Actually Work (When Everything's Broken)

Single fixes don't work during cascade failures because everything is interconnected and broken at the same time. I learned this the hard way during my second cluster disaster when I spent 3 hours trying to fix things one at a time while the cluster just kept getting worse. Felt like I was playing whack-a-mole with production infrastructure.

You need parallel approaches - multiple teams attacking different problems simultaneously, not the same problem. Here's what actually works when you're in crisis mode and every minute costs money.

Incident response procedures and disaster recovery planning become essential during outages. Backup and restore procedures and cluster upgrade rollback strategies help minimize downtime. Production troubleshooting methodologies and high availability strategies prevent single points of failure.

The War Room Approach (Multiple Teams, Different Problems)

During my worst cluster disaster, I made the mistake of having everyone work on the same problem. Five engineers all trying to restart the API server at the same time just created more chaos - API server was getting killed and restarted every 30 seconds because nobody coordinated. Took me like 3 hours, maybe 4, I lost track - felt like forever honestly. The breakthrough came when we said "fuck this" and split into parallel teams:

  1. Team 1: Stop the bleeding - Reduce load, kill problematic workloads, stabilize what's working
  2. Team 2: Find and kill the root cause - Identify what triggered this and eliminate it
  3. Team 3: Restore core services - Get DNS, networking, and critical apps back up
  4. Team 4: Prevent immediate repeat - Quick hardening so this doesn't happen again in 10 minutes

Each team works independently and reports status every 15 minutes. No stepping on each other's work.

API Server Overload Recovery (The OpenAI Disaster Playbook)

When OpenAI's API servers got crushed by their own monitoring, they couldn't use kubectl to fix anything because kubectl was part of the problem. Standard "rollback the deployment" doesn't work when the API server is too overloaded to process rollback requests.

Here's what actually works when your API server is drowning:

Step 1: Reduce the Load (Brute Force Method)

## If kubectl still works with timeouts, cordon nodes to reduce load
for node in $(kubectl get nodes --no-headers | tail -n +50 | awk '{print $1}'); do
  timeout 30s kubectl cordon $node &
done
## Cordoning nodes reduces kubelet API calls

## If kubectl is fucked, SSH to worker nodes and stop kubelet directly
ssh worker-node-50 "systemctl stop kubelet"
ssh worker-node-51 "systemctl stop kubelet"
## Keep going until API server load drops below like 70% CPU
## Watch API server logs: "too many requests in flight" should stop appearing

## Nuclear option: Block API traffic at the network level
iptables -A INPUT -p tcp --dport 6443 -m connlimit --connlimit-above 50 -j DROP
## This gives you breathing room but breaks everything else

Step 2: Scale Up API Server Resources (If You Can)

## For managed clusters (EKS, GKE, AKS) - pray to the cloud gods
## EKS: aws eks update-cluster-config --name your-cluster --scaling-config ...
## GKE: gcloud container clusters resize your-cluster --num-nodes=X
## This takes 10-15 minutes and might not work if you're already fucked
## Plus cloud providers sometimes reject scaling requests during outages - because why would they help?

## For self-managed clusters - edit the API server directly
## Increase request limits (dangerous but sometimes necessary)
## Note: this path changed in k8s 1.28+ - check /etc/kubernetes/manifests/
sed -i 's/--max-requests-inflight=400/--max-requests-inflight=1600/' /etc/kubernetes/manifests/kube-apiserver.yaml
## Restart kubelet to apply changes (takes 1-2 minutes to come back up)
systemctl restart kubelet

Step 3: Block the Problematic Traffic

## If you know what's causing the load, block it at the network level
## Example: Block monitoring agents hammering specific endpoints
iptables -A INPUT -p tcp --dport 6443 -m string --string "/api/v1/nodes" --algo bm -j DROP

## Rate limit API requests from specific sources
iptables -A INPUT -p tcp --dport 6443 -m recent --name api_abuse --rcheck --seconds 60 --hitcount 50 -j DROP

etcd Recovery (The Database From Hell)

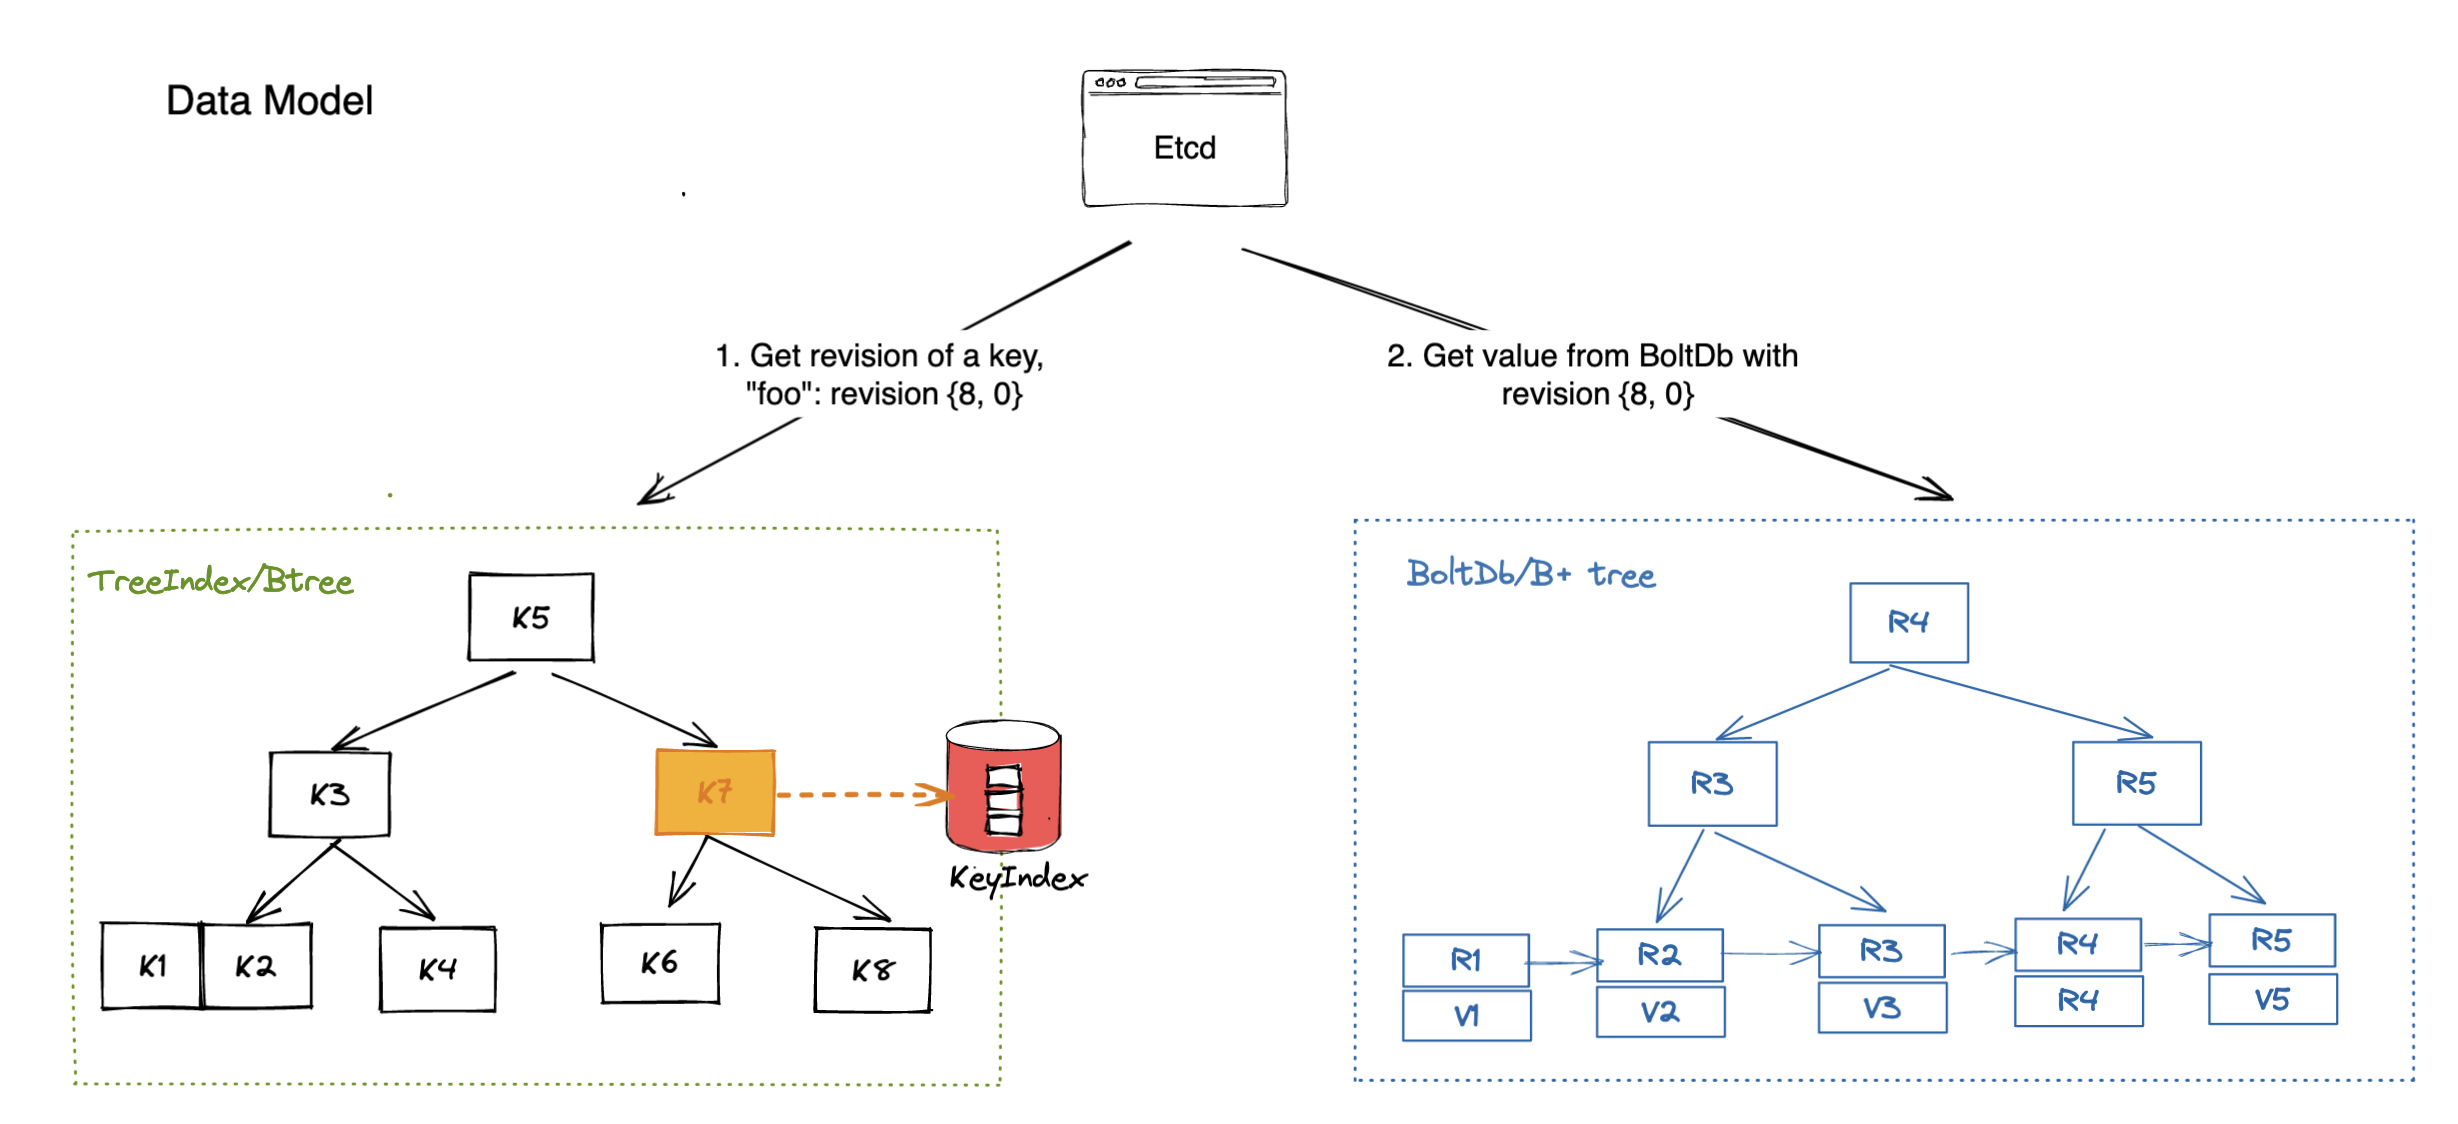
etcd Cluster Architecture

etcd failures are the absolute worst because they can cause permanent data loss. I've lost entire weekends to etcd corruption, and the recovery procedures are scary as shit because one wrong move can destroy your cluster state forever.

etcd disaster recovery documentation explains backup and restore procedures, while etcd performance troubleshooting covers optimization techniques. Split-brain scenario handling and cluster membership management become critical during failures.

When etcd is slow but alive (Performance Issues)

## Check how fucked your etcd performance is
etcdctl endpoint status --write-out=table

## If the database is huge (>8GB), compact it
etcdctl compact $(etcdctl endpoint status --write-out="json" | jq -r '.[] | .Status.header.revision')

## Defragment if compaction doesn't help
etcdctl defrag --endpoints=https://127.0.0.1:2379
## This can take 30+ minutes on large databases and blocks everything

## Last resort: increase etcd resource limits
## Edit /etc/systemd/system/etcd.service.d/override.conf
[Service]
LimitNOFILE=65536
MemoryLimit=8G

When etcd is completely fucked (Split-Brain or Corruption)

## Split-brain: half your etcd cluster thinks it's healthy, half doesn't
etcdctl member list --write-out=table
## If you see inconsistent data, you're in split-brain hell

## DANGER ZONE: Force quorum recovery (this can cause data loss)
## Stop etcd on the minority partition nodes
systemctl stop etcd
## Remove the failed members from the majority partition
etcdctl member remove <failed-member-id>

## Complete disaster recovery (when everything is corrupted)
## Stop ALL etcd members first
systemctl stop etcd

## Restore from backup (pray you have recent backups)
etcdctl snapshot restore /path/to/latest-backup.db --data-dir /var/lib/etcd
## Copy restored data to all etcd nodes
## Restart etcd cluster and hope for the best

DNS Cascade Recovery (When Services Can't Find Each Other)

## DNS failures are insidious - apps look healthy but can't communicate
## Quick CoreDNS restart
kubectl rollout restart deployment/coredns -n kube-system

## If kubectl is fucked, restart CoreDNS pods directly
docker ps | grep coredns | awk '{print $1}' | xargs docker restart

## Emergency DNS bypass - add static entries to nodes
echo "10.96.0.1 kubernetes.default.svc.cluster.local" >> /etc/hosts

The Recovery Priority List (Don't Try to Fix Everything at Once)

Kubernetes Recovery Priority Flow

When everything's broken, you can't fix it all simultaneously. I learned this lesson when I tried to restore everything in parallel and just made the situation worse. Fix things in order:

Get etcd working first, then worry about everything else

Look, I know you want to fix everything at once - trust me, I tried that approach during my second disaster and it's a complete shitshow. etcd first, then API server, then maybe you can actually debug the rest of this clusterfuck.

Core Infrastructure (Do this shit first):

  • etcd cluster health - if this is fucked, nothing else matters
  • API server responsiveness - can't manage anything without this
  • DNS resolution (CoreDNS) - services need to find each other
  • Basic networking (CNI) - pods need to talk

Platform Services (Only after core is stable):

  • Monitoring (so you can actually see what's happening instead of guessing)
  • Ingress controllers
  • Service mesh control plane
  • Secret management

Applications (Dead last):

  • Authentication services first (everything depends on auth)
  • Payment/revenue systems (the money-making stuff)
  • Core APIs
  • Frontend applications (users can wait, revenue can't)

Don't move to the next phase until the current one is stable. I've seen teams rush into application recovery while the control plane was still flaky - they spent 4 hours "fixing" apps that weren't actually broken, just waiting for DNS to work again. Total waste of time and just caused more cascading failures.

Armed with these recovery strategies, you now need to make fast decisions about which approach to use based on your specific situation. The comparison tables and decision matrices in the next section will help you choose the right recovery method when you're under pressure, time is running out, and every minute of downtime costs money.

What Actually Works vs. What the Documentation Says

Disaster Type

kubectl (LOL)

SSH to Nodes

Infrastructure Changes

Restore from Backup

Nuclear Options

API Server Crushed

❌ Hangs with "connection timeout"

✅ Actually works

✅ If you have time & money

❌ Overkill

✅ Fastest fix

etcd Corruption

❌ "etcdserver: request timed out"

❌ Can't fix data corruption

❌ Won't fix corruption

✅ Only real solution

❌ Makes it worse

DNS Hell

⚠️ If API works (unlikely)

✅ Edit /etc/hosts manually

✅ Fix real DNS if you can find it

❌ Pointless waste of time

✅ Static routing hack

Resources That Don't Completely Suck (Honest Reviews)

Related Tools & Recommendations

integration
Recommended

GitOps Integration Hell: Docker + Kubernetes + ArgoCD + Prometheus

How to Wire Together the Modern DevOps Stack Without Losing Your Sanity

prometheus
/integration/docker-kubernetes-argocd-prometheus/gitops-workflow-integration
100%
howto
Recommended

Set Up Microservices Monitoring That Actually Works

Stop flying blind - get real visibility into what's breaking your distributed services

Prometheus
/howto/setup-microservices-observability-prometheus-jaeger-grafana/complete-observability-setup
55%
troubleshoot
Similar content

Fix Kubernetes OOMKilled Pods - Production Memory Crisis Management

When your pods die with exit code 137 at 3AM and production is burning - here's the field guide that actually works

Kubernetes
/troubleshoot/kubernetes-oom-killed-pod/oomkilled-production-crisis-management
49%
integration
Recommended

GitHub Actions + Docker + ECS: Stop SSH-ing Into Servers Like It's 2015

Deploy your app without losing your mind or your weekend

GitHub Actions
/integration/github-actions-docker-aws-ecs/ci-cd-pipeline-automation
30%
tool
Recommended

Helm - Because Managing 47 YAML Files Will Drive You Insane

Package manager for Kubernetes that saves you from copy-pasting deployment configs like a savage. Helm charts beat maintaining separate YAML files for every dam

Helm
/tool/helm/overview
30%
tool
Recommended

Fix Helm When It Inevitably Breaks - Debug Guide

The commands, tools, and nuclear options for when your Helm deployment is fucked and you need to debug template errors at 3am.

Helm
/tool/helm/troubleshooting-guide
30%
integration
Recommended

Making Pulumi, Kubernetes, Helm, and GitOps Actually Work Together

Stop fighting with YAML hell and infrastructure drift - here's how to manage everything through Git without losing your sanity

Pulumi
/integration/pulumi-kubernetes-helm-gitops/complete-workflow-integration
30%
tool
Recommended

Prometheus - Scrapes Metrics From Your Shit So You Know When It Breaks

Free monitoring that actually works (most of the time) and won't die when your network hiccups

Prometheus
/tool/prometheus/overview
29%
integration
Recommended

GitHub Actions + Jenkins Security Integration

When Security Wants Scans But Your Pipeline Lives in Jenkins Hell

GitHub Actions
/integration/github-actions-jenkins-security-scanning/devsecops-pipeline-integration
29%
integration
Recommended

Falco + Prometheus + Grafana: The Only Security Stack That Doesn't Suck

Tired of burning $50k/month on security vendors that miss everything important? This combo actually catches the shit that matters.

Falco
/integration/falco-prometheus-grafana-security-monitoring/security-monitoring-integration
28%
tool
Recommended

Grafana - The Monitoring Dashboard That Doesn't Suck

integrates with Grafana

Grafana
/tool/grafana/overview
28%
troubleshoot
Recommended

Fix Kubernetes ImagePullBackOff Error - The Complete Battle-Tested Guide

From "Pod stuck in ImagePullBackOff" to "Problem solved in 90 seconds"

Kubernetes
/troubleshoot/kubernetes-imagepullbackoff/comprehensive-troubleshooting-guide
28%
howto
Similar content

How to Deploy Istio Without Destroying Your Production Environment

A battle-tested guide from someone who's learned these lessons the hard way

Istio
/howto/setup-istio-production/production-deployment
27%
compare
Recommended

Docker Desktop vs Podman Desktop vs Rancher Desktop vs OrbStack: What Actually Happens

extends Docker Desktop

Docker Desktop
/compare/docker-desktop/podman-desktop/rancher-desktop/orbstack/performance-efficiency-comparison
26%
tool
Similar content

Flux Performance Troubleshooting - When GitOps Goes Wrong

Fix reconciliation failures, memory leaks, and scaling issues that break production deployments

Flux v2 (FluxCD)
/tool/flux/performance-troubleshooting
25%
tool
Recommended

containerd - The Container Runtime That Actually Just Works

The boring container runtime that Kubernetes uses instead of Docker (and you probably don't need to care about it)

containerd
/tool/containerd/overview
24%
tool
Recommended

Podman Desktop - Free Docker Desktop Alternative

competes with Podman Desktop

Podman Desktop
/tool/podman-desktop/overview
22%
alternatives
Recommended

Podman Desktop Alternatives That Don't Suck

Container tools that actually work (tested by someone who's debugged containers at 3am)

Podman Desktop
/alternatives/podman-desktop/comprehensive-alternatives-guide
22%
tool
Recommended

Mongoose - Because MongoDB's "Store Whatever" Philosophy Gets Messy Fast

built on Mongoose

Mongoose
/tool/mongoose/overview
22%
compare
Recommended

Rust, Go, or Zig? I've Debugged All Three at 3am

What happens when you actually have to ship code that works

go
/compare/rust/go/zig/modern-systems-programming-comparison
22%

Recommendations combine user behavior, content similarity, research intelligence, and SEO optimization