Why Your K8s Costs Are Out of Control (And How KubeCost Fixes It)

Every month it's the same shit: AWS bill comes in 50% higher than expected and nobody knows why. Your EKS cluster is burning through money but AWS Cost Explorer just shows you EC2 instance costs. Useless.

The \"My Bill Exploded\" Problem

Here's what actually happens: Your data team spins up a Jupyter notebook for some "quick analysis" and accidentally leaves a model training job running all weekend. Meanwhile, your dev teams are deploying pods with CPU requests of 2 cores that actually use 0.1 cores. Nobody notices until the monthly AWS bill shows up at $47k instead of $30k.

Real production horror stories:

KubeCost Shows You Where the Money Goes

This is where KubeCost saves your sanity (and budget). Instead of staring at meaningless EC2 line items, you get actual answers.

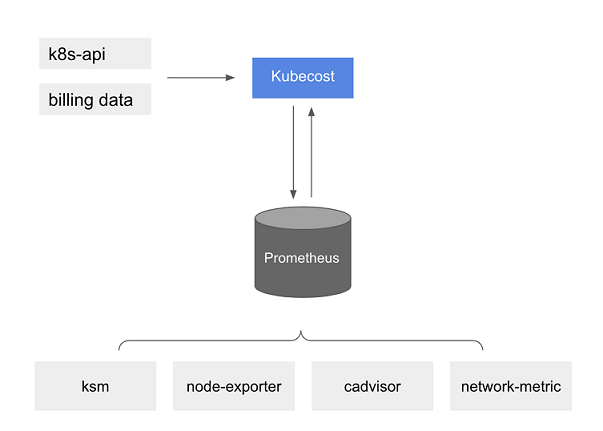
KubeCost deploys as a pod in your cluster and scrapes Prometheus metrics to figure out exactly what's consuming resources. It then applies real AWS pricing data to show you costs down to the individual pod level.

The architecture is straightforward: KubeCost runs in your cluster, connects to Prometheus for resource metrics, pulls pricing data from cloud providers, and serves a web UI for cost visibility.

What you actually get:

  • Pod-level costs: "That Redis pod costs $47/month"
  • Namespace breakdown: "QA environment is costing $8k/month"
  • Idle resource detection: "You have $3k/month of unused CPU"
  • Network costs that AWS hides in separate line items

Works with GKE, AKS, and even on-premises clusters if you hate yourself enough to run K8s on bare metal.

IBM Bought Them (September 2024)

IBM acquired KubeCost for their Apptio portfolio. Good news: Enterprise features actually work now. Bad news: Expect pricing to go up. The free tier still exists (up to 250 CPU cores) but enterprise features cost real money.

What changed post-acquisition:

OpenCost Logo

Links you'll actually need:

KubeCost vs The Competition (Honest Assessment)

Feature

KubeCost

OpenCost

CloudZero

AWS Cost Explorer

Actually Works

✅ (post-IBM acquisition)

⚠️ (if you like YAML hell)

✅ (enterprise-priced)

❌ (useless for K8s)

Setup Reality

10 min (5 min install + 5 min RBAC debugging)

2-6 hours (manual Prometheus config)

$50k + 3 months consulting

Already there (but useless)

Pod-level Costs

✅ Actually accurate

✅ Close enough

⚠️ Rolls up to services

❌ Shows EC2 instances only

Multi-cluster

✅ (Enterprise only, $$)

❌ (manual aggregation hell)

✅ (if you're Netflix-scale)

❌ (per-account silos)

When It Breaks

Slack support + docs

GitHub issues + prayers

Actual support engineers

AWS Support (good luck)

Prometheus Requirements

Bundled or BYO

BYO + debugging

Managed

N/A

Memory Usage

2-4GB (plan for 8GB)

1-2GB (if configured right)

Unknown (they manage it)

N/A

Real Cost Accuracy

95%+ (after bill reconciliation)

85%+ (manual reconciliation)

98%+ (they charge for accuracy)

100% (but wrong granularity)

What Actually Breaks When You Deploy KubeCost

KubeCost Prometheus Integration

Let's talk about what happens when you actually install this thing in production. The marketing says "5 minutes" but plan for 2 hours minimum because something will definitely break. Note: KubeCost 2.7 (current version as of September 2025) is much more stable than earlier 2.x releases.

Installation Reality Check

The Basic Install:

helm repo add kubecost https://kubecost.github.io/cost-analyzer/
helm install kubecost kubecost/cost-analyzer -n kubecost --create-namespace

What actually happens:

  1. Prometheus starts scraping and immediately runs out of memory
  2. RBAC permissions are wrong and pods can't read cluster metrics
  3. LoadBalancer service gets stuck in "Pending" because your cluster doesn't have one
  4. Cost data shows up as $0 for everything because cloud pricing API calls are failing

Prometheus Memory Explosions

The "bundled Prometheus" is a lie. It's a minimal config that works for demo clusters but dies on real workloads. Here's what you need to know:

Resource requirements (real numbers):

  • Small cluster (< 100 pods): 4GB RAM minimum, plan for 8GB
  • Medium cluster (100-500 pods): 8GB RAM, 4 CPU cores
  • Large cluster (500+ pods): 16GB+ RAM, dedicated nodes

Common failure modes:

Fix: Use existing Prometheus or size it properly

prometheus:
  server:
    resources:
      requests:
        memory: 8Gi
        cpu: 2000m
      limits:
        memory: 16Gi
    retention: "7d"
    storagePath: /data
    persistentVolume:
      size: 100Gi

Storage Grows Faster Than Expected

The "1GB per 1000 pods per month" estimate is bullshit. Plan for 3-5x that number.

What actually happens:

Storage reality check (from production):

  • 200-pod cluster: 5-10GB/month
  • 1000-pod cluster: 50GB+/month
  • Multi-cluster federation: 2-3x single cluster storage needs

Cost Data Accuracy Problems

Why your numbers don't match AWS bills:

  1. Reserved Instance allocation is broken - KubeCost doesn't properly distribute RI discounts across workloads
  2. Network costs are estimated - AWS Data Transfer pricing is complex and KubeCost guesses wrong
  3. Spot instance pricing lags - Real spot prices change every 5 minutes, KubeCost updates hourly
  4. EBS volume costs are weird - gp3 IOPS pricing isn't handled correctly in older versions

Bill reconciliation fixes most issues but requires:

  • AWS Cost and Usage Reports configured properly
  • S3 bucket with proper IAM permissions
  • 24-48 hour delay for reconciled data to appear

Multi-Cluster Federation (Enterprise)

The federated ETL setup is where things get really fun. IBM's docs make it sound simple but here's the reality:

What breaks:

  • ETL pipeline fails silently when one cluster has connectivity issues
  • Data deduplication doesn't work with different cluster naming schemes
  • Thanos integration requires custom Prometheus configs
  • Cross-cluster networking policies block federation traffic

Network requirements nobody tells you:

ARM64 Node Issues

Running KubeCost on ARM-based nodes (AWS Graviton, Apple Silicon) is broken in subtle ways:

Problems you'll hit:

  • Cost-analyzer pod crashes on ARM nodes with "exec format error"
  • Multi-arch images exist but Helm chart doesn't use them by default
  • Prometheus node-exporter metrics are missing CPU topology data
  • Network cost calculation fails on Graviton instances

Workaround: Pin KubeCost pods to AMD64 nodes:

nodeSelector:
  kubernetes.io/arch: amd64

Performance at Scale

Memory usage scales badly:

  • 100 nodes: 2GB
  • 500 nodes: 8GB
  • 1000 nodes: 20GB+ (not the documented 4GB)
  • 2000+ nodes: You need the enterprise federated architecture or it falls over

Query timeouts become common:

Real production configs:

After dealing with all these deployment issues, you might wonder if there are better alternatives. That's fair - KubeCost isn't the only game in town, and depending on your situation, something else might make more sense.

Useful troubleshooting links:

Questions Engineers Actually Ask

Q

Why does KubeCost show $30k but my AWS bill is $25k?

A

Because AWS doesn't count reserved instance discounts properly and KubeCost includes networking costs you forgot about. Also, Spot instance pricing changes every 5 minutes but KubeCost updates hourly.Real fix: Enable bill reconciliation with your AWS Cost and Usage Reports. Takes 48 hours to sync but then it's accurate within 2-3%.

Q

Installation is stuck at "Gathering metrics" for 2 hours - what the hell?

A

Your Prometheus is probably broken or can't scrape cAdvisor metrics. Check if these work:bashkubectl get --raw "/api/v1/nodes/node-name/proxy/metrics/cadvisor" | head -5kubectl top nodesIf those fail, your metrics-server is fucked or your cluster RBAC is blocking metric access. Common fix.

Q

KubeCost killed my existing Prometheus - how do I fix this?

A

Yeah, it does that.

KubeCost's Prometheus has aggressive scraping configs that can overwhelm smaller clusters. Either: 1.

Use your existing Prometheus (preferred):yamlprometheus: server: enabled: false # Point to your existing prometheus prometheusEndpoint: "http://your-prometheus:9090"2.

Or increase resources on KubeCost's Prometheus:yamlprometheus: server: resources: limits: memory: 16Gi cpu: 4000m

Q

Cost data is all $0 or missing - what's wrong?

A

**Check these in order:**1.

Cloud pricing API calls failing (check IAM permissions)2.

Prometheus can't reach Kubernetes API 3. Node pricing data isn't available (happens on custom instance types)4. Network policies blocking cost-analyzer podDebug commands:bashkubectl logs -n kubecost deployment/kubecost-cost-analyzer -fkubectl get pods -n kubecost -o wideLook for "failed to get pricing data" or "prometheus unreachable" errors.

Q

Multi-cluster federation shows duplicate costs - help!

A

This is a known bug when cluster names aren't unique. The ETL deduplication logic breaks when you have "production" in multiple regions.Workaround: Give each cluster unique names in the federation config:yamlkubecostProductConfigs: clusterName: "prod-us-east-1" # not just "production"

Q

ARM64 nodes cause KubeCost to crash with "exec format error"

A

KubeCost images don't properly support multi-architecture deployments.

Pin to AMD64 nodes:```yamlnodeSelector: kubernetes.io/arch: amd64tolerations:

  • key: "kubernetes.io/arch" operator: "Equal" value: "arm64" effect: "NoSchedule"```Or use OpenCost which has proper ARM support.
Q

Memory usage keeps growing until pods get OOMKilled

A

This is normal on large clusters.

KubeCost's memory usage is roughly:

  • 100 pods: 2-4GB
  • 500 pods: 8GB+
  • 1000+ pods: 16GB+ (despite docs saying 4GB)Set proper limits and use horizontal pod autoscaling:yamlresources: limits: memory: 16Gi requests: memory: 8Gi
Q

Why does the UI timeout on queries longer than 30 days?

A

Because the query optimization is shit.

Large time ranges with high cardinality (lots of pods/namespaces) hit the 2-minute query timeout.Workarounds:

  • Use API directly with smaller time windows
  • Enable query caching (enterprise feature)
  • Aggregate by namespace instead of pod level
Q

Free tier expired, now what?

A

You hit 250 CPU cores.

Either: 1.

Try KubeCost Enterprise Cloud free trial (available through the rest of 2025)2.

Pay for enterprise (starts around $500/month)3. Switch to OpenCost (free forever, more setup work)4.

Delete some dev/test namespaces to get under the limitCheck your usage:bashkubectl top nodes | awk '{sum+=$2} END {print "Total CPU cores: " sum/1000}'

Q

Network costs seem completely wrong

A

Network cost calculation is notoriously difficult and KubeCost's estimates are often 50% off. AWS Data Transfer pricing has like 20 different rates depending on direction, region, and service.Only bill reconciliation makes this accurate. Or just ignore network costs if they're <10% of your total bill.

Q

Performance is terrible on clusters >500 nodes

A

You need the enterprise federated architecture or a database backend.

The default SQLite storage doesn't scale.Required for large clusters:

Q

What's new in KubeCost 2.7 (latest version)?

A

KubeCost 2.7 released April 2025 includes:

  • Enhanced cost visibility and diagnostics
  • Improved reporting flexibility
  • GPU cost insights (finally shows which ML workloads are expensive)
  • Better multi-cloud support
  • Granular RBAC controls

Production-ready, unlike the earlier 2.x releases that had memory leaks.

Q

I want to try OpenCost instead - how to migrate?

A

OpenCost is the open source version.

You'll lose enterprise features but gain:

  • No licensing limitations
  • CNCF backing (won't disappear)
  • Better ARM64 support
  • More transparent developmentMigration is manual
  • no data export/import. You start fresh but keep your Prometheus data.

Related Tools & Recommendations

integration
Similar content

Jenkins Docker Kubernetes CI/CD: Deploy Without Breaking Production

The Real Guide to CI/CD That Actually Works

Jenkins
/integration/jenkins-docker-kubernetes/enterprise-ci-cd-pipeline
100%
troubleshoot
Similar content

Fix Kubernetes Service Not Accessible: Stop 503 Errors

Your pods show "Running" but users get connection refused? Welcome to Kubernetes networking hell.

Kubernetes
/troubleshoot/kubernetes-service-not-accessible/service-connectivity-troubleshooting
97%
tool
Similar content

kubectl: Kubernetes CLI - Overview, Usage & Extensibility

Because clicking buttons is for quitters, and YAML indentation is a special kind of hell

kubectl
/tool/kubectl/overview
84%
integration
Recommended

Setting Up Prometheus Monitoring That Won't Make You Hate Your Job

How to Connect Prometheus, Grafana, and Alertmanager Without Losing Your Sanity

Prometheus
/integration/prometheus-grafana-alertmanager/complete-monitoring-integration
81%
pricing
Similar content

Kubernetes Pricing: Uncover Hidden K8s Costs & Skyrocketing Bills

The real costs that nobody warns you about, plus what actually drives those $20k monthly AWS bills

/pricing/kubernetes/overview
78%
tool
Similar content

ArgoCD - GitOps for Kubernetes That Actually Works

Continuous deployment tool that watches your Git repos and syncs changes to Kubernetes clusters, complete with a web UI you'll actually want to use

Argo CD
/tool/argocd/overview
71%
tool
Similar content

Flux GitOps: Secure Kubernetes Deployments with CI/CD

GitOps controller that pulls from Git instead of having your build pipeline push to Kubernetes

FluxCD (Flux v2)
/tool/flux/overview
66%
tool
Similar content

containerd - The Container Runtime That Actually Just Works

The boring container runtime that Kubernetes uses instead of Docker (and you probably don't need to care about it)

containerd
/tool/containerd/overview
66%
howto
Similar content

Lock Down Kubernetes: Production Cluster Hardening & Security

Stop getting paged at 3am because someone turned your cluster into a bitcoin miner

Kubernetes
/howto/setup-kubernetes-production-security/hardening-production-clusters
66%
tool
Similar content

etcd Overview: The Core Database Powering Kubernetes Clusters

etcd stores all the important cluster state. When it breaks, your weekend is fucked.

etcd
/tool/etcd/overview
66%
tool
Similar content

Linkerd Overview: The Lightweight Kubernetes Service Mesh

Actually works without a PhD in YAML

Linkerd
/tool/linkerd/overview
66%
tool
Similar content

ArgoCD Production Troubleshooting: Debugging & Fixing Deployments

The real-world guide to debugging ArgoCD when your deployments are on fire and your pager won't stop buzzing

Argo CD
/tool/argocd/production-troubleshooting
58%
tool
Similar content

Change Data Capture (CDC) Integration Patterns for Production

Set up CDC at three companies. Got paged at 2am during Black Friday when our setup died. Here's what keeps working.

Change Data Capture (CDC)
/tool/change-data-capture/integration-deployment-patterns
58%
troubleshoot
Similar content

Fix Kubernetes Pod CrashLoopBackOff - Complete Troubleshooting Guide

Master Kubernetes CrashLoopBackOff. This complete guide explains what it means, diagnoses common causes, provides proven solutions, and offers advanced preventi

Kubernetes
/troubleshoot/kubernetes-pod-crashloopbackoff/crashloop-diagnosis-solutions
58%
pricing
Similar content

Terraform, Pulumi, CloudFormation: IaC Cost Analysis 2025

What these IaC tools actually cost you in 2025 - and why your AWS bill might double

Terraform
/pricing/terraform-pulumi-cloudformation/infrastructure-as-code-cost-analysis
58%
pricing
Similar content

Enterprise Data Platform Pricing: Real Costs & Hidden Fees 2025

Real costs, hidden fees, and the gotchas that'll murder your budget

Snowflake
/pricing/enterprise-data-platforms/total-cost-comparison
58%
tool
Similar content

New Relic Overview: App Monitoring, Setup & Cost Insights

New Relic tells you when your apps are broken, slow, or about to die. Not cheap, but beats getting woken up at 3am with no clue what's wrong.

New Relic
/tool/new-relic/overview
58%
tool
Recommended

Grafana - The Monitoring Dashboard That Doesn't Suck

integrates with Grafana

Grafana
/tool/grafana/overview
57%
tool
Similar content

Fix gRPC Production Errors - The 3AM Debugging Guide

Fix critical gRPC production errors: 'connection refused', 'DEADLINE_EXCEEDED', and slow calls. This guide provides debugging strategies and monitoring solution

gRPC
/tool/grpc/production-troubleshooting
53%
tool
Similar content

KEDA - Kubernetes Event-driven Autoscaling: Overview & Deployment Guide

Explore KEDA (Kubernetes Event-driven Autoscaler), a CNCF project. Understand its purpose, why it's essential, and get practical insights into deploying KEDA ef

KEDA
/tool/keda/overview
53%

Recommendations combine user behavior, content similarity, research intelligence, and SEO optimization