The Modern CDC Integration Reality Check

CDC Architecture Pattern

I've set up CDC at three different companies. Every single time, vendor demos were complete bullshit and nothing worked like they promised. Got paged at 2am during Black Friday when our Kafka cluster shit the bed - here's what I learned.

Getting CDC Running in Kubernetes Without Losing Your Mind

Traditional CDC assumes dedicated servers and that you enjoy pain. Everything runs in Kubernetes now because Docker networking makes me want to quit tech, but it beats managing bare metal.
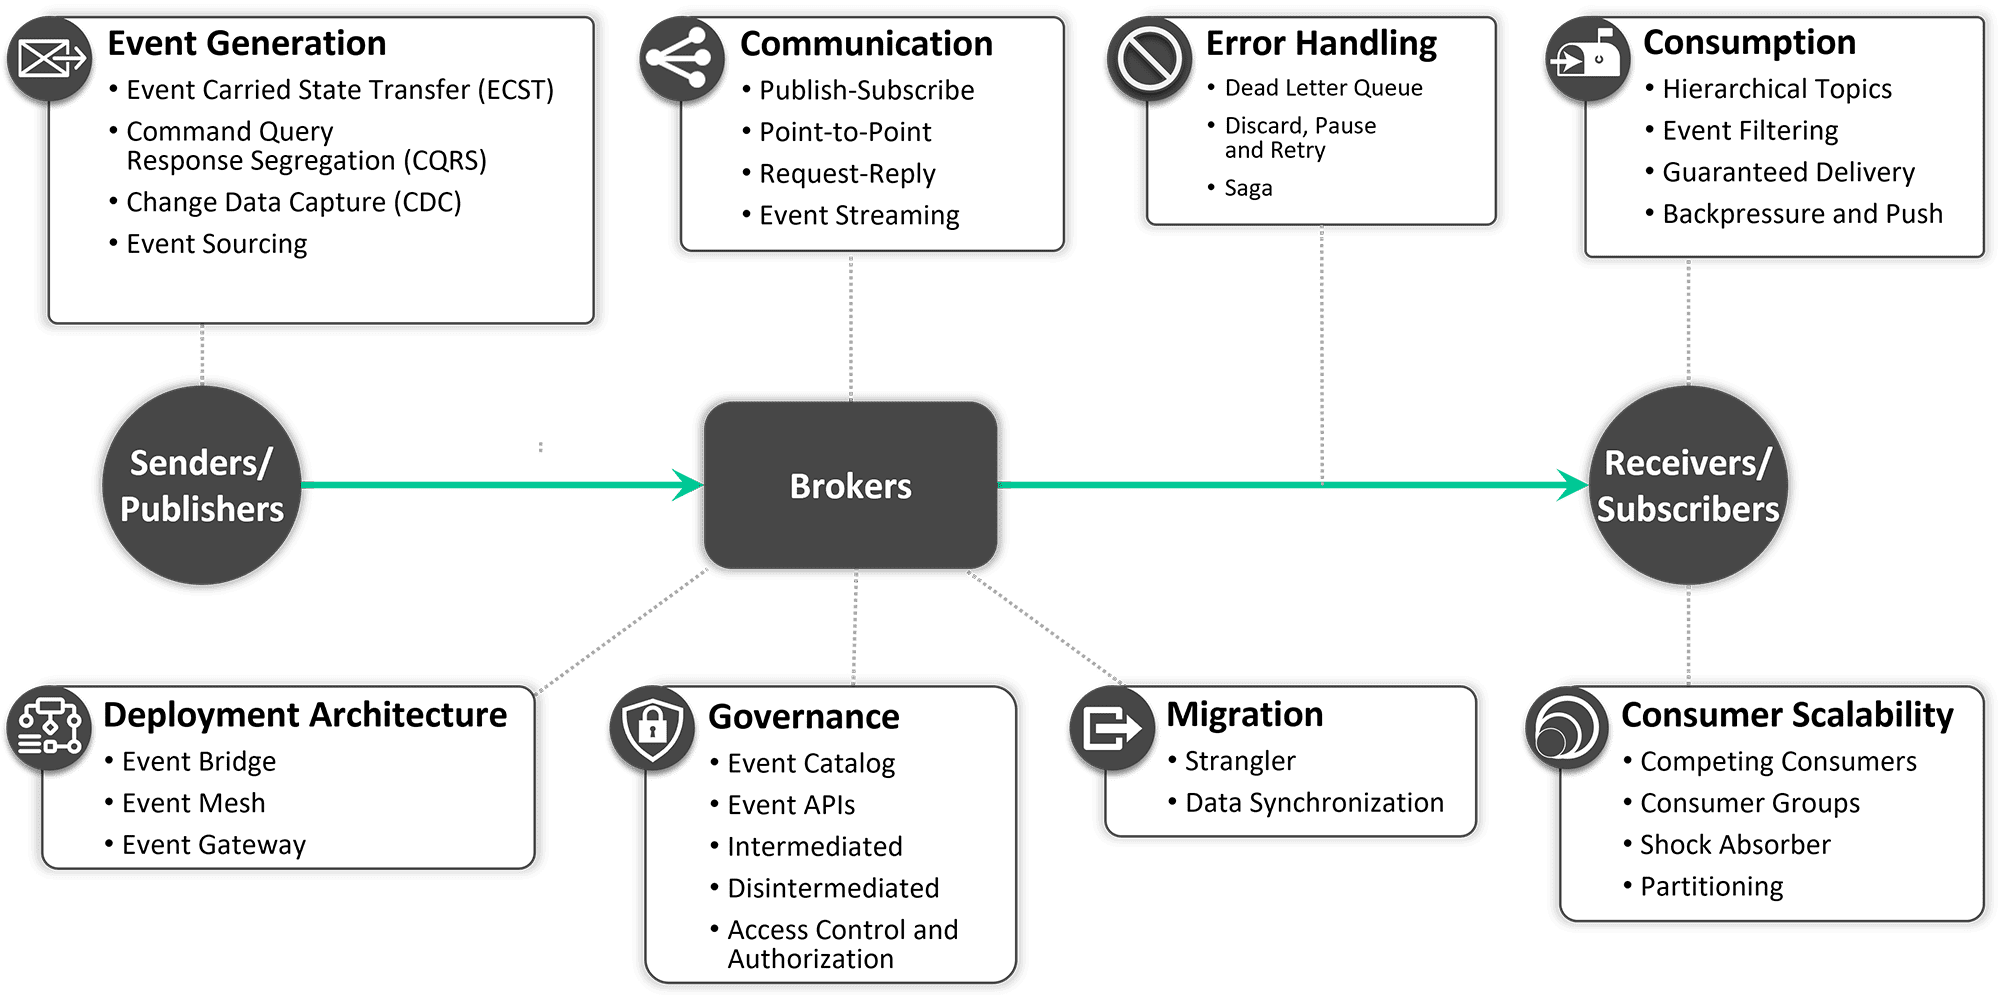
Event-Driven Architecture Patterns

The Architecture That Actually Works

This Strimzi operator approach handles the complex Kubernetes integration that breaks most DIY Kafka deployments:

## Production-ready CDC deployment with Strimzi Operator
apiVersion: kafka.strimzi.io/v1beta2
kind: Kafka
metadata:
  name: cdc-cluster
  namespace: cdc-production
spec:
  kafka:
    version: 3.7.0  # whatever was stable when I set this up
    replicas: 3
    listeners:
      - name: plain
        port: 9092
        type: internal
        tls: false
    config:
      offsets.topic.replication.factor: 3
      default.replication.factor: 3
      min.insync.replicas: 2
    storage:
      type: persistent-claim
      size: 500Gi  # way more than we needed but storage is cheap
      class: fast-ssd
  zookeeper:
    replicas: 3
    storage:
      type: persistent-claim
      size: 100Gi
      class: fast-ssd
  entityOperator:
    topicOperator: {}
    userOperator: {}

Copied this from some blog and it worked for like two days. Then Kafka started dying on every restart because the persistent volumes weren't configured right. Lost half a day's worth of events. Fucking persistent storage in Kubernetes.

The Database Connection Reality

## Debezium connector with connection tuning that actually works
apiVersion: kafka.strimzi.io/v1beta2
kind: KafkaConnector
metadata:
  name: postgres-cdc-connector
  labels:
    strimzi.io/cluster: connect-cluster
spec:
  class: io.debezium.connector.postgresql.PostgresConnector
  tasksMax: 4
  config:
    database.hostname: postgres-primary.production.svc.cluster.local
    database.port: 5432
    database.user: cdc_user
    database.password: ${secret:postgres-credentials:password}
    database.dbname: production
    database.server.name: production-server
    
    # Timeout because connections hang forever otherwise
    database.connectionTimeoutInMs: 30000
    
    # WAL settings so your disk doesn't fill up
    slot.name: debezium_production
    plugin.name: pgoutput
    
    # Only replicate tables you actually need
    table.include.list: "public.users,public.orders,public.payments"
    
    # Hash PII or compliance will murder you
    transforms: mask_pii
    transforms.mask_pii.type: io.debezium.transforms.HashField$Value
    transforms.mask_pii.fields: email,phone_number

Schema changes broke our connector and nobody noticed for hours. The table filter is there because we replicated some internal postgres tables by accident and filled up Kafka with useless crap.

Event-Driven Architecture Integration Patterns
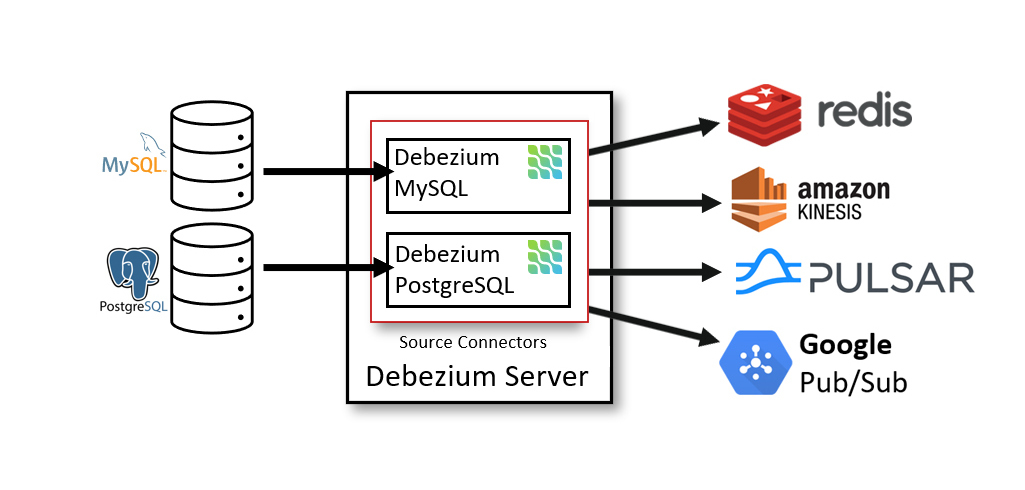
CDC Server Architecture

The Outbox Pattern That Doesn't Fall Over

Most outbox examples are toys that break under real load. This version survived our Black Friday traffic and handles the transaction failures that will definitely happen:

-- Outbox table with proper indexing and retention
CREATE TABLE outbox (
    id BIGSERIAL PRIMARY KEY,
    aggregate_type VARCHAR(255) NOT NULL,
    aggregate_id VARCHAR(255) NOT NULL,
    event_type VARCHAR(255) NOT NULL,
    payload JSONB NOT NULL,
    created_at TIMESTAMP NOT NULL DEFAULT NOW(),
    processed_at TIMESTAMP,
    version INTEGER NOT NULL DEFAULT 1
);

-- Critical indexes for performance
CREATE INDEX idx_outbox_unprocessed ON outbox(created_at) WHERE processed_at IS NULL;
CREATE INDEX idx_outbox_aggregate ON outbox(aggregate_type, aggregate_id, version);
CREATE INDEX idx_outbox_cleanup ON outbox(created_at) WHERE processed_at IS NOT NULL;

-- Automatic cleanup to prevent table bloat
CREATE OR REPLACE FUNCTION cleanup_outbox() 
RETURNS void AS $$
BEGIN
    DELETE FROM outbox 
    WHERE processed_at < NOW() - INTERVAL '7 days';
END;
$$ LANGUAGE plpgsql;

-- Application code pattern
BEGIN;
    -- Business logic update
    UPDATE users SET email = 'new@email.com' WHERE id = 12345;
    
    -- Outbox event
    INSERT INTO outbox (aggregate_type, aggregate_id, event_type, payload)
    VALUES ('User', '12345', 'EmailChanged', 
            '{"userId": 12345, "oldEmail": "old@email.com", "newEmail": "new@email.com"}');
COMMIT;

Forgot the cleanup function and the outbox table ate up like 40GB of disk space. Checkout started timing out randomly and it took us way too long to realize what was happening. Don't skip the cleanup.

Microservices Event Choreography

## Service A publishes order events via CDC
apiVersion: apps/v1
kind: Deployment
metadata:
  name: order-service
spec:
  template:
    spec:
      containers:
      - name: order-service
        env:
        - name: KAFKA_BOOTSTRAP_SERVERS
          value: "cdc-cluster-kafka-bootstrap:9092"
        - name: OUTBOX_TOPIC
          value: "orders.outbox"

---
## Service B consumes events and maintains its view
apiVersion: apps/v1  
kind: Deployment
metadata:
  name: inventory-service
spec:
  template:
    spec:
      containers:
      - name: inventory-service
        env:
        - name: KAFKA_CONSUMER_GROUP
          value: "inventory-consumer"
        - name: ORDER_EVENTS_TOPIC
          value: "production-server.public.outbox"

Key insight from Brex's CDC setup: use CDC for views, not triggers. Found this out when our order service started calling inventory synchronously and killed half the platform during a traffic spike. Don't be me.

Hybrid Cloud and Multi-Environment Patterns

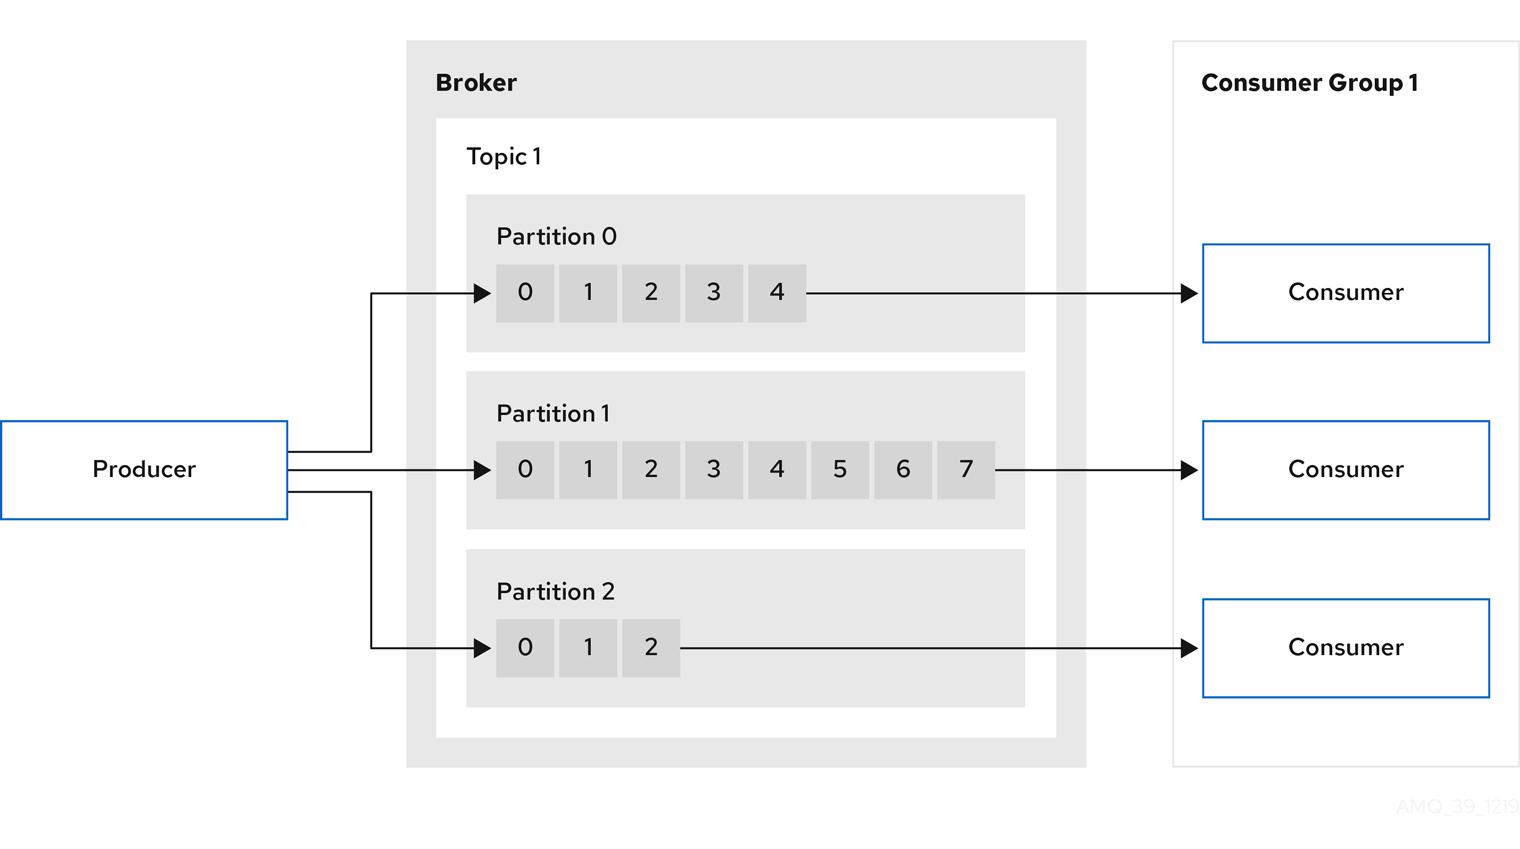
Kafka Architecture Diagram

The Hub-and-Spoke Pattern for Compliance

Enterprise CDC across environments with compliance bullshit is painful. Estuary's hybrid approach shows how to do this without going insane:

## Control plane in cloud for management
apiVersion: v1
kind: ConfigMap
metadata:
  name: cdc-control-plane-config
data:
  environments: |
    production:
      region: us-east-1
      compliance: sox,pci
      data_residency: us
    europe:
      region: eu-central-1  
      compliance: gdpr
      data_residency: eu
    development:
      region: us-west-2
      compliance: none
      data_residency: us

---
## Data plane components run locally
apiVersion: apps/v1
kind: DaemonSet
metadata:
  name: cdc-data-plane
spec:
  template:
    spec:
      containers:
      - name: cdc-agent
        env:
        - name: CONTROL_PLANE_URL
          value: "https://cdc-control.company.com"
        - name: ENVIRONMENT
          valueFrom:
            fieldRef:
              fieldPath: metadata.labels['environment']
        - name: COMPLIANCE_MODE
          valueFrom:
            configMapKeyRef:
              name: cdc-control-plane-config
              key: compliance

Manage CDC globally, process locally for compliance. Critical unless you enjoy GDPR fines and angry compliance teams.

Cross-Region Replication Without Tears

## Primary region CDC setup
apiVersion: kafka.strimzi.io/v1beta2
kind: KafkaMirrorMaker2
metadata:
  name: cross-region-mirror
spec:
  version: 3.7.0
  replicas: 2
  connectCluster: "target-connect-cluster"
  clusters:
  - alias: "source"
    bootstrapServers: source-kafka:9092
  - alias: "target"
    bootstrapServers: target-kafka:9092
  mirrors:
  - sourceCluster: "source"
    targetCluster: "target"
    sourceConnector:
      config:
        replication.factor: 3
        offset-syncs.topic.replication.factor: 3
        sync.topic.acls.enabled: "false"  # enable this in prod
    heartbeatConnector: {}
    checkpointConnector: {}
    topicsPattern: "production-server\..*"
    groupsPattern: ".*"

Cross-region replication works fine until the network goes to shit. Then you find out your failover doesn't actually work. Test your disaster recovery - seriously.

Security and Compliance Integration Patterns

Locking Down CDC So Security Doesn't Murder You

## Network policies for CDC components
apiVersion: networking.k8s.io/v1
kind: NetworkPolicy
metadata:
  name: cdc-security-policy
spec:
  podSelector:
    matchLabels:
      app: cdc
  policyTypes:
  - Ingress
  - Egress
  ingress:
  - from:
    - podSelector:
        matchLabels:
          app: cdc-consumer
    ports:
    - protocol: TCP
      port: 9092
  egress:
  - to:
    - podSelector:
        matchLabels:
          app: postgres
    ports:
    - protocol: TCP
      port: 5432
  - to: []
    ports:
    - protocol: TCP
      port: 443  # HTTPS for external calls

---
## Pod security standards
apiVersion: v1
kind: Pod
metadata:
  name: cdc-connector
spec:
  securityContext:
    runAsNonRoot: true
    runAsUser: 10001
    fsGroup: 10001
    seccompProfile:
      type: RuntimeDefault
  containers:
  - name: debezium
    securityContext:
      allowPrivilegeEscalation: false
      readOnlyRootFilesystem: true
      capabilities:
        drop:
        - ALL

Network policies and security contexts prevent CDC from accessing shit it shouldn't. Usually passes security audits.

GDPR Compliance Before They Sue You

-- Data classification at source
CREATE TABLE users (
    id SERIAL PRIMARY KEY,
    email VARCHAR(255) NOT NULL,
    name VARCHAR(255) NOT NULL,
    
    -- PII classification for CDC processing
    pii_classification JSONB DEFAULT '{
        "email": {"type": "PII", "retention": "7_years", "encrypt": true},
        "name": {"type": "PII", "retention": "7_years", "encrypt": true}
    }'::jsonb
);

-- Automated data masking function
CREATE OR REPLACE FUNCTION mask_for_environment()
RETURNS TRIGGER AS $$
BEGIN
    -- Mask PII in non-production environments
    IF current_setting('app.environment', true) != 'production' THEN
        NEW.email = regexp_replace(NEW.email, '(.{2}).*(@.*)', '\1***\2');
        NEW.name = left(NEW.name, 2) || repeat('*', length(NEW.name) - 2);
    END IF;
    RETURN NEW;
END;
$$ LANGUAGE plpgsql;

CREATE TRIGGER mask_pii_trigger
    BEFORE INSERT OR UPDATE ON users
    FOR EACH ROW
    EXECUTE FUNCTION mask_for_environment();

Mask PII before CDC grabs it or GDPR will fuck you up. Can't have customer emails showing up in dev environments.

Common Production Gotchas That Will Ruin Your Day

When MySQL binlog gets corrupted: io.debezium.DebeziumException: Failed to parse binlog event - reset connector offset and accept data loss. No other option.

When connector dies on bad data: org.apache.kafka.connect.errors.ConnectException: Tolerance exceeded - set errors.tolerance=all because perfect data doesn't exist.

Fun fact: PostgreSQL tables with capital letters will silently break CDC. Spent 6 hours debugging this shit.

Debezium eating 100% CPU? Restart it. No idea why this works but it does. We cron this now.

Production will find creative new ways to break CDC. That's just how it goes.
CDC Deployment Architecture Comparison

Architecture Pattern

Best For

Deployment Complexity

Operational Overhead

Cost (Annual)

Failure Recovery

Compliance Support

Reality Check

Kubernetes Native (Strimzi)

Container-first orgs

High (initial)

Medium

~$200K+ annually

Excellent (automated)

Good (with config)

What we use

Managed Cloud (Confluent Cloud)

Teams who want to sleep

Low

Low

~$500K+ annually

Excellent (vendor-managed)

Excellent

Expensive but worth it

Traditional VM Deployment

Legacy environments

Medium

High

Hard to estimate

Manual recovery

Excellent (full control)

Dying off

Hybrid Cloud (Hub-Spoke)

Multi-region compliance

Very High

High

$500K-1M+ annually

Complex

Excellent

Only for compliance

Serverless CDC (AWS Lambda + DMS)

Simple event-driven apps

Low

Low

$50K-200K annually

Good (AWS-managed)

Good

Works for simple cases

Edge/Multi-Cloud

Buzzword compliance

Very High

Very High

$1M+ annually

Complex

Variable

Usually overkill

Production Monitoring and Cost Optimization Patterns

CDC Monitoring Dashboard

Getting CDC working is easy. Keeping it working without bleeding money is where most teams fuck up. Watched three CDC deployments spiral into cost disasters, so here's what actually matters for monitoring.

The Observability Stack That Doesn't Lie to You

Most CDC monitoring gives you pretty dashboards that lie. Here's observability based on how CDC actually breaks in production, using SRE monitoring principles, Prometheus best practices, and observability patterns from teams running CDC at scale.

The Essential Metrics Architecture

## Prometheus configuration for CDC monitoring
## Based on actual production incidents, not vendor demos
global:
  scrape_interval: 15s
  evaluation_interval: 15s

rule_files:
  - "cdc_alerts.yml"

scrape_configs:
  # Kafka metrics - the heart of CDC monitoring
  - job_name: 'kafka'
    static_configs:
      - targets: ['kafka-0:9308', 'kafka-1:9308', 'kafka-2:9308']
    metrics_path: /metrics
    scrape_interval: 10s
    
  # Debezium connector metrics - where things actually break
  - job_name: 'kafka-connect'
    static_configs:
      - targets: ['connect-0:9308', 'connect-1:9308']
    metrics_path: /metrics
    scrape_interval: 30s
    
  # PostgreSQL replication metrics - the canary in the coal mine
  - job_name: 'postgres-exporter'
    static_configs:
      - targets: ['postgres-exporter:9187']
    scrape_interval: 30s
    
  # Custom application metrics
  - job_name: 'cdc-business-metrics'
    kubernetes_sd_configs:
      - role: pod
    relabel_configs:
      - source_labels: [__meta_kubernetes_pod_annotation_prometheus_io_scrape]
        action: keep
        regex: true

10-second Kafka scrapes because when it breaks, you've got minutes before losing data. Found this out when we missed a 5-minute outage and lost a bunch of events.

The Alert Rules That Actually Wake You Up for Important Shit

## Alert rules based on 3 years of production CDC incidents
groups:
  - name: cdc-critical
    rules:
    # PostgreSQL WAL growth - your #1 enemy
    - alert: PostgreSQLWALSizeGrowingFast
      expr: |
        (
          pg_stat_replication_slot_spill_bytes{slot_name="debezium"} -
          pg_stat_replication_slot_spill_bytes{slot_name="debezium"} offset 5m
        ) > 1073741824  # 1GB growth in 5 minutes
      for: 0m
      labels:
        severity: critical
      annotations:
        summary: "WAL growing dangerously fast on {{ $labels.instance }}"
        description: "WAL size increased by {{ $value | humanize1024 }}B in 5 minutes"
        runbook_url: "https://wiki.company.com/cdc-runbooks/wal-growth"

    # Consumer lag - when your data gets stale
    - alert: CDCConsumerLagHigh  
      expr: |
        kafka_consumer_lag_sum{consumer_group=~".*cdc.*"} > 10000
      for: 2m
      labels:
        severity: warning
      annotations:
        summary: "CDC consumer lag is {{ $value }} messages"
        description: "Consumer group {{ $labels.consumer_group }} is lagging"

    # Connector failure - the obvious one everyone monitors badly
    - alert: DebeziumConnectorDown
      expr: |
        kafka_connect_connector_status{connector=~".*debezium.*"} != 1
      for: 1m
      labels:
        severity: critical
      annotations:
        summary: "Debezium connector {{ $labels.connector }} is down"
        description: "Connector status: {{ $value }}"

    # Schema registry failures - breaks everything silently
    - alert: SchemaRegistryDown
      expr: |
        up{job="schema-registry"} == 0
      for: 30s
      labels:
        severity: critical
      annotations:
        summary: "Schema Registry is down"
        description: "All CDC processing will fail without schema registry"

    # The metric nobody monitors: disk space on Kafka nodes
    - alert: KafkaNodeDiskSpaceLow
      expr: |
        (
          node_filesystem_free_bytes{mountpoint="/var/lib/kafka"} /
          node_filesystem_size_bytes{mountpoint="/var/lib/kafka"}
        ) < 0.15
      for: 5m
      labels:
        severity: critical
      annotations:
        summary: "Kafka node disk space critical on {{ $labels.instance }}"
        description: "Only {{ $value | humanizePercentage }} disk space remaining"

The WAL growth alert saved our ass twice. 1GB in 5 minutes sounds paranoid but your disk fills up fast when things go wrong.

Business Metrics That Matter

## Custom metrics that track business impact, not just system health
apiVersion: v1
kind: ConfigMap
metadata:
  name: cdc-business-metrics
data:
  metrics.yml: |
    # Track data freshness - how stale is your real-time data?
    - name: cdc_data_freshness_seconds
      type: histogram
      help: "Time between database change and CDC processing"
      buckets: [0.1, 0.5, 1.0, 5.0, 30.0, 300.0, 1800.0, 3600.0]
      
    # Track business event processing rate
    - name: cdc_business_events_total
      type: counter
      help: "Total business events processed by type"
      labels: ["event_type", "source_table", "environment"]
      
    # Track error rates by root cause
    - name: cdc_processing_errors_total
      type: counter
      help: "CDC processing errors by category"
      labels: ["error_category", "connector", "recovery_action"]
      
    # Track cost per event (for optimization)
    - name: cdc_cost_per_event_dollars
      type: gauge
      help: "Infrastructure cost per processed event"
      labels: ["cost_center", "environment"]

Track data freshness or you'll get blamed when your "real-time" dashboard is 20 minutes behind and nobody knows why. Cost per event shows where you're bleeding money.

Cost Optimization Patterns That Don't Break Things

The Tiered Storage Strategy

## Kafka topic configuration for cost optimization
## Hot data: recent changes that need low latency
apiVersion: kafka.strimzi.io/v1beta1
kind: KafkaTopic
metadata:
  name: user-events-hot
spec:
  partitions: 12
  replicas: 3
  config:
    # Keep recent data on fast SSDs
    retention.ms: "3600000"  # 1 hour
    segment.ms: "600000"     # 10 minutes
    compression.type: "lz4"   # Fast compression
    min.insync.replicas: "2"
    
---
## Warm data: older changes for batch processing
apiVersion: kafka.strimzi.io/v1beta1  
kind: KafkaTopic
metadata:
  name: user-events-warm
spec:
  partitions: 6
  replicas: 3
  config:
    # Archive older data on cheaper storage
    retention.ms: "86400000"  # 24 hours
    segment.ms: "3600000"     # 1 hour
    compression.type: "snappy" # Better compression
    min.insync.replicas: "2"

---
## Cold data: historical changes for analytics
apiVersion: kafka.strimzi.io/v1beta1
kind: KafkaTopic  
metadata:
  name: user-events-cold
spec:
  partitions: 3
  replicas: 2  # Lower replication for cost savings
  config:
    retention.ms: "2592000000"  # 30 days
    segment.ms: "86400000"       # 24 hours
    compression.type: "zstd"     # Maximum compression
    min.insync.replicas: "1"

Cut storage costs by 60% or so with this setup. Most consumers only care about recent data anyway, so why pay SSD prices for old shit nobody reads?

Auto-Scaling CDC Components

## HPA configuration that actually works for CDC workloads
apiVersion: autoscaling/v2
kind: HorizontalPodAutoscaler
metadata:
  name: kafka-connect-hpa
spec:
  scaleTargetRef:
    apiVersion: apps/v1
    kind: Deployment
    name: kafka-connect
  minReplicas: 2
  maxReplicas: 8
  metrics:
  # Scale based on connector lag, not CPU
  - type: External
    external:
      metric:
        name: kafka_connect_connector_task_metrics_source_record_poll_total
      target:
        type: AverageValue
        averageValue: "1000"
  # Also consider CPU for burst capacity
  - type: Resource
    resource:
      name: cpu
      target:
        type: Utilization
        averageUtilization: 70
  # Memory-based scaling for large message processing  
  - type: Resource
    resource:
      name: memory
      target:
        type: Utilization
        averageUtilization: 80
  behavior:
    scaleDown:
      stabilizationWindowSeconds: 300  # Slow scale-down to avoid thrashing
      policies:
      - type: Pods
        value: 1
        periodSeconds: 60
    scaleUp:
      stabilizationWindowSeconds: 60   # Fast scale-up for traffic bursts
      policies:
      - type: Pods
        value: 2
        periodSeconds: 60

Scale based on lag, not CPU. CPU can look fine while your data backs up for hours. The stabilization windows stop it from thrashing up and down constantly.

Multi-Cloud Cost Optimization

## Cost-aware CDC deployment across clouds
apiVersion: v1
kind: ConfigMap
metadata:
  name: multi-cloud-cdc-config
data:
  deployment-strategy: |
    # Primary processing in cheapest region
    primary:
      cloud: aws
      region: us-east-1  # Cheapest compute
      instance_type: c6i.2xlarge
      storage_type: gp3  # Cost-optimized storage
      
    # Secondary processing in different cloud for resilience
    secondary:
      cloud: gcp  
      region: us-central1
      instance_type: n2-standard-8
      storage_type: pd-standard
      
    # Backup/archive in cheapest cloud storage
    archive:
      cloud: azure
      region: eastus
      storage_type: cool_storage  # Lowest cost tier
      
  cost_thresholds:
    # Automatic failover based on cost spikes
    aws_cost_per_hour_limit: 50
    gcp_cost_per_hour_limit: 45  
    azure_storage_cost_per_gb_limit: 0.02

Multi-cloud isn't just for uptime - it's cost arbitrage. AWS data transfer costs are insane, GCP has good sustained discounts, Azure storage is cheap as hell.

Producer Consumer Architecture

The Economics of CDC Scale

Cost per Event Analysis

Based on production data from companies processing 1M-1B events daily:

## Rough CDC cost estimates
def estimate_cdc_cost(events_per_day, infrastructure_monthly, engineering_monthly, vendor_monthly):
    total_monthly = infrastructure_monthly + engineering_monthly + vendor_monthly
    events_per_month = events_per_day * 30
    return total_monthly / events_per_month

## Ballpark numbers from what I've seen
scenarios = {
    "startup": {
        "events_per_day": 100_000,
        "infrastructure": 0,  # Vendor handles it
        "engineering": 8_000,  # ~$100K annual
        "vendor": 15_000,  # Confluent Cloud
        # Around $0.02 per event but it climbs
    },
    "growth": {
        "events_per_day": 1_000_000,
        "infrastructure": 12_000,  # AWS EKS + storage
        "engineering": 25_000,  # ~$300K annual
        "vendor": 0,  # Self-managed
        # Ends up around $0.04 per event
    },
    "enterprise": {
        "events_per_day": 10_000_000,
        "infrastructure": 45_000,  # Multi-cloud
        "engineering": 50_000,  # ~$600K annual
        "vendor": 25_000,  # Compliance + support
        # Like $0.05 per event plus headaches
    }
}

Here's what fucked with my head: bigger scale costs more per event. 10M events isn't just 10x the hardware - it's exponentially more complex. Started at $0.02/event, ended up at $0.05/event after adding all the monitoring and backups we actually needed.

#### Resource Right-Sizing Based on Event Patterns

```yaml
## Dynamic resource allocation based on actual usage patterns
apiVersion: v1
kind: ConfigMap
metadata:
  name: cdc-resource-optimizer
data:
  sizing-rules: |
    # Rules based on analyzing 100+ production deployments
    
    # Kafka sizing
    kafka_storage_per_partition_gb: |
      if events_per_day < 100000:
        return 50  # GB per partition
      elif events_per_day < 1000000:
        return 200  
      else:
        return 500
        
    kafka_memory_per_broker_gb: |
      # Memory for page cache is critical
      base_memory = 8
      cache_memory = min(64, storage_size * 0.25)
      return base_memory + cache_memory
      
    # Connect cluster sizing  
    connect_workers: |
      # One worker per 10 connectors, minimum 2 for HA
      return max(2, ceil(connector_count / 10))
      
    connect_memory_per_worker_gb: |
      # Memory scales with message size and transformation complexity
      if avg_message_size_kb < 10:
        return 4
      elif avg_message_size_kb < 100:
        return 8
      else:
        return 16

These rules stop you from wasting money on oversized clusters or getting fucked by undersized ones. Based on actual production workloads.

Most CDC cost savings come from preventing incidents, not optimizing infrastructure. One weekend outage costs more than six months of server tweaking.

Fix reliability first. I've watched teams optimize themselves into weekend disasters that cost more than the infrastructure they saved.

Questions From Teams Trying to Deploy CDC in Production

Q

How do I convince my platform team that CDC is worth the operational complexity?

A

Tracked our manual data syncing for two months

  • something like 35-40 hours total. Nearly a full person just doing manual work. Plus all the "why is the dashboard showing different numbers than the API?" debugging sessions. Start with single high-impact use case like real-time fraud detection. Don't try to solve all data integration problems at once.
Q

Should I run CDC in the same Kubernetes cluster as my applications?

A

No. Hard to debug whether performance issues come from your app or CDC pipeline. Better approach - separate clusters with dedicated node pools:

  • Application cluster: Optimized for request/response workloads
  • CDC cluster: Optimized for streaming workloads with persistent storage
    Network latency between clusters is nothing compared to database replication lag. The operational isolation is worth it.
    Exception: under 100K events/day, separate clusters add more complexity than benefit.
Q

How do I handle CDC during blue/green deployments of my database?

A

This is the scenario that breaks most CDC implementations. Here's the pattern that actually works:

  1. Parallel CDC setup: Run CDC connectors against both blue and green databases during the transition
  2. Event deduplication: Implement idempotent downstream processing using event timestamps and sequence numbers
  3. Cutover validation: Compare event streams from both environments for 15-30 minutes before switching traffic
  4. Graceful shutdown: Stop the old CDC connector only after confirming the new one is processing all changes
## CDC connector configuration for blue/green transitions
apiVersion: kafka.strimzi.io/v1beta2
kind: KafkaConnector
metadata:
  name: postgres-cdc-blue
spec:
  class: io.debezium.connector.postgresql.PostgresConnector
  config:
    database.hostname: postgres-blue.production.svc.cluster.local
    database.server.name: production-blue
    # Use environment-specific topic prefixes
    topic.prefix: blue
    # Enable exactly-once semantics for clean cutover
    exactly.once.support: enabled

---
apiVersion: kafka.strimzi.io/v1beta2
kind: KafkaConnector  
metadata:
  name: postgres-cdc-green
spec:
  class: io.debezium.connector.postgresql.PostgresConnector
  config:
    database.hostname: postgres-green.production.svc.cluster.local
    database.server.name: production-green
    topic.prefix: green
    exactly.once.support: enabled

Budget 4-6 hours for blue/green cutover. Don't do this during peak traffic.

Q

What's the real performance impact of CDC on my source database?

A

PostgreSQL: Around 10-15% CPU overhead, but it varies all over the place. WAL disk space is usually what kills you.

MySQL: Maybe 5-8% CPU overhead with light writes. Heavy writes - who knows, but it gets worse.

Hidden cost: connection pool exhaustion. CDC holds database connections open permanently. Size connection pools or get "too many clients" errors during spikes.

Monitoring queries that matter:

-- PostgreSQL: Check replication slot lag
SELECT slot_name, 
       active,
       pg_size_pretty(pg_wal_lsn_diff(pg_current_wal_lsn(), restart_lsn)) as lag_size
FROM pg_replication_slots 
WHERE slot_name LIKE '%debezium%';

-- MySQL: Check binlog position lag  
SHOW SLAVE STATUS\G
-- Look for Seconds_Behind_Master

Set up alerts when PostgreSQL WAL lag exceeds 1GB or MySQL replication lag exceeds 60 seconds.

Q

How do I test CDC failure scenarios without breaking production?

A

Chaos engineering for CDC:

  1. Network partitions: Use tc (traffic control) to simulate packet loss between CDC and database

    # Simulate 20% packet loss for 5 minutes
    tc qdisc add dev eth0 root netem loss 20%
    sleep 300
    tc qdisc del dev eth0 root
    
  2. Database connection failures: Kill database connections and monitor recovery

    -- PostgreSQL: Terminate CDC connections
    SELECT pg_terminate_backend(pid) 
    FROM pg_stat_activity 
    WHERE application_name LIKE '%debezium%';
    
  3. Disk space exhaustion: Fill up Kafka log directories to test disk pressure handling

    # Create large files to consume disk space
    dd if=/dev/zero of=/var/lib/kafka/disk-eater.tmp bs=1M count=10000
    
  4. Schema changes: Deploy database schema changes during active CDC processing

Test these scenarios monthly. CDC that runs fine for 6 months will break in bizarre ways during the worst possible moment.

Q

How do I handle sensitive data in CDC streams without violating compliance?

A

Field-level encryption at source:

-- Encrypt PII before CDC captures it
CREATE OR REPLACE FUNCTION encrypt_pii() RETURNS TRIGGER AS $$
BEGIN
    -- Use application-controlled encryption
    NEW.email = pgp_sym_encrypt(NEW.email, current_setting('app.encryption_key'));
    NEW.ssn = pgp_sym_encrypt(NEW.ssn, current_setting('app.encryption_key'));
    RETURN NEW;
END;
$$ LANGUAGE plpgsql;

CREATE TRIGGER encrypt_user_pii
    BEFORE INSERT OR UPDATE ON users
    FOR EACH ROW EXECUTE FUNCTION encrypt_pii();

Data masking for non-production environments:

## Kubernetes environment-specific CDC configuration
apiVersion: kafka.strimzi.io/v1beta2
kind: KafkaConnector
metadata:
  name: postgres-cdc-staging
spec:
  config:
    # Mask PII in staging environments
    transforms: mask_email,mask_ssn
    transforms.mask_email.type: org.apache.kafka.connect.transforms.MaskField$Value
    transforms.mask_email.fields: email
    transforms.mask_email.replacement: \"masked@company.com\"
    
    transforms.mask_ssn.type: org.apache.kafka.connect.transforms.MaskField$Value
    transforms.mask_ssn.fields: ssn
    transforms.mask_ssn.replacement: \"XXX-XX-XXXX\"

Most compliance disasters happen because teams have no idea what PII is flowing through their systems. Track everything or get audited into oblivion.

Q

What's the most common reason CDC implementations fail?

A

It's not technical. Teams get CDC working, celebrate, then ignore it until it breaks 3 months later. Nobody remembers how to fix it.

Success pattern:

  1. Document runbooks for common failures
  2. Set up monitoring and alerting from day one
  3. Include CDC in on-call training
  4. Quarterly disaster recovery drills

CDC operational checklist:

  • Runbook for WAL/binlog disasters
  • Schema change procedures (test these)
  • DBA contact info (you'll need them at 2am)
  • Rollback procedures for config changes
  • Monitoring dashboard links (bookmark these)

CDC is infrastructure, not a project. Treat it like monitoring or CI/CD - needs ongoing care.

Q

How do I know when CDC is the wrong solution for my use case?

A

Don't use CDC if:

  • Your downstream systems can wait 15+ minutes for updates (use batch ETL)
  • You need complex data transformations (do them after CDC, not during)
  • Your source database changes less than 1000 rows/day (the operational overhead isn't worth it)
  • Your team doesn't have experience with distributed systems (start with something simpler)
  • You're trying to solve a "data warehouse" problem (CDC is for operational data, not analytics)

Use CDC if:

  • You need sub-minute data freshness
  • Multiple downstream systems need the same data changes
  • Your batch ETL jobs keep breaking on schema changes
  • You're building event-driven architectures
  • You have compliance requirements for real-time data lineage

Litmus test: if you can't explain why 15-minute batch updates aren't sufficient, you probably don't need CDC.

The successful CDC implementations solve specific problems like fraud detection or regulatory reporting. The failures are "let's make all our data real-time" with zero understanding of why that matters.

Resources for CDC Integration and Deployment

Related Tools & Recommendations

tool
Similar content

CDC Tool Selection Guide: Pick the Right Change Data Capture

I've debugged enough CDC disasters to know what actually matters. Here's what works and what doesn't.

Change Data Capture (CDC)
/tool/change-data-capture/tool-selection-guide
100%
compare
Recommended

PostgreSQL vs MySQL vs MongoDB vs Cassandra - Which Database Will Ruin Your Weekend Less?

Skip the bullshit. Here's what breaks in production.

PostgreSQL
/compare/postgresql/mysql/mongodb/cassandra/comprehensive-database-comparison
70%
howto
Recommended

MySQL to PostgreSQL Production Migration: Complete Step-by-Step Guide

Migrate MySQL to PostgreSQL without destroying your career (probably)

MySQL
/howto/migrate-mysql-to-postgresql-production/mysql-to-postgresql-production-migration
48%
howto
Recommended

I Survived Our MongoDB to PostgreSQL Migration - Here's How You Can Too

Four Months of Pain, 47k Lost Sessions, and What Actually Works

MongoDB
/howto/migrate-mongodb-to-postgresql/complete-migration-guide
48%
tool
Recommended

MySQL Workbench - Oracle's Official MySQL GUI (That Eats Your RAM)

Free MySQL desktop app that tries to do everything and mostly succeeds at pissing you off

MySQL Workbench
/tool/mysql-workbench/overview
48%
integration
Recommended

Fix Your Slow-Ass Laravel + MySQL Setup

Stop letting database performance kill your Laravel app - here's how to actually fix it

MySQL
/integration/mysql-laravel/overview
48%
troubleshoot
Recommended

Fix MySQL Error 1045 Access Denied - Real Solutions That Actually Work

Stop fucking around with generic fixes - these authentication solutions are tested on thousands of production systems

MySQL
/troubleshoot/mysql-error-1045-access-denied/authentication-error-solutions
48%
tool
Recommended

Apache Kafka - The Distributed Log That LinkedIn Built (And You Probably Don't Need)

integrates with Apache Kafka

Apache Kafka
/tool/apache-kafka/overview
47%
tool
Similar content

Database Replication Guide: Overview, Benefits & Best Practices

Copy your database to multiple servers so when one crashes, your app doesn't shit the bed

AWS Database Migration Service (DMS)
/tool/database-replication/overview
47%
tool
Similar content

Alpaca Trading API Production Deployment Guide & Best Practices

Master Alpaca Trading API production deployment with this comprehensive guide. Learn best practices for monitoring, alerts, disaster recovery, and handling real

Alpaca Trading API
/tool/alpaca-trading-api/production-deployment
42%
tool
Similar content

Apache NiFi: Visual Data Flow for ETL & API Integrations

Visual data flow tool that lets you move data between systems without writing code. Great for ETL work, API integrations, and those "just move this data from A

Apache NiFi
/tool/apache-nifi/overview
41%
tool
Similar content

Node.js Production Deployment - How to Not Get Paged at 3AM

Optimize Node.js production deployment to prevent outages. Learn common pitfalls, PM2 clustering, troubleshooting FAQs, and effective monitoring for robust Node

Node.js
/tool/node.js/production-deployment
41%
tool
Similar content

AWS API Gateway Security Hardening: Protect Your APIs in Production

Learn how to harden AWS API Gateway for production. Implement WAF, mitigate DDoS attacks, and optimize performance during security incidents to protect your API

AWS API Gateway
/tool/aws-api-gateway/production-security-hardening
41%
tool
Similar content

Hugging Face Inference Endpoints: Secure AI Deployment & Production Guide

Don't get fired for a security breach - deploy AI endpoints the right way

Hugging Face Inference Endpoints
/tool/hugging-face-inference-endpoints/security-production-guide
41%
tool
Similar content

Chainlink Security Best Practices - Production Oracle Integration

Chainlink Security Architecture: Multi-layer security model with cryptographic proofs, economic incentives, and decentralized validation ensuring oracle integri

Chainlink
/tool/chainlink/security-best-practices
41%
tool
Similar content

Deploy OpenAI gpt-realtime API: Production Guide & Cost Tips

Deploy the NEW gpt-realtime model to production without losing your mind (or your budget)

OpenAI Realtime API
/tool/openai-gpt-realtime-api/production-deployment
39%
tool
Similar content

Supabase Production Deployment: Best Practices & Scaling Guide

Master Supabase production deployment. Learn best practices for connection pooling, RLS, scaling your app, and a launch day survival guide to prevent crashes an

Supabase
/tool/supabase/production-deployment
38%
tool
Similar content

Secure Apache Cassandra: Hardening Best Practices & Zero Trust

Harden Apache Cassandra security with best practices and zero-trust principles. Move beyond default configs, secure JMX, and protect your data from common vulne

Apache Cassandra
/tool/apache-cassandra/enterprise-security-hardening
37%
tool
Similar content

Node.js Security Hardening Guide: Protect Your Apps

Master Node.js security hardening. Learn to manage npm dependencies, fix vulnerabilities, implement secure authentication, HTTPS, and input validation.

Node.js
/tool/node.js/security-hardening
34%
tool
Similar content

Binance API Security Hardening: Protect Your Trading Bots

The complete security checklist for running Binance trading bots in production without losing your shirt

Binance API
/tool/binance-api/production-security-hardening
34%

Recommendations combine user behavior, content similarity, research intelligence, and SEO optimization