CDC works fine until it doesn't. Usually when someone does a bulk import at 2AM and crashes everything.
PostgreSQL WAL: The Disk Space Killer
I've been woken up at 3AM too many times by "disk full" alerts. PostgreSQL logical replication keeps WAL files around until ALL replication slots advance. One slow table holds up everything.
-- This query saved my ass more than once
SELECT slot_name,
       active,
       pg_size_pretty(pg_wal_lsn_diff(pg_current_wal_lsn(), restart_lsn)) as lag_size
FROM pg_replication_slots
ORDER BY pg_wal_lsn_diff(pg_current_wal_lsn(), restart_lsn) DESC;
Settings that actually matter (learned the hard way):
- `max_slot_wal_keep_size=4GB` - Set this or WAL will eat your entire fucking disk. I watched a server die at 95% disk usage because PostgreSQL just... stops working.
- `max_replication_slots=10` - Default 10 is a joke for production. We hit the limit with like 3 connectors.
- `wal_level=logical` - Yeah, obviously required, but I've spent an hour debugging "replication slot doesn't exist" only to find someone reset this to 'replica'
- `shared_preload_libraries='wal2json'` - Way better performance than pgoutput. Don't ask me why, it just is.
The PostgreSQL docs are actually decent on this stuff, unlike most database documentation.
MySQL: Even More Ways to Fail

MySQL binlog is somehow even more fragile. Debezium's MySQL connector tracks binlog positions, and if you lose position tracking, you're fucked. Either missing data or reprocessing everything from the beginning.
-- MySQL settings that prevent disasters
SET GLOBAL binlog_format = 'ROW';
SET GLOBAL binlog_row_image = 'FULL';
SET GLOBAL expire_logs_days = 7;
SET GLOBAL max_binlog_size = 1073741824;
Lost binlog position twice in production. First time was a MySQL restart without proper GTID configuration. Second time was a Debezium version upgrade that reset offsets. Both times = fun weekend debugging sessions.
Connection Pool Hell
CDC connectors hold database connections forever for replication slots. Meanwhile your app starts throwing FATAL: sorry, too many clients already during peak traffic.
PostgreSQL's default `max_connections=100` is a joke for production. Bump it to 300+, deploy PgBouncer or pgpool, and set up connection monitoring before this bites you:
SELECT count(*) FROM pg_stat_activity WHERE state = 'active';
The Kafka Complexity Explosion
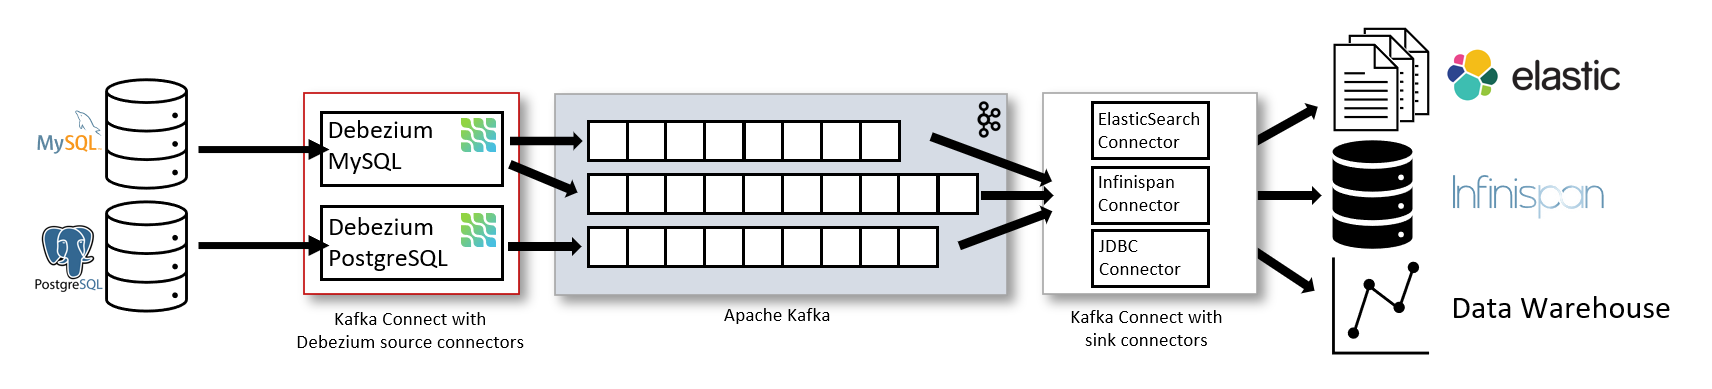
Standard CDC setup: PostgreSQL → Debezium → Kafka → Kafka Connect → Target. Five systems that each fail in creative ways:
- Network hiccups add 200ms latency spikes
- Kafka rebalancing stops everything for 30+ seconds
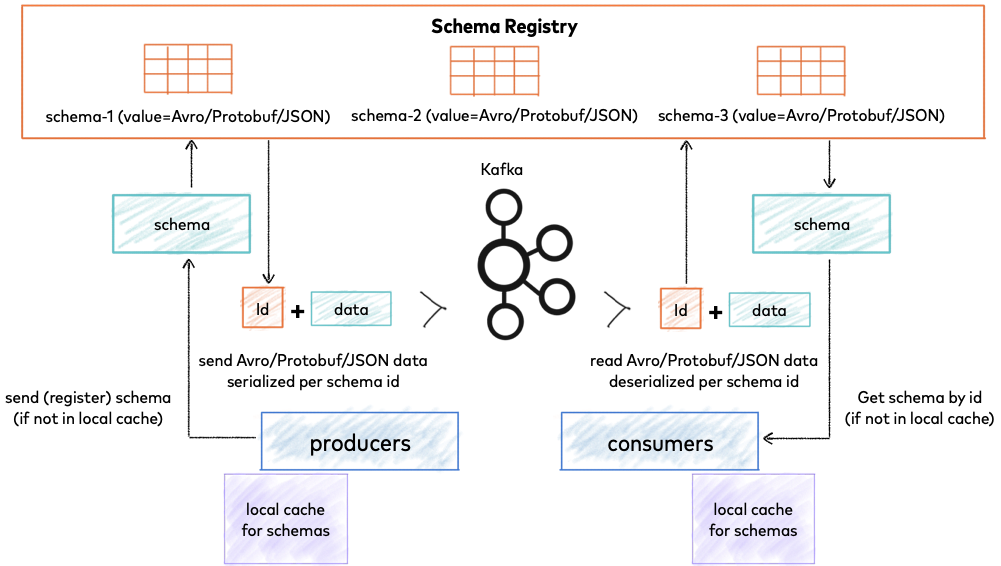
- Schema Registry goes down with zero useful error messages
- Offset commits fail and you lose an hour of data
Each component needs its own monitoring, alerting, and someone who understands its failure modes. The Debezium monitoring docs are actually helpful here, which is rare.
Memory and Resource Management
Debezium Memory Leaks: Debezium versions before 2.x have known memory leaks with large transactions. Processing a 2M row batch update at 4 AM can crash your connector with OOM errors.
TOAST Field Problems: PostgreSQL's TOAST mechanism for large fields (JSON, TEXT) causes Debezium to load entire field contents into memory. A single 50MB JSON document can crash your connector.
Kafka Connect Heap Issues: Default 1GB heap size isn't enough for high-throughput CDC. Most production deployments need 4-8GB heap with proper GC tuning:
## Kafka Connect JVM tuning for CDC workloads
export KAFKA_HEAP_OPTS=\"-Xmx4g -Xms4g\"
export KAFKA_JVM_PERFORMANCE_OPTS=\"-server -XX:+UseG1GC -XX:MaxGCPauseMillis=100\"
Network and Cross-AZ Latency
AWS Multi-AZ Reality: Vendors demo everything in single availability zones. Production requires multi-AZ deployment where cross-AZ latency averages 2-3ms but spikes to 50ms during peak hours.
Kafka Connect Distributed Mode makes this worse - connectors constantly rebalance when network hiccups, losing progress and creating lag spikes.
Performance Impact (your mileage will definitely vary):
- Single AZ: Usually around 200-300ms CDC latency, sometimes spikes to who-knows-what
- Multi-AZ: Anywhere from 2-5 seconds average, but I've seen it hit 30+ seconds when AWS is having a bad day
Fix: Deploy CDC infrastructure components in the same AZ despite the availability trade-offs. For most use cases, shorter consistent latency beats high availability promises.
The Schema Evolution Performance Trap
Schema Changes Kill Performance: Adding a NOT NULL column requires scanning every row to populate default values. During schema migration, CDC lag can spike from milliseconds to hours.
The Downstream Cascade: Schema changes trigger updates across the entire pipeline:
- Source database DDL causes WAL spike
- Debezium connector schema parsing slows down
- Kafka Schema Registry compatibility checks
- Downstream applications need schema updates
- Target systems require DDL propagation
Best Practice: Test schema changes in staging with actual CDC load running. A 10-second schema change can cause 2+ hours of CDC lag under load.
When CDC Performance Actually Matters
Don't optimize what doesn't need optimizing:
- Tables with <10K changes/day: batch ETL is simpler
- Analytics workloads that can tolerate 5+ minute delays
- Compliance reporting that requires batch processing anyway
Optimize aggressively when:
- Real-time fraud detection (sub-second requirements)
- Live dashboards for customer-facing applications
- Event-driven microservices that need immediate consistency
- Financial trading systems where milliseconds matter
The key is matching your optimization effort to actual business requirements, not pursuing theoretical performance gains.
But if you're still trying to pick the right CDC tool for your use case, let's talk about what these vendors actually deliver versus what they promise in their marketing...