How EFK Actually Works (And Why Your Logs Keep Disappearing)

The Reality of Distributed Logging

Your logs are scattered across 50 different places and when something breaks, you're fucked. EFK fixes this by sucking all your logs into one place so you can actually find the error that's crashing your app at 2am on Sunday.

What Each Component Actually Does

Elasticsearch Logo

Elasticsearch is your search engine. Think Google but for your application logs. It indexes everything so you can search for that specific NullPointerException instead of tailing log files like a caveman. Warning: Elasticsearch 8.10+ has a nasty bug where it crashes with OutOfMemoryError: Java heap space if you hit it with too many concurrent searches - plan your cluster sizing accordingly.

Fluentd collects logs from everywhere. Unlike Logstash which needs 200MB just to start up, Fluentd runs on 30MB and actually stays running. Written in Ruby but the important parts are in C, so it's fast where it matters. Pro tip: Fluentd 1.16.2 has a memory leak when processing JSON with null values - took me 6 hours to figure that out during a weekend outage. The tag-based routing means you can send different logs to different places without building a nightmare pipeline.

Kibana Logo

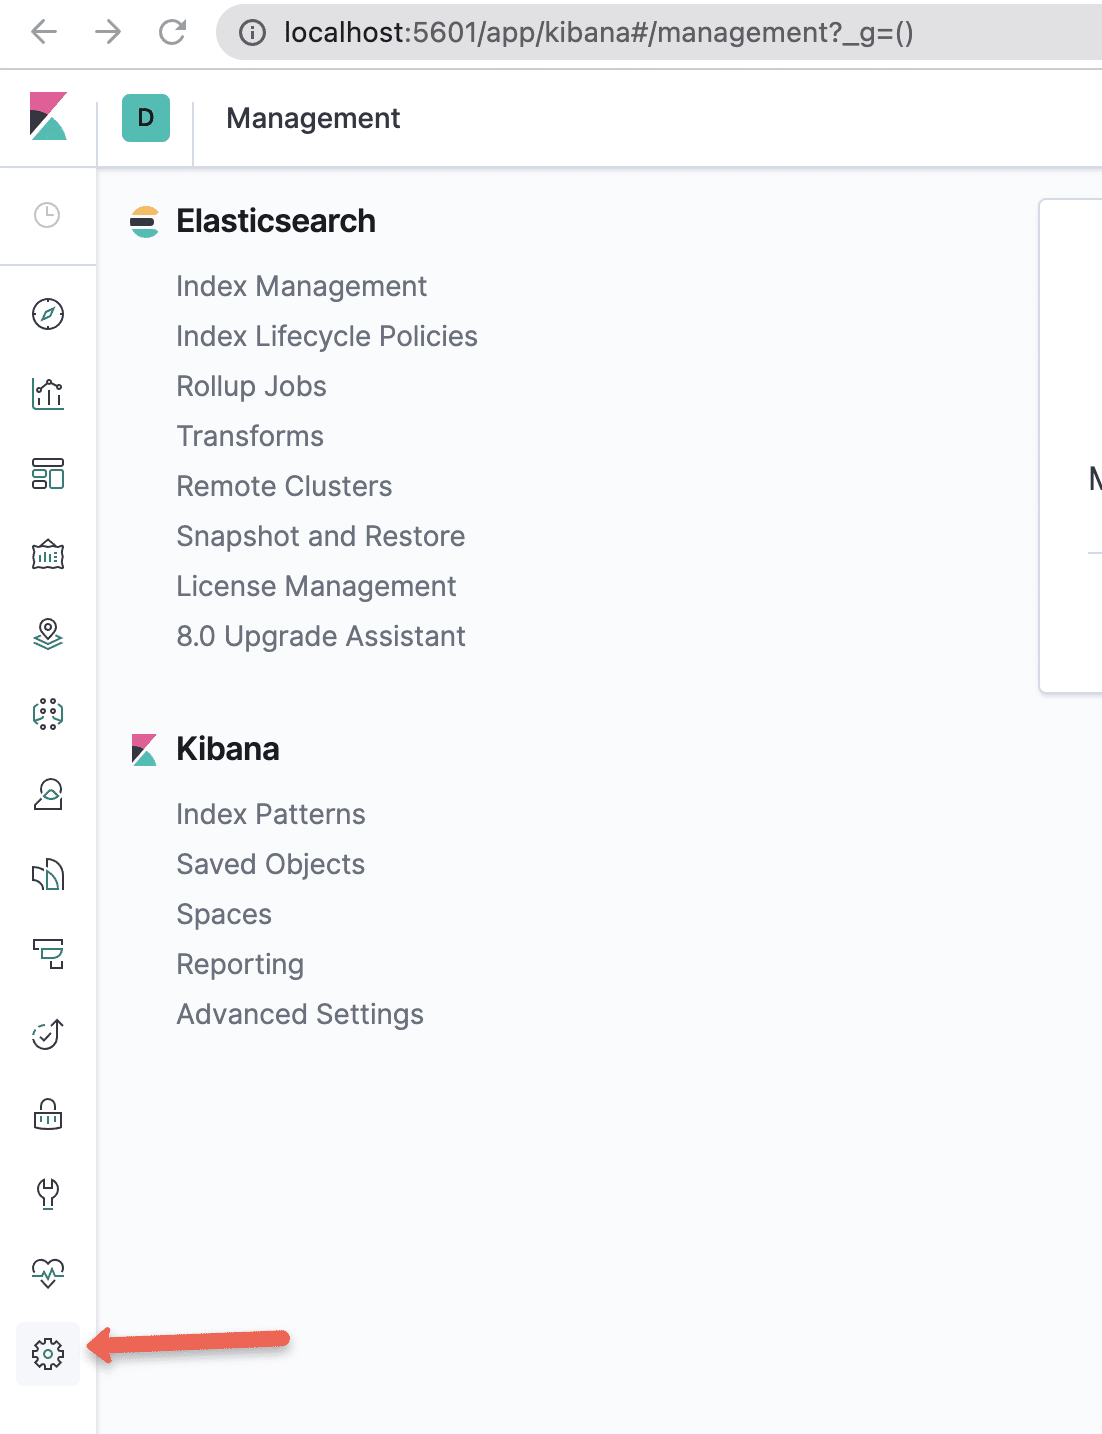
Kibana turns your logs into pretty graphs. More importantly, it lets you search and filter without having to remember Elasticsearch's query syntax every damn time.

Fluentd Forwarder-Aggregator Architecture

Deployment Patterns That Actually Work

Direct Setup: Every server sends logs straight to Elasticsearch. Works until you hit about 50 servers, then Elasticsearch starts choking on the connections and you get CONNECT_ERROR spam in your Fluentd logs. Good for getting started, bad for staying employed when it crashes during peak traffic.

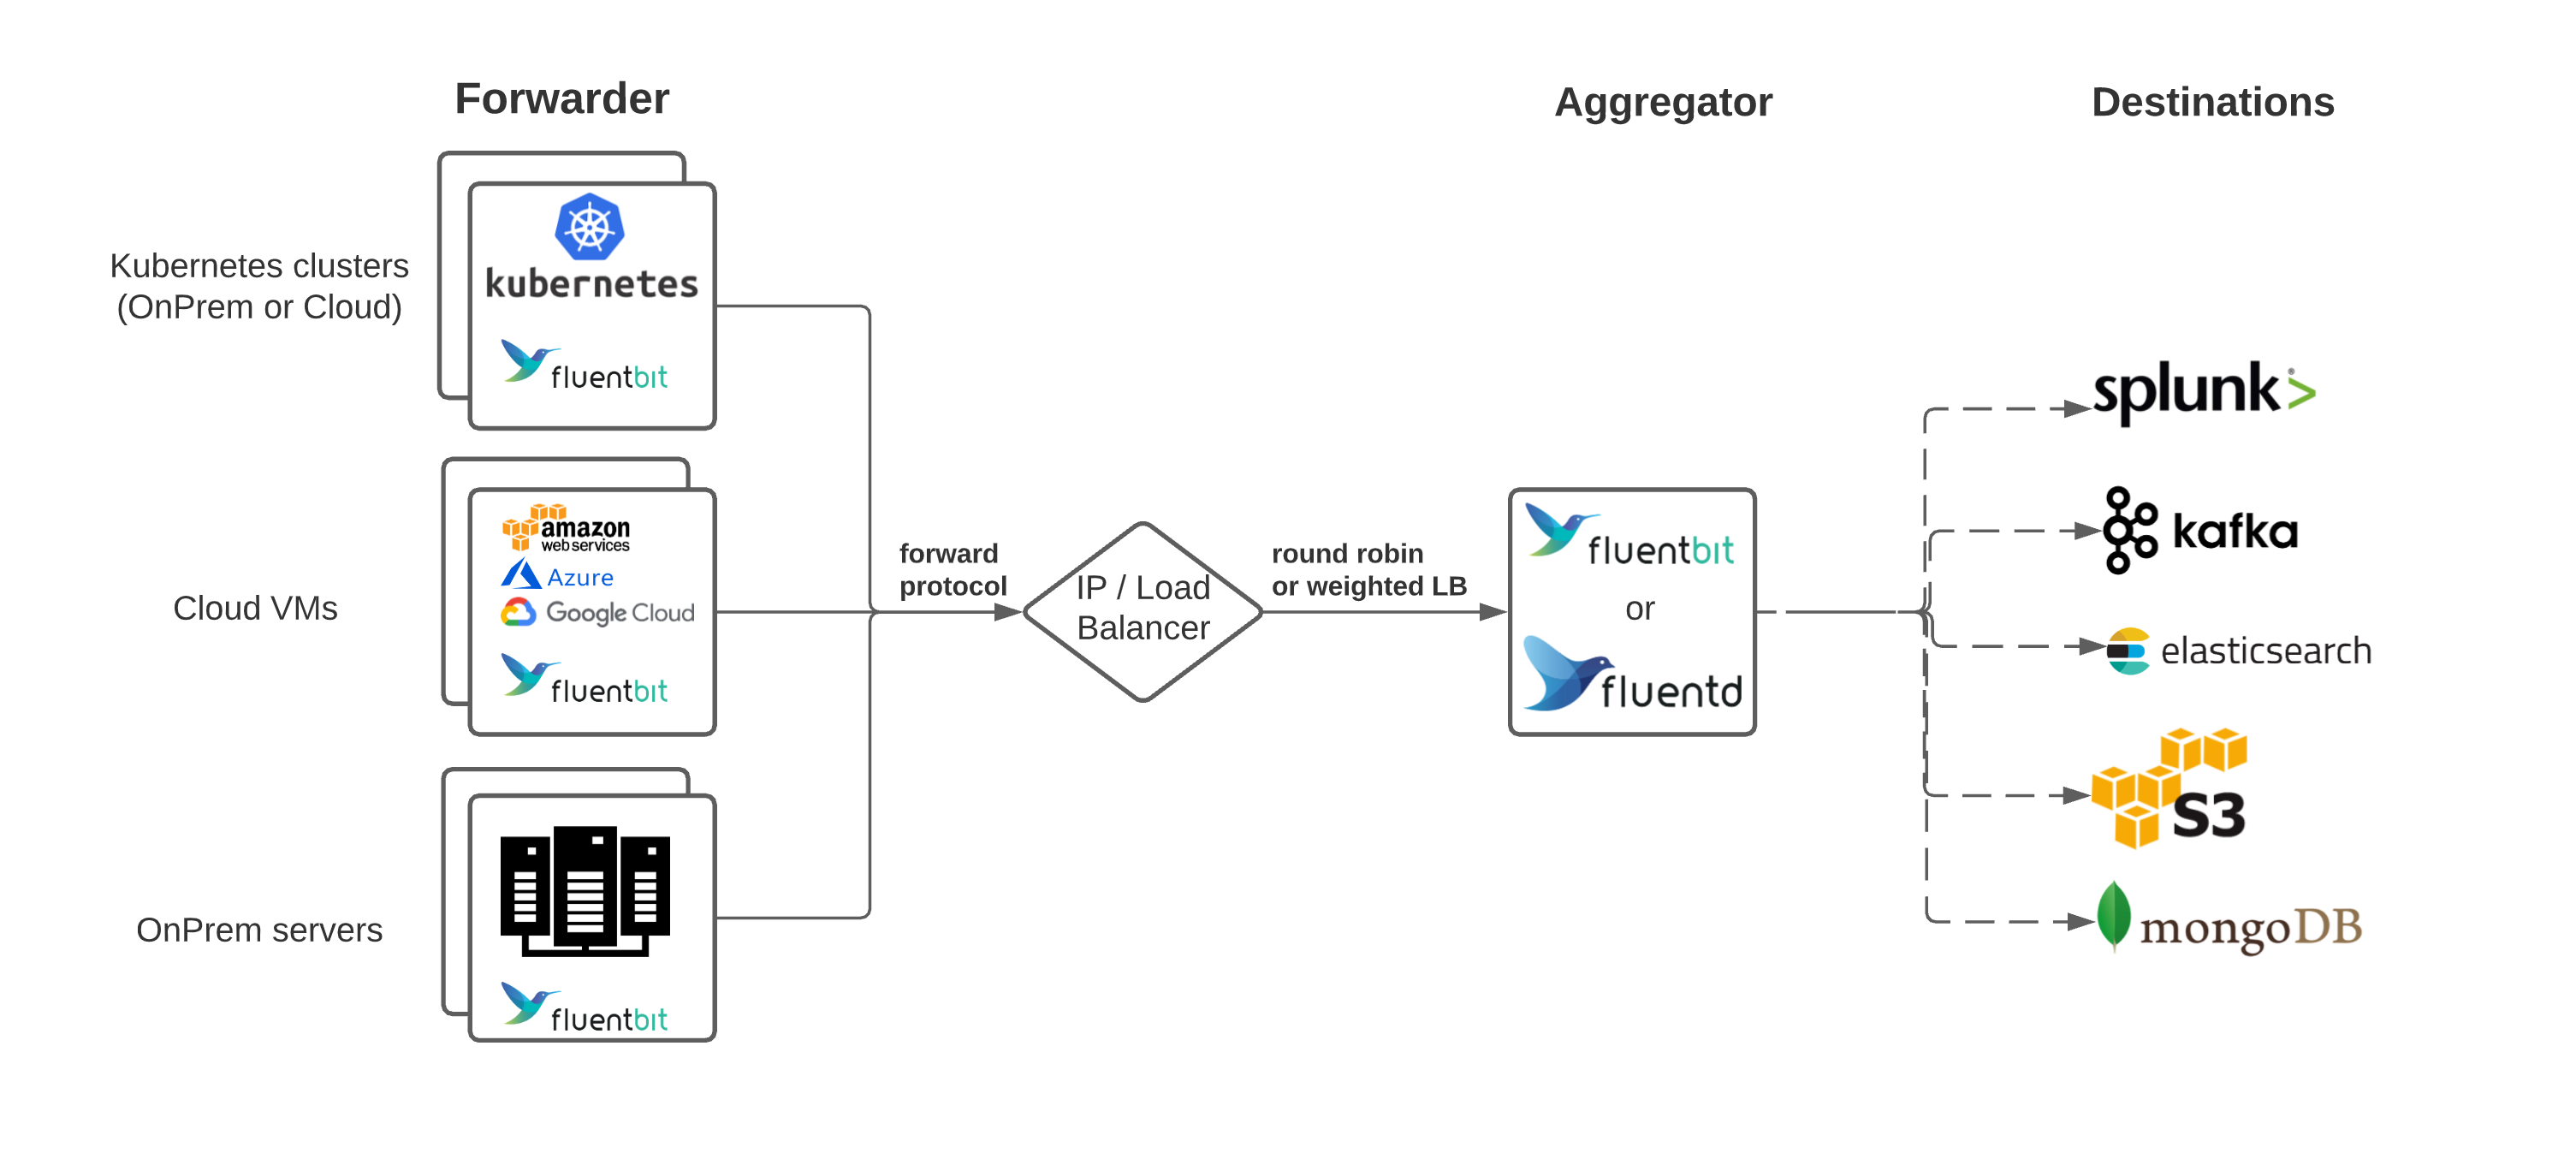
Aggregator Setup: Smart move - Fluentd agents forward to central Fluentd aggregators, which buffer and batch logs before sending to Elasticsearch. This is what you want in production because it handles network hiccups and load spikes without losing data.

Multi-Region Nightmare: If you're running across multiple clouds or regions, you'll need regional Elasticsearch clusters with cross-region forwarding. Expensive but necessary if you want sub-second query response times globally.

Performance Reality Check

Fluentd uses 30-40MB of memory. Logstash needs 200-300MB just to exist. In containers, this difference will save you serious money - we're talking 5x more Fluentd instances per node.

Elasticsearch scales horizontally, but here's what the docs don't tell you: your JVM heap hits a wall at 32GB. Beyond that, you need more nodes, not bigger ones. Plan for 1TB indexed per day to need about 3-4 data nodes with proper SSDs.

The dirty secret: Elasticsearch will crash if you run out of disk space with a cryptic blocked by: [FORBIDDEN/12/index read-only / allow delete (api)] error. Set up index lifecycle management or prepare to get paged at 3:15am when your logs fill the disk and everything stops working. Been there, done that, bought the t-shirt.

Setting Up EFK Without Losing Your Sanity

Kubernetes EFK Setup Architecture

Kibana Logo

Getting This Shit Running in Production

You're going to set this up wrong the first time. Everyone does. Here's how to avoid the worst mistakes that'll get you paged at 3am.

Elasticsearch Cluster Setup (The Hard Way vs The Right Way)

The Wrong Way: Single node Elasticsearch. Works great until it doesn't, then you lose everything and your boss wants to know why you didn't plan for failure. I watched one startup lose 3 weeks of logs this way - their single node died with corrupted index [cannot recover] and they had no backups.

The Right Way: Three separate node types because Elasticsearch is picky as hell:

  • Master nodes: At least 3, handles cluster decisions. Don't store data on these or they'll crash when your logs spike.
  • Data nodes: Where your logs actually live. 16-64GB RAM each, SSDs mandatory unless you enjoy watching paint dry.
  • Coordinating nodes: Optional but recommended - they handle search requests so your data nodes can focus on indexing.

Pro tip: If you only have 3 nodes total, run them as master+data nodes and pray nothing breaks during log spikes. Learned this during a production rollout when our data node hit circuit_breaker_exception and refused all new logs for 45 minutes.

## Elasticsearch config that won't crash immediately
cluster.name: \"efk-production\"
node.name: \"es-data-01\"
node.roles: [\"data\", \"ingest\"]
network.host: 0.0.0.0
discovery.seed_hosts: [\"es-master-01\", \"es-master-02\", \"es-master-03\"]
cluster.initial_master_nodes: [\"es-master-01\", \"es-master-02\", \"es-master-03\"]
xpack.security.enabled: true
## CRITICAL: Set this or your cluster will eat all available memory
indices.memory.index_buffer_size: 30%

Fluentd Setup (The Part That Actually Works)

DaemonSet Architecture: In Kubernetes, Fluentd runs as a DaemonSet - meaning one Fluentd pod per node automatically. This ensures comprehensive log collection across your entire cluster without manual scaling.

Kubernetes: Use a DaemonSet so every node gets a Fluentd pod. Don't try to be clever and collect logs from outside the cluster - it never works reliably.

Bare Metal: Install Fluentd on every server. Pain in the ass but necessary if you want logs from everything.

Here's a config that won't immediately break:

## Fluentd config that works in Kubernetes
<source>
  @type tail
  @id in_tail_container_logs
  path /var/log/containers/*.log
  pos_file /var/log/fluentd-containers.log.pos
  tag kubernetes.*
  read_from_head true
  <parse>
    @type json
    time_format %Y-%m-%dT%H:%M:%S.%NZ
  </parse>
</source>

<filter kubernetes.**>
  @type kubernetes_metadata
  @id filter_kube_metadata
</filter>

<match kubernetes.**>
  @type elasticsearch
  @id out_es
  host \"#{ENV['ELASTICSEARCH_HOST']}\"
  port 9200
  scheme https
  user \"#{ENV['ELASTICSEARCH_USER']}\"
  password \"#{ENV['ELASTICSEARCH_PASSWORD']}\"
  index_name fluentd-%Y.%m.%d
  # IMPORTANT: Use date-based indices or you'll have one giant index
  <buffer tag,time>
    timekey 1d
    flush_mode interval
    flush_interval 10s
  </buffer>
</match>

Security (Or Your Logs Will Be Public)

Enable TLS everywhere. Seriously. Your logs contain API keys, user data, and every mistake your developers made. Don't let them leak.

Set up basic auth at minimum:

Monitoring (So You Know When It's Broken)

Watch these metrics or you'll find out about problems from angry developers:

Elasticsearch:

  • Cluster health (red = everything is fucked)
  • JVM heap usage (>85% = about to crash)
  • Disk usage (>90% = cluster will lock up)

Fluentd:

  • Buffer queue length (growing = can't keep up)
  • Retry queue size (growing = Elasticsearch is rejecting data)
  • Plugin errors (anything > 0 needs investigation)

Set up alerts for disk usage hitting 85% or you'll get the dreaded flood stage disk watermark exceeded warning. When Elasticsearch runs out of space, it stops accepting new data and you lose logs. Takes about 30 seconds to go from "looking fine" to "completely fucked".

EFK vs ELK Stack Comparison

Feature

EFK Stack (Fluentd)

ELK Stack (Logstash)

Winner

Memory Usage

30-40MB baseline

200-300MB baseline

EFK

Performance

C-optimized core, Ruby plugins

JVM-based, slower startup

EFK

Configuration

Simple tag-based routing

Complex conditional logic

EFK

Plugin Ecosystem

500+ community plugins

200+ official plugins

EFK

Data Buffering

Persistent buffering built-in

Requires external tools (Redis/Kafka)

EFK

Container Support

Cloud-native design

Traditional JVM approach

EFK

Resource Efficiency

Lightweight, ideal for containers

Resource intensive

EFK

Learning Curve

Moderate

Steep

EFK

Enterprise Support

Community + commercial

Elastic official support

ELK

Parsing Capabilities

Built-in parsers

Plugin-based parsing

EFK

Using Fluentd for Centralized Logging in AKS and OpenShift by vlogize

## Finally, a Tutorial That Doesn't Skip the Hard Parts

Most EFK tutorials stop at "hello world" and leave you hanging when shit breaks in production. This one actually walks you through the messy reality of setting up a logging stack that won't collapse under load.

Video Tutorial: Using Fluentd for Centralized Logging in AKS and OpenShift
Duration: 25 minutes (concise and practical)
Level: For people who need this working in production Kubernetes environments

Watch: Using Fluentd for Centralized Logging in AKS and OpenShift

### What You Actually Learn (Not Just Marketing Bullets)

- How to set up a 3-node Elasticsearch cluster that won't split-brain when traffic spikes
- Fluentd forwarder/aggregator architecture so you don't lose logs when nodes restart
- Security config that won't get you fired when security audits your setup
- Kibana dashboards that actually help you find problems at 3am
- Performance tuning based on real traffic, not toy examples

### Why This Tutorial Doesn't Suck

Unlike the usual "follow these 10 steps" garbage, this shows:
- What to do when configurations fail (and they will)
- How to troubleshoot the inevitable memory issues
- Real production monitoring that alerts before everything breaks
- Load testing so you know your limits before users find them

Warning: This isn't a feel-good tutorial. The presenter shows you what breaks, why it breaks, and how to fix it. If you want hand-holding, find a different video.

📺 YouTube

Advanced Stuff That'll Save Your Ass (Eventually)

When Basic Setup Isn't Enough Anymore

Your EFK stack is working, logs are flowing, and then your company grows. Suddenly you need to separate dev logs from prod logs, different teams want their own dashboards, and compliance wants to know where you're storing customer data. Here's how to handle that without rebuilding everything.

Multi-Tenant Setup (Keeping Teams From Seeing Each Other's Disasters)

Different teams shouldn't see each other's logs. Period. Your payment team doesn't need to see marketing's failed email campaigns, and marketing definitely shouldn't see payment errors.

Use separate indices per tenant. Simple but effective - each team gets logs-teamname-YYYY.MM.DD indices. Add namespace or service labels to your logs and route accordingly.

## Tenant routing that actually works
<filter kubernetes.**>
  @type record_transformer
  <record>
    tenant ${record["kubernetes"]["namespace_name"]}
    environment ${record["kubernetes"]["labels"]["env"] || "unknown"}
  </record>
</filter>

<match kubernetes.**>
  @type elasticsearch
  # Separate indices per team and environment
  index_name logs-${tenant}-${environment}-%Y.%m.%d
  # This keeps prod and dev logs completely separate
</match>

Compliance (Because Lawyers Exist)

If you're storing customer data in logs (and you are, whether you know it or not), you need to handle GDPR, HIPAA, or whatever regulatory nightmare applies to you.

Step 1: Stop Logging Sensitive Shit
Step 2: Data Retention That Won't Get You Fired

Set up Index Lifecycle Management (ILM) to automatically delete old logs. Most companies keep 30-90 days unless there's a legal reason to keep more.

Disaster Recovery (When Everything Goes to Hell)

You will lose data. Plan for it. Here's how to minimize the damage:

Cross-Region Replication

If you can afford it, replicate critical indices to another region. Expensive but necessary if losing logs means losing your job. Watched one company lose their entire payment logging cluster when AWS us-east-1 shit the bed for 6 hours - they had zero backups.

Fluentd Buffering

Configure persistent buffers so when Elasticsearch goes down, Fluentd keeps logs on disk until it's back up.

## Buffer config that won't lose your logs
<buffer tag,time>
  @type file
  path /var/log/fluentd-buffers/
  flush_mode interval
  flush_interval 30s
  chunk_limit_size 256MB
  queue_limit_length 512
  retry_type exponential_backoff
  retry_wait 1s
  retry_max_times 10
  # CRITICAL: Without this, you lose logs when Fluentd restarts
  flush_at_shutdown true
</buffer>

Performance Tuning (Making It Not Suck)

Elasticsearch Memory Rule

Give JVM heap 50% of system memory, max 32GB. More than 32GB and Java's compressed pointers break, making everything slower.

SSD or Go Home

Spinning disks are death for Elasticsearch. You'll spend more on engineering time troubleshooting search_phase_execution_exception errors and 30-second query timeouts than you'll save on storage. Took our team 2 weeks to figure out why searches were timing out - turned out the cluster was on HDD.

Fluentd Threading

Use `flush_thread_count` to parallelize writes to Elasticsearch. Start with 4 threads per CPU core, tune from there.

Docker Logo

Machine Learning (If You're Into That Sort of Thing)

Elasticsearch has built-in anomaly detection that actually works. It'll automatically learn your log patterns and alert when something weird happens.

Useful for catching performance degradation before your users notice, or security incidents before they become breaches. Just don't expect it to replace actual monitoring - it's supplemental, not primary.

Frequently Asked Questions - EFK Stack Integration

Q

What are the main differences between EFK and ELK stacks?

A

EFK uses Fluentd, ELK uses Logstash. Fluentd eats 30-40MB of memory while Logstash needs 200-300MB just to exist. In containers, this matters

  • you can run 5x more Fluentd instances per node. Fluentd also has persistent buffering built-in, so when Elasticsearch crashes (and it will), you don't lose logs.
Q

How much logging can I afford? Elasticsearch eats disk space like a monster

A

Rule of thumb: 1GB of logs = 1.5-2GB of disk with compression.

But here's the real shit

  • start with 3 nodes minimum or prepare for split-brain hell. Give each data node 16-64GB RAM and SSDs or you'll hate your life. Quick math: 100GB logs/day = 150-200GB disk/day = 4.5TB/month = $500-1000/month on AWS. Plan your budget accordingly.
Q

What's the Kubernetes deployment that won't immediately break?

A

Use a DaemonSet with the official fluent/fluentd-kubernetes-daemonset image.

Give it 200Mi memory and 200m CPU minimum

  • any less and it'll crash under load with OOMKilled status. CRITICAL: Mount a persistent volume for buffers or you'll lose logs every time the pod restarts.

I learned this during a production incident at 3:17am on a Saturday when we lost 4 hours of payment logs because the pod restarted and buffers were in tmpfs.

Q

How do I stop logging credit card numbers and passwords like an idiot?

A

Strip sensitive data in Fluentd BEFORE it hits Elasticsearch. Use record_transformer to redact fields or grep to drop entire log lines. Regex patterns like /\\d{4}-\\d{4}-\\d{4}-\\d{4}/ catch credit cards. Pro tip: Set up alerts when sensitive patterns are detected. Better to find out from your own monitoring than from a security audit.

Q

What's the index strategy that won't bankrupt me?

A

Use daily indices: logs-YYYY.MM.DD. Set up Index Lifecycle Management to automatically delete old data after 30-90 days unless lawyers say otherwise. Hot → warm → cold → delete. Hot = fast SSDs for recent data. Warm = slower storage for searchable history. Cold = cheap storage for compliance. Delete = gone forever.

Q

How do I know when everything is fucked?

A

Watch these metrics or find out the hard way:

  • Cluster health: Red = everything is broken, yellow = something is broken
  • Disk usage: >90% = cluster locks up and stops accepting data with cluster_block_exception
  • JVM heap: >85% = about to crash with OutOfMemoryError
  • Fluentd buffer queue: Growing = can't keep up with log volume and you'll get buffer overflow errors
    Set up alerts at 85% thresholds. When shit hits the fan at 2:30am, you want to know before your users start tweeting about your site being down.
Q

What security do I actually need vs security theater?

A

Must-have: TLS everywhere, API keys for service accounts, network firewalls blocking ports 9200/9300/5601 from public internet.
Nice-to-have: RBAC if you have multiple teams, LDAP/SAML if your company demands it.
Security theater: Field-level encryption (just don't log sensitive data), complex audit logging (use your SIEM instead).

Q

Why is Elasticsearch eating all my memory?

A

JVM heap over 32GB?

You fucked up

  • compressed pointers break and everything gets slower. Keep heap at 50% of system memory, max 32GB. High memory usually means: too many fields in your mapping, queries doing huge aggregations, or field data cache exploding.

Fix your log structure first, tune queries second. Spent a whole weekend debugging OutOfMemoryError: Java heap space because someone was logging JSON with 500+ dynamic fields per message.

Q

Can I send logs to multiple places without going insane?

A

Use Fluentd's copy plugin to send to multiple destinations. Works great for sending to both Elasticsearch and your SIEM, or dev/prod clusters. Export metrics to Prometheus with elasticsearch_exporter. Just don't try to get fancy with routing

  • keep it simple or you'll spend weeks debugging why some logs disappear.
Q

What's the backup strategy that actually works when you need it?

A

Automated snapshots to S3/GCS/Azure every night. Store them cross-region if you're paranoid (and you should be).
Test your restores monthly or they'll fail when you actually need them. I've seen too many "backup strategies" that were just "backup hopes." Watched one company discover their S3 snapshots were corrupted during a real disaster - they lost 2 months of customer support logs.
RTO = how long you can be down. RPO = how much data you can lose. Know these numbers or your CEO will teach them to you at 4am when everything's on fire.

Q

How do I make Fluentd handle high volume without exploding?

A

Increase flush_thread_count to 4-8 threads. Use persistent buffers sized according to your peak log volume. If one Fluentd can't handle the load, use multiple aggregator nodes with load balancing. Or switch to Fluent Bit on edges with Fluentd for aggregation.

Q

How much storage do I need for X months of logs?

A

Math: Daily log volume × 1.5-2x compression ratio × days retention = total storage needed.
Example: 100GB/day × 1.5 × 90 days = 13.5TB for 3 months retention.
Use tiered storage: hot SSDs for recent data, cheap spinning disks for archives. Your wallet will thank you. We cut our logging costs by 60% moving 30+ day logs to cold storage - just don't expect fast queries on the old stuff.