The Four Ways PostgreSQL Will Ruin Your Day

PostgreSQL breaks in basically four ways, and figuring out which one you're dealing with saves you hours of random troubleshooting. After debugging the same stupid issues hundreds of times, here's what actually goes wrong and how to tell the difference.

Connection Refused - PostgreSQL's Favorite "Fuck You"

PostgreSQL Memory Architecture

'Connection refused' is PostgreSQL's way of telling you absolutely nothing useful about what's broken. Could be the service is down, could be firewall, could be config - you get to guess!

The bullshit error messages you'll see:

  • psql: could not connect to server: Connection refused - Service isn't running or can't reach it
  • FATAL: the database system is starting up - Database is recovering, give it a minute
  • timeout expired - Network is fucked or server is overloaded
  • Random connection drops - Usually connection limits or network flakiness

Start with the obvious shit first: Is the service actually running? sudo systemctl status postgresql will tell you. If it's not running, start it. If it keeps dying, check the logs at /var/log/postgresql/ because PostgreSQL actually puts useful info there (unlike most software).

Network issues are next. `telnet hostname 5432` or `nc -zv hostname 5432` will tell you if you can reach the damn thing. If that fails, it's network or firewall - not a PostgreSQL problem. Google Cloud's troubleshooting guide covers most connectivity scenarios you'll encounter. This medium article walks through both easy and complex connection fixes.

Authentication Type 10 Not Supported (The SCRAM-SHA-256 Disaster)

This one kills production regularly because PostgreSQL 13+ defaults to SCRAM-SHA-256 authentication but older JDBC drivers (anything before 42.2.0) don't support it. The Stack Overflow thread has 268k views because everyone hits this.

These errors mean your client is too old:

  • The authentication type 10 is not supported
  • FATAL: password authentication failed for user (after SCRAM upgrade)
  • FATAL: no pg_hba.conf entry for host (when pg_hba.conf is correct)

Fix it by upgrading your JDBC driver to 42.2.0 or newer. Don't downgrade PostgreSQL security to MD5 unless you hate your security team.

The pg_hba.conf file will make you want to quit: Entries are processed top to bottom, case sensitivity matters, and one wrong character breaks everything. The order is TYPE, DATABASE, USER, ADDRESS, METHOD. Get it wrong and nothing works.

Performance Issues (When Everything Runs Like Molasses)

PostgreSQL Performance Analysis

Slow queries are usually missing indexes, but PostgreSQL gives you actual tools to figure out what's broken instead of guessing.

Signs your database is dying:

EXPLAIN ANALYZE is your best friend: It tells you exactly where the bottleneck is. Look for "Seq Scan" on large tables - that's usually your problem. If you see that, create an index and watch performance magically improve.

Lock contention happens when transactions block each other. Check pg_stat_activity for queries stuck in "waiting" state. Kill the blocker with SELECT pg_terminate_backend(pid) if needed. Monitor lock statistics to catch blocking before it kills performance. The official kernel resources documentation explains shared memory and lock table limits that cause these issues.

Memory Errors (When PostgreSQL Eats Everything)

"Out of shared memory" usually means too many connections doing stupid things or locks gone wild. The OOM killer loves PostgreSQL processes because they're big, juicy targets.

Memory death symptoms:

shared_buffers at 25% of RAM works until you need the other 75% for something else. Don't set `max_connections` to 1000 unless you want to see what "thrashing" really means. The comprehensive troubleshooting guide from Dev.to explains exactly how TOO_MANY_CONNECTIONS errors happen and what to do about them. DataDog's troubleshooting guide covers monitoring setup that prevents memory disasters.

Start With the Dumb Shit First

Before diving into complex diagnostics, check the obvious things that waste hours:

  1. Is the service running? (systemctl status postgresql)
  2. Can you reach it? (nc -zv hostname 5432)
  3. Is the disk full? (df -h)
  4. Are there any recent config changes? (check git history)
  5. Did someone restart something? (check logs)

This catches 60% of "mysterious" PostgreSQL issues and saves you from looking stupid when the problem is a stopped service.

The Actual Fixes That Work (After Hours of Pain)

Stop fucking around with tutorials and use the fixes that actually work in production. These are the solutions that saved my ass when PostgreSQL decided to break at 2am.

Connection Refused - Start With The Obvious Shit

"Connection refused" tells you nothing useful, so work through this checklist like a robot:

Step 1: Is The Damn Service Running?

## This tells you everything you need to know
sudo systemctl status postgresql

## If it's dead, start it
sudo systemctl start postgresql

## Make it auto-start so you don't get paged again
sudo systemctl enable postgresql

Real talk: 40% of "mysterious connection issues" are just stopped services. Some junior dev probably ran systemctl stop postgresql during testing and forgot to start it back up.

Step 2: Can You Actually Reach The Server?

## Does port 5432 respond?
nc -zv hostname 5432

## Or the old-school way
telnet hostname 5432

## Check if it's listening locally
netstat -tlnp | grep 5432

If `netstat` shows nothing on port 5432, PostgreSQL isn't listening. Check your `postgresql.conf` for `listen_addresses = '*'` and `port = 5432`. Don't make me explain why listen_addresses = 'localhost' won't work for remote connections.

Step 3: Configuration Files (Where Dreams Go To Die)

## Find the config files (they're never where you expect)
sudo find /etc -name "postgresql.conf" 2>/dev/null
sudo find /var/lib -name "postgresql.conf" 2>/dev/null

## Check the listening settings
grep -n "listen_addresses" /path/to/postgresql.conf
grep -n "port" /path/to/postgresql.conf

Ubuntu puts config files in `/etc/postgresql/15/main/`. CentOS puts them in /var/lib/pgsql/data/. Docker containers put them wherever the fuck they want. Plan accordingly. The PostgreSQL tutorial on architectural fundamentals explains the client-server connection model that makes these config files so important. This detailed PostgreSQL architecture guide shows how connection handling actually works under the hood.

Authentication Type 10 - The SCRAM-SHA-256 Nightmare

This error has a 268k-view Stack Overflow thread because it breaks everyone's day eventually.

The error: The authentication type 10 is not supported

What happened: PostgreSQL 13+ defaults to SCRAM-SHA-256 authentication. Your JDBC driver is from 2018 and doesn't support it.

Fix It The Right Way (Upgrade Your Driver)

<!-- In your pom.xml - anything 42.2.0+ works -->
<dependency>
    <groupId>org.postgresql</groupId>
    <artifactId>postgresql</artifactId>
    <version>42.6.0</version>  <!-- Current as of 2025 -->
</dependency>

Don't downgrade PostgreSQL security to MD5 unless you want your security team to murder you. Upgrade the client instead.

pg_hba.conf Will Make You Want To Quit

This file is processed top to bottom. First match wins. Case sensitivity matters. One wrong character breaks everything.

## Find the file (good luck)
sudo find /etc -name "pg_hba.conf" 2>/dev/null

## Edit carefully
sudo nano /etc/postgresql/15/main/pg_hba.conf

## Reload config (don't restart unless you hate uptime)
sudo systemctl reload postgresql

Working pg_hba.conf patterns:

## Local connections
local   all             postgres                        peer
local   all             all                             scram-sha-256

## Remote connections  
host    all             all             192.168.1.0/24  scram-sha-256

Performance Issues - When Everything Runs Like Shit

EXPLAIN ANALYZE Is Your Best Friend

Skip the guessing. PostgreSQL tells you exactly what's slow:

-- This shows you the actual bottleneck
EXPLAIN (ANALYZE, BUFFERS) 
SELECT * FROM users u 
JOIN orders o ON u.id = o.user_id 
WHERE u.created_at > '2024-01-01';

Look for these red flags:

  • Seq Scan on tables with >10k rows - Missing index
  • actual time way higher than cost - Bad statistics
  • Buffers: shared read=50000 - Lots of disk I/O
  • never executed - Wrong estimates, dead code path

If you see Seq Scan on a million-row table, create a fucking index. PostgreSQL isn't psychic.

Index Creation That Actually Helps

-- Create indexes without locking the table
CREATE INDEX CONCURRENTLY idx_users_created_at ON users (created_at);

-- Composite indexes for multi-column WHERE clauses
CREATE INDEX CONCURRENTLY idx_orders_user_status 
ON orders (user_id, status) 
WHERE status IN ('pending', 'processing');

-- Check if indexes are being used
SELECT schemaname, tablename, indexname, idx_scan 
FROM pg_stat_user_indexes 
WHERE idx_scan = 0 
ORDER BY pg_relation_size(indexrelid) DESC;

Pro tip: CREATE INDEX CONCURRENTLY takes longer but doesn't lock your table. Use it in production or deal with angry users.

Memory Issues - When PostgreSQL Eats Everything

work_mem Will Bite You In The Ass

PostgreSQL 15+ changed how work_mem works. Each query node can use work_mem, and parallel queries multiply this by worker count. Set it too high and the OOM killer murders your database.

-- Check current settings
SHOW work_mem;
SHOW hash_mem_multiplier;  -- New in PG 15, defaults to 2.0

-- Monitor memory usage
SELECT 
    pid, 
    usename,
    query,
    state,
    backend_start
FROM pg_stat_activity 
WHERE state != 'idle'
ORDER BY backend_start;

Real example: work_mem = 200MB with 4 parallel workers = 1GB per operation. Got 5 parallel sorts? That's 5GB of RAM gone instantly. PostgreSQL process architecture guides explain how PostgreSQL process architecture multiplies memory usage. The GeeksforGeeks system architecture guide covers the client-server model that affects memory allocation. Crunchy Data's distributed architectures overview discusses memory considerations at scale.

The OOM Killer Loves PostgreSQL

When your system runs out of memory, Linux's OOM killer picks the biggest process and murders it. PostgreSQL processes are usually the biggest targets.

## Check if OOM killer has been active
sudo dmesg | grep -i "killed process"

## Monitor memory usage
free -h
cat /proc/meminfo | grep -E "(MemTotal|MemAvailable|SwapTotal)"

Prevention:

## Prevent memory over-commit (dangerous but effective)
sudo sysctl -w vm.overcommit_memory=2

## Or tune PostgreSQL memory conservatively
## shared_buffers = 25% of RAM
## work_mem = (Available RAM - shared_buffers) / max_connections / 4

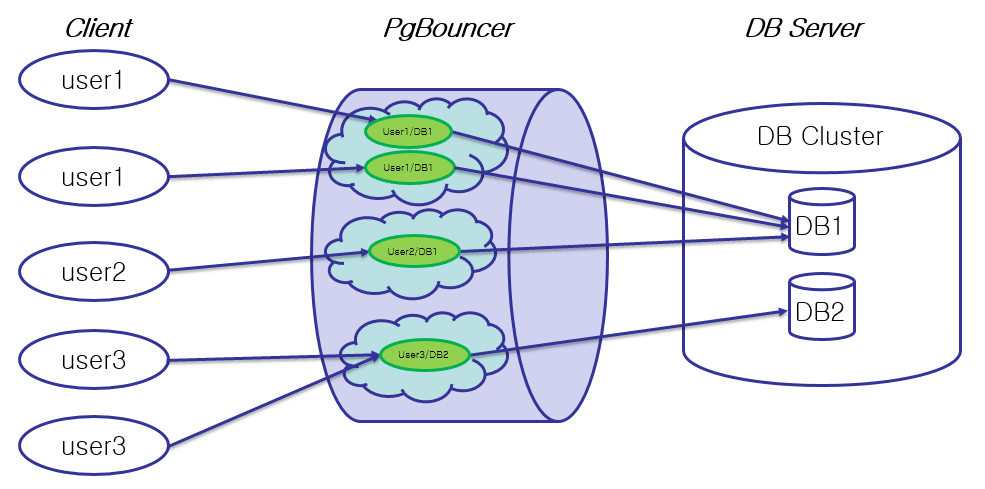
Connection Limits and PgBouncer

"Too many clients already" means you hit max_connections. Don't just increase the limit - that makes memory problems worse.

-- Check connection usage
SELECT count(*) as current_connections FROM pg_stat_activity;
SELECT setting FROM pg_settings WHERE name = 'max_connections';

-- Kill idle connections
SELECT pg_terminate_backend(pid) 
FROM pg_stat_activity 
WHERE state = 'idle' 
AND backend_start < now() - interval '1 hour';

PgBouncer Connection Pooling Architecture

Use PgBouncer instead of raising connection limits:

[databases]
production = host=localhost port=5432 dbname=production

[pgbouncer]
listen_addr = 127.0.0.1
listen_port = 6432
pool_mode = transaction
max_client_conn = 1000
default_pool_size = 25

PgBouncer connection pooling prevents connection exhaustion and reduces memory usage. It's the only connection pooler that actually works consistently. Hussein Nasser's detailed process architecture explanation shows why connection pooling is critical for PostgreSQL. The YugabyteDB architecture guide explains process-based architecture that makes connection limits so important. Instaclustr's PostgreSQL fundamentals covers component interactions that connection pooling optimizes.

The Nuclear Option (When Everything Else Fails)

Sometimes PostgreSQL is so fucked that you need the nuclear option:

## Stop PostgreSQL
sudo systemctl stop postgresql

## Check for abandoned lock files
sudo rm -f /var/lib/postgresql/15/main/postmaster.pid

## Start fresh
sudo systemctl start postgresql

## Check logs for what went wrong
sudo tail -f /var/log/postgresql/postgresql-15-main.log

This kills active connections and might cause data loss. Only use when you're already down and nothing else works.

Questions DBAs Actually Ask At 3AM

Q

Why the hell do I keep getting "connection refused"?

A

Because the service isn't running, genius. Run sudo systemctl status postgresql first. If it's dead, start it with sudo systemctl start postgresql. If you keep getting paged for this, add sudo systemctl enable postgresql so it auto-starts.Still broken? Check if it's actually listening: netstat -tlnp | grep 5432. No output? PostgreSQL isn't listening. Fix your postgresql.conf file.

Q

"Database system is starting up" - how long do I wait?

A

Give it 30-60 seconds. PostgreSQL is probably doing crash recovery or replaying WAL files. If it's still bitching after 2 minutes, check the logs at /var/log/postgresql/ for what's actually wrong.Out of disk space kills this every time. df -h will tell you if you're fucked.

Q

"Too many clients already" - what now?

A

You hit the connection limit.

Don't just increase max_connections

  • that makes everything worse.First, kill idle connections:```sqlSELECT pg_terminate_backend(pid) FROM pg_stat_activity WHERE state = 'idle' AND backend_start < now()
  • interval '1 hour';```Then implement PgBouncer connection pooling before this happens again.
Q

Connection timeouts driving me insane?

A

Network or firewall issue. Test with telnet hostname 5432. If that hangs, it's network. If it connects then closes immediately, firewall is blocking Postgre

SQL traffic.Server overload also causes timeouts. Check top and iostat

  • if CPU is pegged or I/O wait is high, you found your problem.
Q

"Password authentication failed" but the password is correct?

A

PostgreSQL 13+ uses SCRAM-SHA-256 by default. Your ancient JDBC driver doesn't support it. Upgrade to postgresql-42.6.0 or newer in your pom.xml.Don't downgrade to MD5 authentication unless you want security to hate you.

Q

"No pg_hba.conf entry for host" - what the fuck does this mean?

A

pg_hba.conf doesn't have a rule allowing your connection. This file is processed top-to-bottom, first match wins.Add something like:host all all 192.168.1.0/24 scram-sha-256Then reload with sudo systemctl reload postgresql (don't restart unless you hate uptime).

Q

"Permission denied for database" after authentication works?

A

User exists but has no database permissions. Grant them:sqlGRANT CONNECT ON DATABASE your_db TO username;GRANT USAGE ON SCHEMA public TO username;GRANT SELECT, INSERT, UPDATE, DELETE ON ALL TABLES IN SCHEMA public TO username;

Q

"Role does not exist" error?

A

The user doesn't exist. Create it:sqlCREATE USER username PASSWORD 'secure_password';Role names are case-sensitive. Check your application config matches exactly.

Q

Everything is slow as shit - where do I start?

A

Run EXPLAIN ANALYZE on your slow queries.

Look for:

  • Seq Scan on large tables = missing indexes
  • High actual time vs cost = bad statistics
  • Buffers: shared read=50000 = lots of disk I/OIf you see sequential scans on million-row tables, create a fucking index.
Q

How do I find which queries are killing performance?

A

Enable pg_stat_statements:sqlCREATE EXTENSION pg_stat_statements;SELECT query, calls, total_exec_time, mean_exec_time FROM pg_stat_statements ORDER BY total_exec_time DESC;This shows you the actual problem queries, not your guesses.

Q

"Could not extend file" error - disk full?

A

Yeah, you ran out of disk space. df -h confirms it.Clean up old logs, move the data directory to bigger storage, or provision more disk. PostgreSQL can't create new files when the disk is full.

Q

VACUUM taking forever and blocking everything?

A

Large table + lots of dead tuples + concurrent transactions = vacuum hell.

Kill long-running transactions first:```sql

SELECT pid, query, state, now()

  • query_start as runtime FROM pg_stat_activity WHERE state != 'idle' ORDER BY runtime DESC;```Use VACUUM (PARALLEL 4) on multi-core systems for faster processing.
Q

"Out of shared memory" killing my database?

A

Lock table is full. Increase max_locks_per_transaction from 64 to 256 in postgresql.conf, then restart PostgreSQL.Check what's holding locks: SELECT * FROM pg_locks;

Q

OOM killer murdering PostgreSQL processes?

A

You're using too much memory.

The Linux OOM killer picks the biggest process and murders it

  • usually PostgreSQL.Check memory usage: free -hTune down shared_buffers, work_mem, and maintenance_work_mem. Or add more RAM.
Q

"Remaining connection slots reserved" error?

A

Superuser connection slots are reserved. Regular users can't connect when you hit the limit.Kill unnecessary connections or increase max_connections. But really, implement connection pooling with PgBouncer.

Q

"Data directory has wrong ownership" on startup?

A

File permissions are fucked. Fix with:bashsudo chown -R postgres:postgres /var/lib/postgresql/sudo chmod 700 /var/lib/postgresql/*/main/Usually happens after someone runs PostgreSQL as root (don't do this).

Q

PostgreSQL won't start after config changes?

A

Syntax error in your config file. Check with:bashsudo -u postgres /usr/lib/postgresql/*/bin/postgres --check-conf -D /var/lib/postgresql/*/main/Read the error message and fix the syntax. Or restore the previous config if you're desperate.

Don't Let PostgreSQL Ruin Your Weekend

After getting paged at 3am too many times, here's how to prevent the most common disasters that kill PostgreSQL in production. Skip the theory - these are battle-tested practices that actually work.

Connection Pooling (Do This Or Suffer)

Don't increase `max_connections` to 1000 thinking it'll solve connection issues. That just makes everything worse by consuming too much memory. Use PgBouncer instead.

PgBouncer Setup That Actually Works

[databases]
production = host=localhost port=5432 dbname=production

[pgbouncer]
listen_addr = 127.0.0.1
listen_port = 6432
pool_mode = transaction
max_client_conn = 1000
default_pool_size = 25
reserve_pool_size = 5

Transaction pooling is the sweet spot - sessions get recycled between transactions. Statement pooling is more aggressive but breaks prepared statements. Session pooling defeats the purpose.

PgBouncer is the only connection pooler that works consistently. PgPool is a nightmare to configure and debug. Avoid it. Uptrace's monitoring tools guide shows why connection pooling monitoring is critical. AppSignal's automated dashboard demonstrates proper connection pool monitoring in production.

Monitor Connections Before They Kill You

Set up alerts for when connection usage hits 80% of max_connections:

-- Check current connection usage
SELECT 
    count(*) as current_connections,
    setting::int as max_connections,
    round(100.0 * count(*) / setting::int, 2) as pct_used
FROM pg_stat_activity, pg_settings 
WHERE name = 'max_connections';

When this hits 80%, investigate. When it hits 95%, start killing idle connections or you're going down.

Memory Configuration (Before OOM Killer Murders You)

PostgreSQL Shared Buffers Analysis

The Linux OOM killer loves PostgreSQL because it has big, juicy processes. Tune memory conservatively or watch your database die.

Memory Settings That Don't Kill Your Server

## shared_buffers: Start at 25% of RAM, tune from there
shared_buffers = 2GB

## work_mem: Be very careful with this one
work_mem = 32MB

## maintenance_work_mem: Higher is better for VACUUM
maintenance_work_mem = 256MB

## effective_cache_size: OS cache + shared_buffers estimate
effective_cache_size = 6GB

work_mem in PostgreSQL 15+ is dangerous - parallel queries multiply it by worker count. Hash operations use `hash_mem_multiplier` (default 2.0). Set it too high and OOM killer murders everything.

Check For OOM Killer Activity

## See if OOM killer has been busy
sudo dmesg | grep -i \"killed process\"
sudo journalctl | grep -i \"memory\"

## Monitor memory usage
free -h
cat /proc/meminfo | grep -E \"(MemAvailable|SwapTotal)\"

If you see PostgreSQL processes getting killed, you're using too much memory. Tune it down or add more RAM.

Authentication (Before SCRAM-SHA-256 Breaks Everything)

PostgreSQL 13+ uses SCRAM-SHA-256 by default. Old drivers don't support it. Plan for this or spend your weekend fixing authentication failures.

Keep SCRAM But Update Drivers

Don't downgrade to MD5 - your security team will hate you. Update your drivers instead:

  • Java: PostgreSQL JDBC 42.2.0+
  • Python: psycopg2 2.8.0+
  • Node.js: pg 7.8.0+
  • .NET: Npgsql 4.0.0+

pg_hba.conf Rules That Don't Suck

## Local connections
local   all         postgres                      peer
local   all         all                           scram-sha-256

## Remote connections (be specific about networks)
host    all         all         192.168.1.0/24    scram-sha-256
hostssl all         all         10.0.0.0/8        scram-sha-256

## Never do this in production
## host  all         all         0.0.0.0/0         trust

Process order matters. Specific rules first, general rules last. Test changes in dev before pushing to production.

Performance Monitoring (Find Problems Before Users Do)

PostgreSQL Buffer Cache Analysis

Enable pg_stat_statements or you're debugging blind:

-- Add to postgresql.conf
shared_preload_libraries = 'pg_stat_statements'

-- Create extension
CREATE EXTENSION pg_stat_statements;

Queries That Find Performance Problems

-- Top queries by total time
SELECT 
    query,
    calls,
    total_exec_time,
    mean_exec_time
FROM pg_stat_statements 
ORDER BY total_exec_time DESC 
LIMIT 10;

-- Queries doing full table scans
SELECT 
    schemaname,
    tablename,
    seq_scan,
    seq_tup_read,
    idx_scan,
    n_tup_ins + n_tup_upd + n_tup_del as writes
FROM pg_stat_user_tables 
WHERE seq_scan > 1000 
AND seq_tup_read / seq_scan > 10000;

If seq_scan is high on large tables, you need indexes. If mean_exec_time is growing over time, you need VACUUM or better statistics. The pgDash monitoring solution provides comprehensive performance diagnostics for these scenarios. Prometheus PostgreSQL exporter gives you open-source monitoring with Grafana integration. Sysdig's monitoring guide explains key PostgreSQL metrics to track with Prometheus.

Index Maintenance You Can't Skip

-- Find unused indexes wasting space
SELECT 
    schemaname,
    tablename,
    indexname,
    idx_scan,
    pg_size_pretty(pg_relation_size(indexrelid)) as size
FROM pg_stat_user_indexes 
WHERE idx_scan = 0 
AND pg_relation_size(indexrelid) > 1048576  -- > 1MB
ORDER BY pg_relation_size(indexrelid) DESC;

Drop unused indexes. They waste space, slow down writes, and make backups bigger.

Disk Space Monitoring (Before PostgreSQL Dies)

PostgreSQL fails hard when it runs out of disk space. Monitor aggressively:

## Check disk usage
df -h /var/lib/postgresql/

## Find what's using space
du -sh /var/lib/postgresql/*/main/*

## Clean up old WAL files (if archiving is broken)
find /var/lib/postgresql/*/main/pg_wal -name \"*.backup\" -mtime +7 -delete

Set alerts at 80% disk usage. At 90%, start cleaning up. At 95%, you're probably fucked.

Backup Strategy (Because Shit Happens)

Have backups that work, not backups that exist:

#!/bin/bash
## Simple backup that actually works
BACKUP_DIR=\"/backup/postgresql\"
DATE=$(date +%Y%m%d_%H%M%S)
DB=\"production\"

## Dump with custom format (allows parallel restore)
pg_dump -Fc -h localhost -U postgres $DB > \"$BACKUP_DIR/${DB}_${DATE}.backup\"

## Test the backup can be read
pg_restore --list \"$BACKUP_DIR/${DB}_${DATE}.backup\" > /dev/null

if [ $? -eq 0 ]; then
    echo \"Backup successful: ${DB}_${DATE}.backup\"
else
    echo \"Backup failed: ${DB}_${DATE}.backup\"
    exit 1
fi

## Clean up old backups
find \"$BACKUP_DIR\" -name \"*.backup\" -mtime +30 -delete

Test your backups by restoring them. Backups you can't restore are useless. Schedule monthly restore tests to a dev environment.

Log Configuration That Helps Debugging

PostgreSQL Instance Configuration

## Log queries taking longer than 1 second
log_min_duration_statement = 1000

## Log all connection attempts (helps with auth debugging)  
log_connections = on
log_disconnections = on

## Log checkpoints (helps with I/O tuning)
log_checkpoints = on

## Don't log every statement (too much noise)
log_statement = 'none'

Rotate logs or they'll fill your disk. Use logrotate or similar to manage log files.

The goal is preventing 3am pages, not perfect optimization. Better to be conservative with settings and stable than aggressive and broken.

Resources That Actually Help (Not Marketing Bullshit)

Troubleshooting Remote Connection Issues to PostgreSQL on CentOS 7 by vlogize

# PostgreSQL Connection Troubleshooting Video Tutorial

## Remote Connection Issues Resolution Guide

This 12-minute video demonstrates practical PostgreSQL remote connection troubleshooting on CentOS 7, covering the most common connection configuration issues and their solutions.

Key topics covered:
- 0:00 - Introduction and problem identification
- 2:30 - PostgreSQL service verification and startup
- 5:15 - pg_hba.conf configuration for remote access
- 8:45 - Firewall configuration and port management
- 10:30 - Testing connections and validation

Watch: Troubleshooting Remote Connection Issues to PostgreSQL on CentOS 7

Why this video helps: Provides hands-on demonstration of the most common PostgreSQL connection troubleshooting steps, showing actual command-line procedures for service management, configuration file editing, and network connectivity testing. The tutorial covers real-world scenarios that match the connection issues described in this troubleshooting guide.

📺 YouTube

Related Tools & Recommendations

compare
Similar content

PostgreSQL vs. MySQL vs. MongoDB: Enterprise Scaling Reality

When Your Database Needs to Handle Enterprise Load Without Breaking Your Team's Sanity

PostgreSQL
/compare/postgresql/mysql/mongodb/redis/cassandra/enterprise-scaling-reality-check
100%
tool
Similar content

ClickHouse Overview: Analytics Database Performance & SQL Guide

When your PostgreSQL queries take forever and you're tired of waiting

ClickHouse
/tool/clickhouse/overview
96%
tool
Similar content

Neon Production Troubleshooting Guide: Fix Database Errors

When your serverless PostgreSQL breaks at 2AM - fixes that actually work

Neon
/tool/neon/production-troubleshooting
86%
tool
Similar content

SQLite Performance Optimization: Fix Slow Databases & Debug Issues

Your database was fast yesterday and slow today. Here's why.

SQLite
/tool/sqlite/performance-optimization
82%
tool
Similar content

SQLite: Zero Configuration SQL Database Overview & Use Cases

Zero Configuration, Actually Works

SQLite
/tool/sqlite/overview
81%
troubleshoot
Similar content

Fix MongoDB "Topology Was Destroyed" Connection Pool Errors

Production-tested solutions for MongoDB topology errors that break Node.js apps and kill database connections

MongoDB
/troubleshoot/mongodb-topology-closed/connection-pool-exhaustion-solutions
80%
alternatives
Similar content

PostgreSQL Alternatives: Escape Production Nightmares

When the "World's Most Advanced Open Source Database" Becomes Your Worst Enemy

PostgreSQL
/alternatives/postgresql/pain-point-solutions
77%
tool
Similar content

PostgreSQL: Why It Excels & Production Troubleshooting Guide

Explore PostgreSQL's advantages over other databases, dive into real-world production horror stories, solutions for common issues, and expert debugging tips.

PostgreSQL
/tool/postgresql/overview
73%
tool
Similar content

Neon Serverless PostgreSQL: An Honest Review & Production Insights

PostgreSQL hosting that costs less when you're not using it

Neon
/tool/neon/overview
67%
pricing
Similar content

PostgreSQL vs MySQL vs MongoDB: Database Hosting Cost Comparison

Compare the true hosting costs of PostgreSQL, MySQL, and MongoDB. Get a detailed breakdown to find the most cost-effective database solution for your projects.

PostgreSQL
/pricing/postgresql-mysql-mongodb-database-hosting-costs/hosting-cost-breakdown
67%
integration
Recommended

OpenTelemetry + Jaeger + Grafana on Kubernetes - The Stack That Actually Works

Stop flying blind in production microservices

OpenTelemetry
/integration/opentelemetry-jaeger-grafana-kubernetes/complete-observability-stack
67%
compare
Recommended

PostgreSQL vs MySQL vs MariaDB vs SQLite vs CockroachDB - Pick the Database That Won't Ruin Your Life

alternative to cockroachdb

cockroachdb
/compare/postgresql-mysql-mariadb-sqlite-cockroachdb/database-decision-guide
64%
tool
Similar content

PostgreSQL Logical Replication: When Streaming Isn't Enough

Unlock PostgreSQL Logical Replication. Discover its purpose, how it differs from streaming replication, and a practical guide to setting it up, including tips f

PostgreSQL
/tool/postgresql/logical-replication
63%
tool
Similar content

Change Data Capture (CDC) Troubleshooting Guide: Fix Common Issues

I've debugged CDC disasters at three different companies. Here's what actually breaks and how to fix it.

Change Data Capture (CDC)
/tool/change-data-capture/troubleshooting-guide
59%
tool
Similar content

etcd Overview: The Core Database Powering Kubernetes Clusters

etcd stores all the important cluster state. When it breaks, your weekend is fucked.

etcd
/tool/etcd/overview
58%
tool
Similar content

Debug Kubernetes Issues: The 3AM Production Survival Guide

When your pods are crashing, services aren't accessible, and your pager won't stop buzzing - here's how to actually fix it

Kubernetes
/tool/kubernetes/debugging-kubernetes-issues
56%
tool
Similar content

Supabase Production Deployment: Best Practices & Scaling Guide

Master Supabase production deployment. Learn best practices for connection pooling, RLS, scaling your app, and a launch day survival guide to prevent crashes an

Supabase
/tool/supabase/production-deployment
54%
howto
Similar content

MySQL to PostgreSQL Production Migration: Complete Guide with pgloader

Migrate MySQL to PostgreSQL without destroying your career (probably)

MySQL
/howto/migrate-mysql-to-postgresql-production/mysql-to-postgresql-production-migration
52%
tool
Similar content

Supabase Overview: PostgreSQL with Bells & Whistles

Explore Supabase, the open-source Firebase alternative powered by PostgreSQL. Understand its architecture, features, and how it compares to Firebase for your ba

Supabase
/tool/supabase/overview
52%
compare
Similar content

PostgreSQL vs MySQL vs MariaDB - Performance Analysis 2025

Which Database Will Actually Survive Your Production Load?

PostgreSQL
/compare/postgresql/mysql/mariadb/performance-analysis-2025
48%

Recommendations combine user behavior, content similarity, research intelligence, and SEO optimization