This is where the rubber meets the road. That smooth development experience? Gone. Supabase's connection limits are brutal in production. Free tier gets 200 connections, Pro gets 500. That sounds like a lot until you realize your Next.js API routes eat connections like candy.
I learned this the hard way when our SaaS app got featured on Product Hunt. We went from 20 concurrent users to 500 in an hour. App completely shit itself with remaining connection slots are reserved errors. Spent the whole night frantically implementing connection pooling while losing signups.
The issue is serverless functions. Each API route opens its own connection. With Next.js, that means every /api/* endpoint grabs a connection. Add middleware, auth checks, and React Server Components, and you're burning through your connection pool faster than a crypto mining rig burns electricity.
The nuclear option that saves your ass:
postgresql://postgres:[PASSWORD]@db.[REF].supabase.co:6543/postgres?pgbouncer=true
Use transaction pooling mode. Session pooling is tempting but fucking useless - it keeps connections open forever. Transaction mode releases connections after each query, which is exactly what you want for serverless.
Note: Supabase is transitioning from pgbouncer to Supavisor for better scaling, but the ?pgbouncer=true parameter still works and automatically routes to the new pooler. Don't overthink it - just use it. Read more about Supavisor 1.0 and connection pooling best practices.
This single parameter saved me from a weekend of explaining to the CEO why our conversion rate dropped to zero.
RLS Is Fine Until It Isn't

Row Level Security is amazing in development. Production? RLS debugging makes me want to quit programming and become a goat farmer.
The error message that will haunt your dreams:
ERROR: insufficient_privilege
This tells you absolutely fucking nothing. Could be expired JWTs, could be type mismatches, could be missing policies, could be Jupiter in retrograde. Who knows? Not Supabase's error messages.
I spent 8 hours debugging this once. The issue? My development JWT was valid for 24 hours, but production tokens expired after 1 hour. auth.uid() was returning null for half my users, bypassing all security.
The debugging nightmare starts here:
Your SQL editor uses admin context. Your app uses user context. Different contexts, different results. That policy that works perfectly in the dashboard? Broken in production because context matters. See RLS Performance and Best Practices and this GitHub discussion on RLS optimization.
-- This is how you actually test RLS (not the dashboard fantasy)
SELECT set_config('request.jwt.claims', '{\"sub\":\"[REAL_USER_ID]\",\"role\":\"authenticated\"}', true);
SELECT * FROM profiles WHERE user_id = auth.uid();
The policy that actually works in production:
CREATE POLICY \"users_own_data\" ON profiles
  FOR ALL USING (
    auth.uid() IS NOT NULL AND
    auth.uid()::text = user_id::text
  );
That IS NOT NULL check saved my career. Without it, expired tokens bypass your entire security model. The text casting prevents UUID comparison failures that fail silently and drive you insane. More details on RLS query performance and optimization strategies.
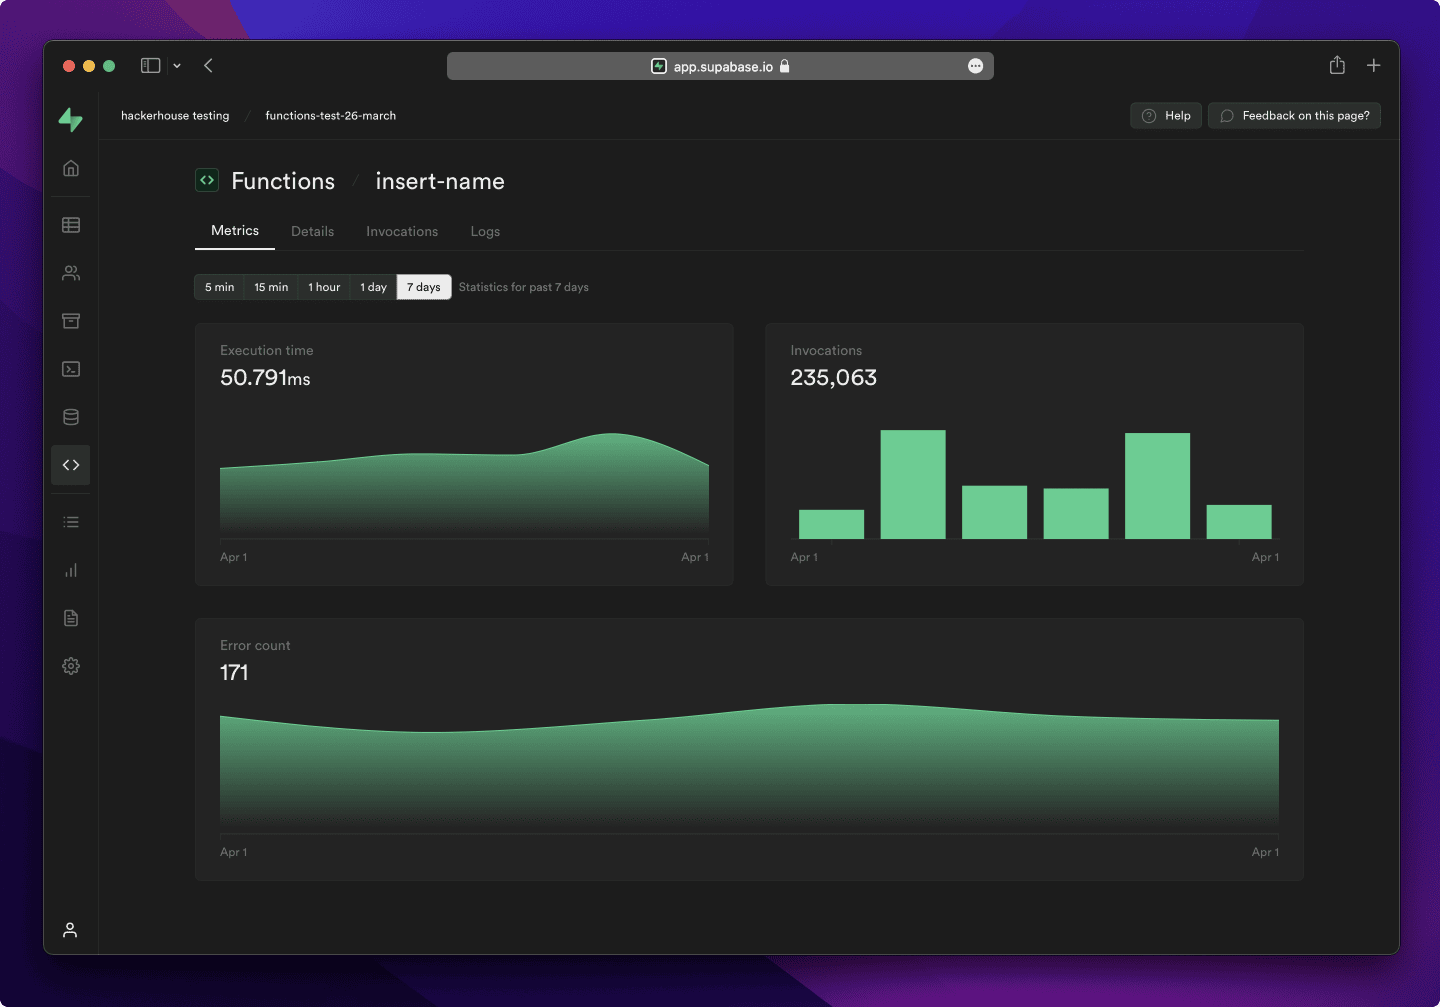
Edge Functions Are Surprisingly Weak

Supabase Edge Functions look powerful until you try to process anything bigger than a tweet. Memory limits are tighter than a Python developer's grip on their type hints.
I tried to process a 5MB CSV upload once. Function crashed faster than my motivation on Monday morning. Turns out Edge Functions aren't designed for heavy lifting - they're for lightweight API endpoints and simple transforms.
The killer is loading entire files into memory:
// This crashes and burns with anything over 2MB
const content = await file.text();
const processed = await processLargeFile(content);

// This actually works (discovered after losing a weekend)
const stream = file.stream().pipeThrough(new ProcessingTransform());
Deployment reality check:
## This works
supabase functions deploy --project-ref [REF]

## This probably won't work the first time
supabase secrets set --project-ref [REF] API_KEY=value
Test with realistic file sizes, not the 10KB test files that make everything look fine. And handle errors properly because Edge Functions fail in creative ways. Check out Functions performance tips and Edge Functions logging.
Real-Time Features Work Until They Don't
Supabase real-time is fantastic for demos. Production real-time is where dreams go to die.
Works great with 50 users. At 200 users, connections start dropping randomly. Mobile is even worse - every time someone walks under a bridge or switches from WiFi to cellular, boom, connection gone.
I built a collaborative editor thinking real-time would just work. It did, until users started actually collaborating. Connections dropping mid-edit, phantom cursors everywhere, data inconsistencies that made users think the app was possessed.
The reconnection dance that sort of works:
const reconnectWithBackoff = (attempt = 1) => {
  const delay = Math.min(1000 * Math.pow(2, attempt), 30000);
  setTimeout(() => channel.subscribe(), delay);
};

channel.subscribe((status) => {
  if (status === 'CHANNEL_ERROR') {
    reconnectWithBackoff();
  }
});
Real talk: Use polling for notifications, feeds, and dashboards. Real-time is only worth the headache for truly interactive features like collaborative editing or live chat. Everything else? Just poll every 5 seconds and save yourself the pain. Learn about Realtime postgres changes and WebSocket scaling patterns.
Storage Costs Will Surprise You
Supabase Storage bandwidth pricing is where they get you. $0.09/GB sounds cheap until you realize user-generated content adds up fast.
Our first month with video uploads? $800 bandwidth bill on a $25 Pro plan. Turns out users love uploading 100MB videos that get viewed once. Who knew?
How to not go broke:
Image transformations are your friend: ?width=800&quality=80 turns a 5MB upload into a 200KB download. Use them religiously.
// This saves your budget
const { data, error } = await supabase.storage
  .from('uploads')
  .upload(fileName, file, {
    cacheControl: '3600', // Cache for 1 hour
    upsert: false,
    onUploadProgress: (progress) => {
      setUploadProgress(progress.loaded / progress.total);
    }
  });
CDN caching drops your costs to $0.03/GB but setup is a pain. Lifecycle policies help but require planning. Mostly just pray users don't upload 4K videos. See Storage optimizations and CDN integration patterns.
Database Tuning Is Not Optional
Default PostgreSQL settings are fine for your 10-user MVP. Production traffic? Your database will cry.
The Supabase dashboard gives you basic settings, but you need to understand what actually matters. Most people focus on max_connections when they should care about work_mem and query performance.
The queries that will kill you:
-- This shows what's actually slow
SELECT query, calls, total_time, mean_time
FROM pg_stat_statements
ORDER BY total_time DESC
LIMIT 10;

-- This shows what's stuck right now
SELECT * FROM pg_stat_activity
WHERE state = 'active' AND query_start < now() - interval '30 seconds';
Indexes you actually need:
-- Without these, your API will be dog slow
CREATE INDEX CONCURRENTLY idx_profiles_user_id ON profiles(user_id);
CREATE INDEX CONCURRENTLY idx_posts_created_at ON posts(created_at DESC);

-- Full-text search will destroy your database without this
CREATE INDEX CONCURRENTLY idx_posts_search ON posts USING gin(to_tsvector('english', title || ' ' || content));
CONCURRENTLY prevents table locks but takes longer. Skip it if your users can handle 30 seconds of downtime (they can't). More on database indexing best practices and PostgreSQL performance tuning.
Monitoring That Actually Helps

Supabase's built-in monitoring is like a smoke detector without batteries - looks good until you need it.
The dashboard shows pretty graphs but misses the stuff that actually breaks. Connection spikes, slow queries, authentication failures - you'll find out when users complain, not from your monitoring.
Set up real alerts:
// This logs stuff you can actually debug
export default async function handler(req: Request) {
  const startTime = Date.now();
  const requestId = crypto.randomUUID();

  try {
    const result = await processRequest(req);

    console.log(JSON.stringify({
      event: 'function_success',
      duration: Date.now() - startTime,
      path: req.url,
      requestId
    }));

    return new Response(JSON.stringify(result));
  } catch (error) {
    console.error(JSON.stringify({
      event: 'function_error',
      error: error.message,
      duration: Date.now() - startTime,
      path: req.url,
      requestId,
      stack: error.stack
    }));

    throw error;
  }
}
Alert thresholds that matter:
- Database connections > 400 (80% of Pro limit)
- Any query taking > 10 seconds
- Error rate > 5% for 5+ minutes
- Real-time connections dropping 50+ in a minute
The built-in monitoring won't catch these until it's too late. Set up proper telemetry and metrics, use application performance monitoring, and consider external monitoring solutions.