The SQLite Performance Fixes That Actually Work

WAL Mode Will Save Your Ass (Then Stab You in the Back)

SQLite Architecture

SQLite's default journal mode is complete garbage. Every single write blocks all the readers and syncs to disk like three times. WAL mode fixes most of this bullshit by writing to a separate log file instead.

PRAGMA journal_mode = WAL;

But WAL mode isn't magic - it comes with its own special ways to fuck you over.

Docker for Mac silently breaks everything: Spent a whole week wondering why our dev environment was dog slow compared to production. Turns out WAL mode just... doesn't work on Docker for Mac. Something about the osxfs filesystem not supporting shared memory properly, so SQLite 3.39 quietly falls back to DELETE journal mode. No errors, no warnings, no "hey your WAL mode didn't actually enable" - just mystery slowness. Found this buried in some random SQLite forum post.

Your backup script is probably broken: WAL creates three files instead of one: the main .db file plus .db-wal and .db-shm. Our backup script cheerfully copied just the .db file for like six months. Nobody noticed until we needed to restore and discovered half our data was sitting in the uncopied WAL file. That was a fun Monday morning.

Synchronous=FULL is Database Performance Cancer

The default synchronous=FULL waits for the OS to pinky-promise that every single byte made it to disk before continuing. This makes everything crawl.

PRAGMA synchronous = NORMAL;

In WAL mode, NORMAL is usually safe enough. Yeah, you might lose a few seconds of data if someone trips over the power cord, but your database won't corrupt. Unless you're processing financial transactions or medical records, NORMAL is probably fine.

Real performance difference: Last month I had a database doing like 30-60 writes/sec in FULL mode - honestly painful to watch. Switched to NORMAL and we hit somewhere around 3K writes/sec. Not sure the exact numbers but it went from "users complaining constantly" to "nobody gives a shit anymore."

When you need FULL mode: If losing the last few form submissions during a power outage would end your business, stick with FULL. But most web apps can handle losing a few seconds of data rather than having everything crawl.

Memory Mapping: Great Until Your App Gets OOMKilled
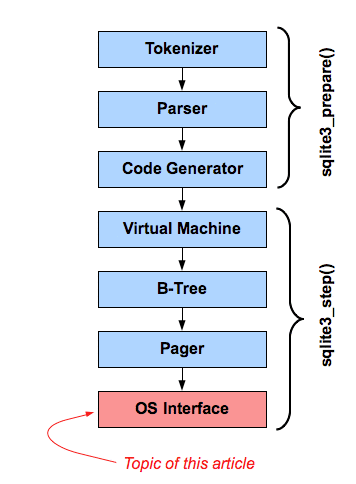
Memory Mapping Visualization

PRAGMA mmap_size = 268435456;  -- 256MB

Memory mapping lets SQLite read directly from RAM instead of making system calls. Works great until you run out of memory and everything swaps.

The Kubernetes OOMKill disaster: Set mmap_size to 2GB on a 4GB container limit and the Linux kernel just murdered our app when it tried to allocate memory for other stuff. Exit code 137 - OOMKilled. Happened on three different projects before I learned to never mmap more than like 50% of available memory.

Platform bullshit: Linux handles memory mapping well. macOS has weird virtual memory behavior that makes large memory maps unpredictable. Windows... just don't. Seriously.

Individual INSERTs Will Ruin Your Life

Here's the thing that kills SQLite performance more than anything else: doing one INSERT at a time. Each individual statement is basically its own transaction that sits around waiting for the disk to acknowledge it wrote the data.

Had this import script that was taking fucking forever - I think it was like 4-5 hours for maybe 200K records? Turns out every INSERT was its own transaction, so SQLite was syncing to disk 200K times. Added BEGIN/COMMIT around the whole batch and it dropped to like 8 minutes. Felt pretty stupid.

-- This will kill your weekend
for row in data:
    INSERT INTO users (name, email) VALUES (?, ?);

-- Do this instead
BEGIN;
for row in data:
    INSERT INTO users (name, email) VALUES (?, ?);
COMMIT;

Don't batch everything though: Tried batching like 400K inserts in one transaction and the whole database locked up for god knows how long. Everything else got "database is locked" and users started bitching. Now I do batches of maybe 5-10K records - seems to work without pissing anyone off.

"Database is locked" hell: This error message is useless. Could be a hanging transaction, a connection that never closed, or WAL mode shitting itself. Could be anything. Good luck debugging it.

SQLite's Default Cache is an Insult to Modern Hardware
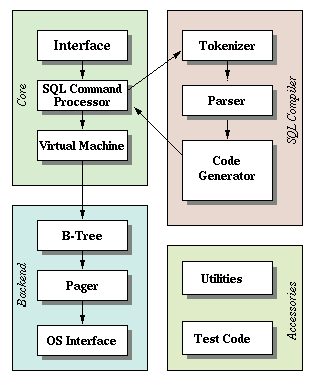
SQLite Architecture Diagram

2MB of cache. In 2025. When my phone has 8GB of RAM.

PRAGMA cache_size = -64000;  -- 64MB cache (negative = KB)  
PRAGMA temp_store = memory;  -- Keep temp tables in RAM

Had this one query that was consistently taking 45+ seconds. Spent days looking at indexes, query plans, all kinds of shit. Finally realized the cache was so small that SQLite was constantly hitting disk for data that should've been in memory. Bumped cache to 64MB and boom - same query in 2 seconds. I wanted to punch something.

Cache size confusion: Positive numbers are pages, negative numbers are KB. So cache_size = 1000 gives you maybe 4MB depending on page size, but cache_size = -64000 gives you exactly 64MB. Whoever designed this API was drunk.

Temp storage matters: Complex queries with GROUP BY or ORDER BY create temporary indexes. By default SQLite writes these to disk, which is slow as hell. temp_store = memory keeps them in RAM. Just watch your memory usage or the kernel will OOMKill you.

WAL Checkpointing: The Silent Database Killer

PRAGMA wal_autocheckpoint = 1000;  -- Default, usually fine
PRAGMA wal_checkpoint(TRUNCATE);   -- Manual cleanup

WAL mode keeps appending to the .db-wal file until a checkpoint moves changes to the main database. Usually this happens automatically every 1000 pages, but sometimes it doesn't and your WAL file grows to ridiculous sizes.

WAL file from hell: Had some asshole connection leave a transaction open over the weekend. Came in Monday and the WAL file was like... I think 12 or 15GB, something insane. Database was still working but our backup script shit the bed because it ran out of disk space. Took forever to figure out what happened.

Silent checkpoint failures: PRAGMA wal_checkpoint(TRUNCATE) is supposed to checkpoint and delete the WAL file. But if any connection has an open transaction, it silently fails. No error, WAL file stays huge, and you waste your Saturday figuring out why the disk is full.

Indexes: Actually the Most Important Thing

SQLite can only use one index per table per query, unlike PostgreSQL which can combine multiple indexes. Get this wrong and all your cache tuning is worthless.

-- This won't help multi-column queries
CREATE INDEX idx_users_name ON users(name);
CREATE INDEX idx_users_status ON users(status);

-- SQLite picks ONE index, scans for the rest
SELECT * FROM users WHERE name = 'Alice' AND status = 'active';
-- This actually works
CREATE INDEX idx_users_name_status ON users(name, status);

Column order matters: Put the most selective column first. If name is unique and status has 3 values, use (name, status) not (status, name). I've seen developers create indexes in the wrong order and spend days wondering why queries are still slow.

The selectivity problem: Your perfect (name, status) index is useless for WHERE status = 'active' queries. SQLite can't use the right part of a composite index without the left part. You need separate indexes or you're fucked.

Use EXPLAIN QUERY PLAN or Guess Randomly

Before adding random indexes, figure out what SQLite is actually doing:

EXPLAIN QUERY PLAN 
SELECT u.name, COUNT(o.id) 
FROM users u 
LEFT JOIN orders o ON u.id = o.user_id 
WHERE u.status = 'active' 
GROUP BY u.id;

Bad signs:

  • SCAN TABLE: No index, checking every single row
  • USING TEMP B-TREE: Building temporary indexes in memory
  • SEARCH TABLE: Using an index, but maybe the wrong one

Temp B-tree hell: If you see "USING TEMP B-TREE" for ORDER BY or GROUP BY, you need a composite index that includes those columns. SQLite is building temporary indexes in memory, which eats RAM and takes forever.

Why Connection Pools Actually Hurt SQLite Performance

Connection pooling with SQLite is weird. Each connection opens the database file and gets its own cache. More connections often hurts performance.

## This usually makes things worse
connection_pool = SQLiteConnectionPool(max_connections=50)

## This is better
connection_pool = SQLiteConnectionPool(max_connections=5)

Why fewer connections help: Each SQLite connection has its own page cache. 50 connections with 10MB cache each means 500MB of duplicated cached pages. Better to have 5 connections with 100MB cache each.

Thread safety lies: SQLite claims to be thread-safe but I've seen shared connections randomly corrupt data in production. Error was something like "database disk image is malformed" which made us think the SSD was dying. Took forever to figure out it was just multiple threads using the same connection without proper locking. One connection per thread or prepare for weird corruption bugs.

When to Give Up on SQLite

Sometimes the best SQLite optimization is switching to PostgreSQL. Consider switching if you need:

  • Multiple writers hitting the database constantly
  • Complex analytics with tons of joins
  • Full-text search that doesn't suck
  • Advanced JSON operations

I've seen teams waste months optimizing SQLite when a weekend PostgreSQL migration would have fixed everything. SQLite is great for read-heavy apps and embedded stuff, but don't push it past its limits.

That said, SQLite with proper tuning can handle way more load than most people think. Expensify processes millions of requests per day on SQLite.

SQLite Configuration Reality Check

Configuration

Write Performance

Read Performance

Memory Usage

Data Safety

What You're Trading

Default Settings

Terrible

Decent

Tiny

Safe

Performance for safety

WAL + Normal Sync

Much better

Decent

Medium

Pretty safe

Some data loss risk for speed

WAL + Off Sync

Really fast

Decent

Medium

Fucked

All safety for speed

Memory Database

Blazing fast

Blazing fast

All your RAM

Gone on restart

Everything for speed

MMAP Enabled

Depends

Really fast

Lots

Safe

RAM for read speed

Large Cache

Depends

Really fast

Lots

Safe

RAM for everything

SQLite Performance: The Shit That Actually Breaks

Q

Why did my database turn to garbage overnight?

A

Your SQLite was blazing fast yesterday, today everything takes forever. I've debugged this exact nightmare dozens of times:

Q

Why does my import script take all fucking day?

A

You're doing individual INSERTs without transactions.

Each INSERT waits for disk confirmation. Import 200K rows and you're doing 200K disk syncs.sql-- This will ruin your weekendfor row in data: conn.execute("INSERT INTO table VALUES (?)", row) -- disk sync every time-- Do this insteadconn.execute("BEGIN")for row in data: conn.execute("INSERT INTO table VALUES (?)", row)conn.execute("COMMIT") -- One disk sync for everythingI had an import that took 8 hours because of this. Added BEGIN/COMMIT and it finished in 12 minutes. Individual INSERTs get you maybe 30-50/second. Batched gets you tens of thousands per second.

Q

Why is SQLite pegging my CPU on simple queries?

A

Table scans.

SQLite is reading every goddamn row to find what you want.```sql

EXPLAIN QUERY PLAN SELECT * FROM users WHERE email = 'user@example.com';```If you see "SCAN TABLE users", you're fucked. SQLite is checking 2 million rows to find one email.The indexes people always forget:

  • Foreign keys: user_id, order_id, anything ending in _id
  • Status fields: active, published, deleted
  • Date columns: created_at, updated_atFiltering on multiple columns?

You need a composite index: CREATE INDEX idx_users_status_date ON users(status, created_at). SQLite can't combine separate indexes like PostgreSQL.

Q

Why is my database file huge when my data isn't?

A

Usually one of these:

  1. Auto-vacuum is off: Deleted data never gets reclaimed. The file just grows forever even when you delete stuff.
  2. Massive WAL file: Your WAL file is 10GB because checkpoints aren't running. The data is sitting in the WAL file instead of the main database.
  3. Page fragmentation: After tons of updates and deletes, pages get fragmented to hell.

Quick fix: Run PRAGMA wal_checkpoint(TRUNCATE) then VACUUM. This will probably shrink your file by 50%.

I once had a 40GB database that was only 8GB of actual data. The rest was fragmented bullshit and an enormous WAL file.

Q

I enabled WAL mode but writes are still slow as shit

A

Check these fuckups:

  1. Still using synchronous=FULL: Change to PRAGMA synchronous = NORMAL for way better performance
  2. Individual transactions: WAL mode doesn't fix the overhead of doing one INSERT at a time
  3. Huge WAL files: If your WAL file is 5GB, checkpoints take forever and block everything
  4. Network filesystems: WAL mode needs shared memory, which doesn't work over NFS or similar network bullshit

Run PRAGMA journal_mode to check if WAL actually enabled. If your filesystem doesn't support shared memory, SQLite silently falls back to the slow rollback journal.

Q

The "database is locked" error from hell

A

This error message tells you nothing useful. Could be anything:

Some asshole started a transaction and never finished it: Most common cause. Code called BEGIN then crashed without COMMIT or ROLLBACK. That connection holds the lock until it gets closed, which might be never.

A query is scanning millions of rows: Long SELECT queries block writers in rollback journal mode. That analytics query scanning your entire users table is locking out all writes.

File permissions are fucked: SQLite needs write access to the directory, not just the database file. Check if your app can write to /var/lib/myapp/ not just the .db file.

Network filesystem bullshit: Don't use SQLite over NFS. File locking over networks is broken and randomly fails.

To debug: Set PRAGMA busy_timeout = 30000 so SQLite retries instead of failing immediately. Add logging to find which transaction never commits.

Q

Multiple databases vs one big database?

A

Multiple databases when:

  • Different access patterns (some read-only, some write-heavy)
  • Data that never needs to be joined
  • Different backup schedules
  • Multi-tenant apps that need isolation

One database when:

  • You need transactions across tables
  • Foreign keys between tables
  • Simpler connection handling
  • Total data under a few hundred GB

Reality: Multiple databases mean more file handles and duplicated caches, but better concurrency since each database locks independently. I usually start with one database and split later if needed.

Q

How much cache should I give SQLite?

A

Safe: 32MB per database (PRAGMA cache_size = -32000)
Aggressive: 25% of your available RAM
Tiny containers: 8-16MB (PRAGMA cache_size = -8000)

Rule: If your frequently accessed data fits in cache, queries run at RAM speed. Monitor memory usage and adjust.

-- Check if cache is helping
.stats on
-- Run your normal queries
-- Look for cache hit ratio

High cache hit ratios (>90%) mean good sizing. Low ratios mean you need more cache or your queries are all over the place.

Q

Works great locally, sucks in production - why?

A

Common production bullshit:

  1. Shit storage: Dev machine has NVMe SSD, production has slow network storage
  2. Resource limits: Production container has 512MB RAM vs your 16GB laptop
  3. Actual load: Multiple users hitting the database instead of just you
  4. Backup interference: Nightly backups holding locks during peak hours
  5. Monitoring overhead: APM tools constantly scanning the database

Debug: Enable .timer on in sqlite3 CLI and compare query times. The difference usually shows you what's fucked.

Q

When should I give up on SQLite and use PostgreSQL?

A

Switch when you hit these walls:

Write concurrency: Thousands of writes per second or many simultaneous writers
Database size: Multi-terabyte databases (SQLite can handle it but becomes a pain to manage)
Geographic stuff: Need replication across regions
Complex permissions: Row-level security or complicated user management
Advanced features: Decent full-text search, complex JSON operations, custom data types

Don't switch too early: Lots of successful companies run on SQLite way longer than you'd think. Expensify processes millions of transactions per day on SQLite.

Q

How do I monitor SQLite in production?

A

Built-in stuff:

-- Time your queries
.timer on

-- See cache stats
.stats on

-- Check cache settings
PRAGMA cache_size;

App-level monitoring:

  • Log slow queries (anything over 100ms)
  • Track database file size (watch for runaway growth)
  • Monitor WAL checkpoint frequency
  • Alert on "database locked" errors (these are bad)

System monitoring:

  • Disk I/O (WAL should show sequential writes, not random)
  • Memory usage (cache + memory mapping)
  • File descriptors (connection leaks)
Q

My queries got slower after adding an index - what the fuck?

A

The query optimizer sometimes makes stupid decisions. Update statistics or force the right index:

-- Update table stats (run after big data changes)
ANALYZE;

-- Force the right index if the optimizer is being dumb
SELECT * FROM users INDEXED BY idx_users_email WHERE email = ?;

Common fuckup: You created an index on (status, created_at) but your query filters on (created_at, status). Index column order has to match your most selective filters first.

Debugging SQLite When Everything Goes to Hell

Finding What's Actually Broken

The SQLite CLI is Your Only Friend

Forget fancy monitoring tools. When SQLite is shitting the bed, open the CLI and figure out what's fucked:

.timer on
.stats on
EXPLAIN QUERY PLAN SELECT * FROM users WHERE email = ?;

If you see "SCAN TABLE users", you found the problem. No index on email means SQLite is checking every goddamn row.

What to look for:

  • SCAN TABLE: You're fucked, add an index
  • USING TEMP B-TREE: SQLite is building indexes in memory, you need a composite index
  • Slow query times: Something is scanning millions of rows

Real debugging nightmare: Login endpoint randomly took 15+ seconds. Email lookup had no index and we'd hit 3M users. Added CREATE INDEX idx_users_email ON users(email) and login was instant. Five fucking minutes to fix a problem that cost us weeks of complaints.

Monitoring Your Database's Health

File System Bullshit

SQLite performance depends heavily on filesystem behavior. Check this stuff:

## Check if your database file is fragmented to hell
filefrag -v database.db

## See what kind of I/O patterns you're getting
iostat -x 1

## Check if your WAL file is out of control
ls -lh database.db*

Bad signs:

  • Fragmented files: Run VACUUM, your database is a mess
  • Huge WAL files: Checkpoints aren't running, you'll run out of disk space
  • Random I/O everywhere: Get an SSD or increase memory mapping
Lock Debugging Hell

Database locks cause most production SQLite disasters:

-- See what locking mode you're in
PRAGMA locking_mode;
PRAGMA journal_mode;

-- Check your timeout settings
PRAGMA busy_timeout;

-- Force a WAL checkpoint
PRAGMA wal_checkpoint;

How to debug lock bullshit:

  1. Log all transactions: Track every BEGIN/COMMIT/ROLLBACK with timestamps so you can find the asshole that never commits
  2. Alert on slow queries: Anything over 5 seconds is probably locking other stuff out
  3. Track connection lifecycle: Make sure connections actually get closed, not just abandoned

Advanced Configuration That Actually Matters

Memory Mapping Tuning

Memory mapping can make reads way faster, but it'll also eat your RAM:

-- Safe starting point
PRAGMA mmap_size = 268435456;  -- 256MB

-- Check what you're currently using
PRAGMA mmap_size;

How much to use:

  • Small databases (<100MB): Map the whole thing
  • Medium databases (100MB-1GB): Map 25-50%
  • Big databases (>1GB): Map your working set, usually 256MB-1GB
  • Tiny containers: 64MB or just disable it

Memory mapping fuckup: On systems with memory pressure, mapping too much causes swapping and everything gets slower. Watch your memory usage.

Cache Size That Doesn't Suck

The 2MB default cache is garbage for real workloads:

-- Give it more cache
PRAGMA cache_size = -64000;  -- 64MB (negative = kilobytes)

-- Check if your cache is helping
.stats on
-- Run your normal queries
-- Look for cache hit ratios

How much cache:

  • Development: 32MB works fine
  • Production web apps: 64-128MB per connection
  • Analytics: Up to 25% of your RAM
  • Small containers: 8-16MB so you don't get OOMKilled
Checkpoint Configuration That Doesn't Suck

WAL checkpoints move data from the WAL file to the main database. Get this wrong and performance dies:

-- Default checkpointing (usually fine)
PRAGMA wal_autocheckpoint = 1000;

-- Turn off auto-checkpointing for write-heavy stuff
PRAGMA wal_autocheckpoint = 0;

-- Force a checkpoint and delete the WAL file
PRAGMA wal_checkpoint(TRUNCATE);

What works:

  • Mostly reads: Default settings are fine
  • Heavy writes: Turn off auto-checkpoint, run manual ones during maintenance
  • Mixed load: Increase checkpoint interval to 5K-10K pages

Performance Testing That Actually Matters

Load Testing With Real Data

Don't test with perfect synthetic data - your production data is messy and that affects performance:

-- Make test data that looks like your real data
INSERT INTO test_table 
SELECT 
    random() % 1000000 as id,
    -- Match your actual data distribution
    CASE WHEN random() % 10 = 0 THEN 'premium' ELSE 'standard' END as status,
    datetime('now', '-' || (random() % 365) || ' days') as created_at
FROM (
    WITH RECURSIVE series(x) AS (
        SELECT 0 UNION ALL SELECT x+1 FROM series LIMIT 1000000
    ) SELECT x FROM series
);
Automated Performance Testing

Set up tests that catch when you accidentally make things slow:

import time
import sqlite3

def benchmark_query(conn, query, params=None, iterations=100):
    times = []
    for _ in range(iterations):
        start = time.perf_counter()
        cursor = conn.execute(query, params or [])
        cursor.fetchall()
        end = time.perf_counter()
        times.append(end - start)
    
    return {
        'min': min(times),
        'max': max(times),
        'avg': sum(times) / len(times),
        'p95': sorted(times)[int(0.95 * len(times))]
    }

## Test your critical queries
results = benchmark_query(conn, "SELECT * FROM users WHERE status = ?", ['active'])
if results['avg'] > 0.1:  # 100ms is probably too slow
    print(f"Query is slow as hell: {results['avg']:.3f}s average")

Troubleshooting Production Disasters

"Database is Locked" Debugging Hell

This error ruins more deployments than anything else. Here's how to find the asshole causing it:

## Connection debugging to find the culprit
import sqlite3
import logging
import threading
import time

class DebuggingSQLiteConnection:
    def __init__(self, db_path):
        self.db_path = db_path
        self.conn = sqlite3.connect(db_path, timeout=30)
        self.transaction_start = None
        self.thread_id = threading.get_ident()
        
    def execute(self, query, params=None):
        if query.upper().startswith('BEGIN'):
            self.transaction_start = time.time()
            logging.info(f"Started transaction on thread {self.thread_id}")
        elif query.upper().startswith(('COMMIT', 'ROLLBACK')):
            if self.transaction_start:
                duration = time.time() - self.transaction_start
                logging.info(f"Ended transaction after {duration:.2f}s on thread {self.thread_id}")
                self.transaction_start = None
        
        try:
            return self.conn.execute(query, params or [])
        except sqlite3.OperationalError as e:
            if "database is locked" in str(e):
                logging.error(f"Database locked on thread {self.thread_id}, "
                            f"transaction running for: {time.time() - (self.transaction_start or time.time()):.2f}s")
            raise
Memory Usage Debugging

SQLite can use way more memory than you think, especially with big caches and memory mapping:

-- See how much memory SQLite is configured to use
PRAGMA cache_size;
PRAGMA mmap_size;

-- Check cache efficiency
PRAGMA cache_spill;

Use system tools to see what it's actually using:

## See how much memory your app is eating
ps aux | grep your_app
pmap -d PID  # Show memory mapping details

## On macOS
vmmap PID | grep -i sqlite
I/O Pattern Debugging

Figure out how SQLite is hitting your storage:

## Watch I/O in real time (Linux)
iotop -p PID

## Trace file operations
strace -e trace=file -p PID

## WAL mode should show sequential writes
## Rollback journal shows random I/O all over the place

Emergency Performance Recovery

When SQLite shits the bed in production, this checklist can save you:

  1. Quick fixes:

    PRAGMA wal_checkpoint(TRUNCATE);  -- Get rid of huge WAL files
    ANALYZE;                          -- Update query planner stats
    
  2. Find what's broken:

    # Check if your files are huge
    ls -lh database.db*
    
    # Find the slow queries
    tail -f app.log | grep "slow"
    
  3. Emergency config:

    PRAGMA cache_size = -128000;      -- More cache memory
    PRAGMA mmap_size = 1073741824;    -- More memory mapping
    PRAGMA temp_store = memory;       -- Keep temp stuff in RAM
    
  4. Maintenance during downtime:

    -- Run these when traffic is low
    VACUUM;                           -- Defragment everything
    REINDEX;                          -- Rebuild indexes
    

SQLite performance is all about understanding your workload and tuning for it. Unlike PostgreSQL where you can just throw more hardware at problems, SQLite needs careful configuration.

Related Tools & Recommendations

compare
Similar content

PostgreSQL vs MySQL vs MariaDB vs SQLite vs CockroachDB

Compare PostgreSQL, MySQL, MariaDB, SQLite, and CockroachDB to pick the best database for your project. Understand performance, features, and team skill conside

/compare/postgresql-mysql-mariadb-sqlite-cockroachdb/database-decision-guide
100%
tool
Similar content

Prisma ORM: TypeScript Client, Setup Guide, & Troubleshooting

Database ORM that generates types from your schema so you can't accidentally query fields that don't exist

Prisma
/tool/prisma/overview
95%
tool
Similar content

SQLite: Zero Configuration SQL Database Overview & Use Cases

Zero Configuration, Actually Works

SQLite
/tool/sqlite/overview
81%
tool
Similar content

MySQL Workbench Performance Fixes: Crashes, Slowdowns, Memory

Stop wasting hours on crashes and timeouts - actual solutions for MySQL Workbench's most annoying performance problems

MySQL Workbench
/tool/mysql-workbench/fixing-performance-issues
81%
tool
Similar content

MariaDB Performance Optimization: Fix Slow Queries & Boost Speed

Learn to optimize MariaDB performance. Fix slow queries, tune configurations, and monitor your server to prevent issues and boost database speed effectively.

MariaDB
/tool/mariadb/performance-optimization
81%
tool
Similar content

Apache Cassandra Performance Optimization Guide: Fix Slow Clusters

Stop Pretending Your 50 Ops/Sec Cluster is "Scalable"

Apache Cassandra
/tool/apache-cassandra/performance-optimization-guide
77%
tool
Similar content

PostgreSQL Performance Optimization: Master Tuning & Monitoring

Optimize PostgreSQL performance with expert tips on memory configuration, query tuning, index design, and production monitoring. Prevent outages and speed up yo

PostgreSQL
/tool/postgresql/performance-optimization
75%
tool
Similar content

PostgreSQL: Why It Excels & Production Troubleshooting Guide

Explore PostgreSQL's advantages over other databases, dive into real-world production horror stories, solutions for common issues, and expert debugging tips.

PostgreSQL
/tool/postgresql/overview
71%
tool
Similar content

Redis Cluster Production Issues: Troubleshooting & Survival Guide

When Redis clustering goes sideways at 3AM and your boss is calling. The essential troubleshooting guide for split-brain scenarios, slot migration failures, and

Redis
/tool/redis/clustering-production-issues
71%
tool
Similar content

Neon Production Troubleshooting Guide: Fix Database Errors

When your serverless PostgreSQL breaks at 2AM - fixes that actually work

Neon
/tool/neon/production-troubleshooting
69%
tool
Similar content

Cassandra Vector Search for RAG: Simplify AI Apps with 5.0

Learn how Apache Cassandra 5.0's integrated vector search simplifies RAG applications. Build AI apps efficiently, overcome common issues like timeouts and slow

Apache Cassandra
/tool/apache-cassandra/vector-search-ai-guide
69%
tool
Similar content

Protocol Buffers: Troubleshooting Performance & Memory Leaks

Real production issues and how to actually fix them (not just optimize them)

Protocol Buffers
/tool/protocol-buffers/performance-troubleshooting
66%
tool
Similar content

ClickHouse Overview: Analytics Database Performance & SQL Guide

When your PostgreSQL queries take forever and you're tired of waiting

ClickHouse
/tool/clickhouse/overview
64%
tool
Similar content

React Production Debugging: Fix App Crashes & White Screens

Five ways React apps crash in production that'll make you question your life choices.

React
/tool/react/debugging-production-issues
62%
tool
Similar content

LM Studio Performance: Fix Crashes & Speed Up Local AI

Stop fighting memory crashes and thermal throttling. Here's how to make LM Studio actually work on real hardware.

LM Studio
/tool/lm-studio/performance-optimization
60%
tool
Similar content

Change Data Capture (CDC) Explained: Production & Debugging

Discover Change Data Capture (CDC): why it's essential, real-world production insights, performance considerations, and debugging tips for tools like Debezium.

Change Data Capture (CDC)
/tool/change-data-capture/overview
56%
tool
Similar content

Redis Overview: In-Memory Database, Caching & Getting Started

The world's fastest in-memory database, providing cloud and on-premises solutions for caching, vector search, and NoSQL databases that seamlessly fit into any t

Redis
/tool/redis/overview
55%
tool
Similar content

Flyway: Database Migrations Explained - Why & How It Works

Database migrations without the XML bullshit or vendor lock-in

Flyway
/tool/flyway/overview
55%
tool
Similar content

PostgreSQL Logical Replication: When Streaming Isn't Enough

Unlock PostgreSQL Logical Replication. Discover its purpose, how it differs from streaming replication, and a practical guide to setting it up, including tips f

PostgreSQL
/tool/postgresql/logical-replication
53%
troubleshoot
Similar content

Fix MongoDB "Topology Was Destroyed" Connection Pool Errors

Production-tested solutions for MongoDB topology errors that break Node.js apps and kill database connections

MongoDB
/troubleshoot/mongodb-topology-closed/connection-pool-exhaustion-solutions
51%

Recommendations combine user behavior, content similarity, research intelligence, and SEO optimization