When Your CNI Shits the Bed

Kubernetes Logo

Kubernetes networking fails in predictable ways. I've been debugging this shit since Kubernetes 1.11, back when nobody knew what a CNI was and we all just hoped Flannel wouldn't randomly die. Here's what actually breaks and how to fix it without losing your mind.

CNI Plugin Failures

CNI Architecture

The CNI plugin handles all pod networking. When it breaks, you get these fun symptoms:

  • Nodes stuck in NotReady with "CNI plugin not initialized"
  • Pods stuck in Pending forever
  • Random connectivity drops that make you question reality
  • failed to create pod sandbox errors in kubelet logs

What's actually wrong:

CIDR conflicts - Your pod network overlaps with node or service networks. I've seen this kill entire clusters during weekend deployments.

## See what networks you're using
kubectl cluster-info dump | grep cidr
kubectl get nodes -o jsonpath='{.items[*].spec.podCIDR}'

Version mismatches - Your CNI plugin doesn't support your Kubernetes version. Kubernetes 1.25 changed the default CNI timeout from 10s to 30s, which masks real connection issues. Don't use Flannel 0.15.1 - it corrupts routing tables on node restart. Calico 3.20+ requires Kubernetes 1.19+ but the error messages just say "plugin failed" without mentioning version conflicts.

IP exhaustion - Someone configured a /28 subnet for 100 pods. Math doesn't work.

## Check what IPs you have left
kubectl describe node NODE_NAME | grep PodCIDR
## For Calico users
calicoctl get ippool -o wide

The fix? Expand your CIDR or reduce your pod density. I learned this the hard way during Black Friday 2021 when AWS was having one of their "everything is fine" us-east-1 outages and we were frantically trying to failover to us-west-2, only to discover our pod CIDR was a /24 and we needed to scale to 500 pods. Took down checkout for 3 hours.

DNS Resolution Failures

DNS Flow

CoreDNS is supposed to handle DNS but breaks constantly:

  • Service resolution works sporadically (like 70% of the time)
  • nslookup kubernetes.default returns SERVFAIL
  • Apps can't find services that definitely exist
  • DNS works from some pods but not others

What's actually wrong:

CoreDNS resource starvation - Default resource limits are garbage. 100m CPU isn't enough for any real load. Resource limits that look reasonable will throttle DNS under load.

## Check if CoreDNS is being throttled
kubectl top pods -n kube-system | grep coredns
kubectl describe deployment coredns -n kube-system | grep resources

Quick fix: Bump CoreDNS resources to 500m CPU and 512Mi memory. The default limits are a joke - whoever thought 100m CPU would handle a production cluster was clearly not running real workloads.

DNS config inconsistency - Different nodes have different DNS settings after upgrades. Kubelet configurations get out of sync.

## Check if DNS configs match across nodes
kubectl get pods -n kube-system -l k8s-app=kube-dns -o wide
kubectl describe configmap coredns -n kube-system

Network policies breaking DNS - Someone applied network policies without understanding they need to allow DNS traffic. Pods can ping by IP but can't resolve names.

Service Routing Issues

Kubernetes Services are load balancers that route traffic to pods. They break constantly.

You'll see:

  • kubectl get svc shows endpoints exist
  • Direct pod access works: curl pod-ip:8080
  • Service access fails: curl service-name:8080
  • Load balancer says "no healthy targets"

What's broken:

Endpoint lag - The endpoint controller is slow updating when pods start/stop. Your service sends traffic to dead pods.

## Check if endpoints match reality
kubectl get endpoints your-service -o yaml
kubectl get pods -l app=your-app -o wide

Mixed kube-proxy modes - Some nodes use iptables, others use ipvs. kube-proxy configuration is inconsistent after upgrades.

External Access Problems

Ingress controllers handle external traffic. They fail in spectacular ways:

  • Ingress never gets an external IP
  • 502 errors for services that work internally
  • SSL cert issues causing browser warnings
  • Traffic routes to wrong backends

Common failures:

Cloud LB integration broken - AWS ALB can't create load balancers due to IAM issues. GCP quota limits hit.

## Check ingress status
kubectl get ingress -A
kubectl describe ingress your-ingress
kubectl logs -n ingress-nginx deployment/ingress-nginx-controller

Cert-manager failures - cert-manager can't renew certs because DNS challenges fail or HTTP challenges are blocked.

Network Policy Hell

Network policies break legitimate traffic more than they block attacks. Default deny-all policies applied without understanding what needs to communicate.

## See what policies are blocking you
kubectl get networkpolicies -A
kubectl get namespaces --show-labels

The Debug Process That Actually Works

Kubernetes Troubleshooting Flowchart

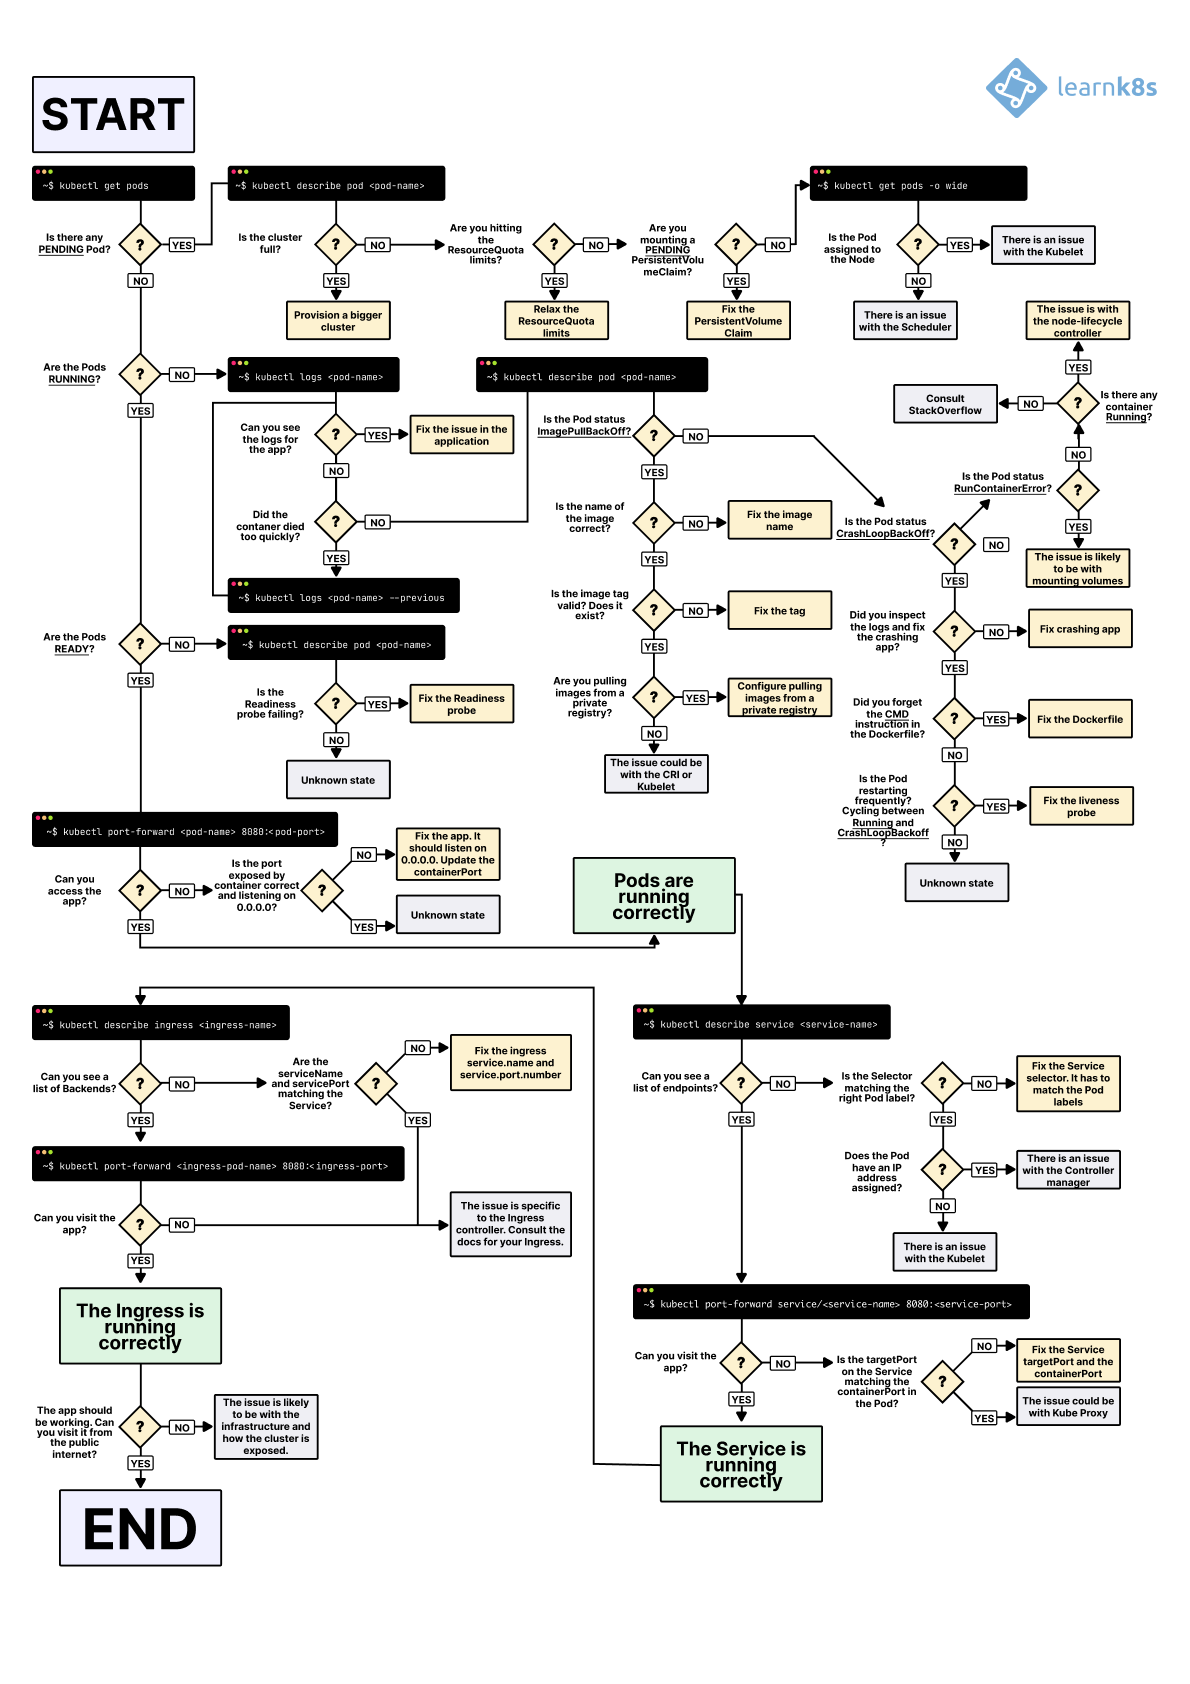
When everything's broken, use this order:

  1. Check CNI status
kubectl get nodes -o wide
kubectl describe nodes | grep Ready
  1. Test basic connectivity
kubectl run test --image=busybox --rm -it -- ping 8.8.8.8
  1. Verify DNS
kubectl exec test -- nslookup kubernetes.default
  1. Test service routing
kubectl exec test -- curl service-name:8080
  1. Check external access
kubectl exec test -- curl your-domain.com

Start here and work through systematically. Most networking issues are CNI problems, DNS throttling, or network policies blocking legitimate traffic.

When Basic Debugging Isn't Enough - The Deep Shit

Calico Architecture

Sometimes kubectl get pods doesn't tell you why everything's broken. I've spent countless nights debugging this crap across different environments - on-prem bare metal where you don't have cloud provider magic, GKE where Google decides to "help" by changing your CNI config, and AWS where EKS updates randomly break your custom CNI settings.

CNI-Specific Debugging - Every Plugin Breaks Differently

Kubernetes Cluster Network

I've debugged every major CNI plugin, and they all break in their own special ways. Here's how to debug each one when the basic stuff doesn't work.

Calico - When BGP Goes to Hell

Calico loves its BGP routing and complex architecture. When it breaks, you need calicoctl to figure out what's actually happening.

## Check Calico system status
calicoctl node status
calicoctl get nodes -o wide

## Debug IP allocation and routing
calicoctl get ippool -o wide
calicoctl get wep --all-namespaces | grep your-pod-name

## Verify BGP peering (if using BGP mode)
calicoctl node status
sudo calicoctl node diags

Calico-specific failure modes:

  • BGP Session Failures: Nodes can't establish BGP peering, causing routing problems between nodes
  • IP Pool Exhaustion: IPAM has run out of available IPs in the configured ranges
  • Felix Agent Crashes: The Calico agent on nodes crashes under high policy evaluation load

Real war story: Had some weird issue where pods were getting duplicate IPs during high load back in Calico 3.18. Took me 6 hours to figure out - turns out there was a race condition in Calico's IPAM when using Kubernetes 1.20 with aggressive scaling policies. Calico would assign the same IP to multiple pods during rapid scale-up events. Fixed by downgrading to Calico 3.17 temporarily, then upgrading to 3.19 which actually fixed the race condition. Also had to tune the block allocation size from 64 to 26 because our nodes were small.

Cilium - eBPF Debugging Hell

Cilium is powerful but I fucking hate debugging eBPF issues - it feels like reading kernel assembly with a hangover. Full disclosure: I'm biased against Cilium's complexity, but it's the only thing that handles our scale without melting under 50k+ pods.

## Check Cilium agent status on nodes
kubectl exec -n kube-system ds/cilium -- cilium status
kubectl exec -n kube-system cilium-pod-name -- cilium endpoint list

## Debug eBPF program loading and packet processing
kubectl exec -n kube-system cilium-pod-name -- cilium bpf lb list
kubectl exec -n kube-system cilium-pod-name -- cilium monitor --type=drop

## Verify service connectivity
kubectl exec -n kube-system cilium-pod-name -- cilium service list

Cilium-specific debugging tools:

  • Traffic monitoring: cilium monitor shows real-time packet flows and drops
  • Policy tracing: cilium policy trace simulates policy evaluation for specific traffic
  • eBPF inspection: cilium bpf commands inspect loaded eBPF programs and maps
Flannel - Simple Until It Isn't

Flannel is supposed to be the simple CNI. Works great until the VXLAN tunnels decide to shit themselves. If you're running on GKE, the default pod CIDR conflicts with most corporate VPNs - learned this the hard way when our entire engineering team couldn't VPN in after a cluster upgrade.

## Check Flannel pod status and configuration
kubectl get pods -n kube-flannel -o wide
kubectl logs -n kube-flannel ds/kube-flannel-ds

## Verify VXLAN tunnel interfaces on nodes
ip link show flannel.1
ip route show | grep flannel

## Check subnet allocation
kubectl get nodes -o jsonpath='{range .items[*]}{.metadata.name}{"	"}{.spec.podCIDR}{"
"}{end}'

Flannel troubleshooting scenarios:

  • VXLAN MTU issues: Packets larger than the tunnel MTU get fragmented or dropped
  • Routing table inconsistencies: Nodes have different views of pod subnet assignments
  • Backend configuration mismatches: Mixing host-gw and vxlan backends causes routing confusion

Service Mesh Debugging - Adding More Ways to Break

Istio Architecture

Service meshes like Istio and Linkerd promise to solve all your networking problems. They mostly just add new ways to break.

Istio - When Your Sidecar is Fucked

Istio loves its Envoy sidecars. When they break, everything breaks in mysterious ways.

## Check Envoy sidecar configuration and status
kubectl exec your-pod -c istio-proxy -- pilot-agent status
kubectl exec your-pod -c istio-proxy -- curl localhost:15000/config_dump

## Debug traffic routing and load balancing
kubectl exec your-pod -c istio-proxy -- curl localhost:15000/clusters
kubectl exec your-pod -c istio-proxy -- curl localhost:15000/stats | grep your-service

## Verify mutual TLS configuration
istioctl authn tls-check your-pod.your-namespace.svc.cluster.local
istioctl proxy-config cluster your-pod.your-namespace

Common Istio networking problems:

  • Sidecar injection failures: Pods start without Envoy sidecars due to namespace labeling issues
  • mTLS authentication failures: Automatic mTLS negotiation fails between services
  • Traffic policy conflicts: Multiple VirtualServices or DestinationRules create conflicting routing rules
Linkerd Network Debugging

Linkerd provides simpler service mesh functionality with built-in observability tools.

## Check Linkerd proxy status
linkerd check
linkerd stat deploy/your-deployment

## Debug traffic between services
linkerd tap deploy/your-deployment
linkerd edges deployments

## Verify proxy configuration
kubectl exec your-pod -c linkerd-proxy -- curl localhost:4191/ready

When Your App is Slow and You Don't Know Why

Your app is slow and everyone's blaming the network. Here's how to prove it's not your fault (or figure out that it actually is).

Network Latency - Measuring the Pain

Is the network slow or is your code garbage? Let's find out.

## Test baseline network latency between nodes
kubectl run network-test --image=nicolaka/netshoot --rm -it -- sh
## Inside pod: ping node-ip
## Inside pod: iperf3 -c other-pod-ip

## Measure service discovery latency
time kubectl exec your-pod -- nslookup your-service
kubectl exec your-pod -- dig your-service.your-namespace.svc.cluster.local
Bandwidth and Throughput Testing

Identifying network bandwidth limitations helps distinguish between network capacity issues and application bottlenecks.

## Test inter-pod bandwidth
kubectl run iperf-server --image=networkstatic/iperf3 -- iperf3 -s
kubectl run iperf-client --image=networkstatic/iperf3 --rm -it -- iperf3 -c iperf-server-ip

## Test node-to-node network performance
kubectl debug node/node1 -it --image=nicolaka/netshoot
## From debug container: iperf3 -c node2-ip
Connection Pool and Circuit Breaker Analysis

Modern applications use connection pooling and circuit breakers that can mask network problems or create false positives.

## Check application connection metrics
kubectl exec your-pod -- curl localhost:8080/metrics | grep -E \"(connection|circuit)\"

## For applications using Envoy (Istio):
kubectl exec your-pod -c istio-proxy -- curl localhost:15000/stats | grep -E \"(upstream|circuit_breaker)\"

## Monitor connection states
kubectl exec your-pod -- netstat -an | grep :8080

Container Network Interface (CNI) Performance Tuning

CNI configuration significantly impacts network performance, and tuning these settings can resolve performance bottlenecks.

CNI Plugin Performance Configuration

Each CNI plugin has performance-related configuration options that affect throughput and latency.

Calico performance tuning:

## Example Calico configuration for high-performance networking
apiVersion: operator.tigera.io/v1
kind: Installation
metadata:
  name: default
spec:
  calicoNetwork:
    bgp: Enabled
    mtu: 1500
    nodeAddressAutodetectionV4:
      firstFound: true
  flexVolumePath: /usr/libexec/kubernetes/kubelet-plugins/volume/exec/

Cilium performance optimization:

## Cilium ConfigMap for performance tuning
apiVersion: v1
kind: ConfigMap
metadata:
  name: cilium-config
  namespace: kube-system
data:
  enable-bpf-masquerade: \"true\"
  enable-ip-masq-agent: \"false\"
  tunnel: \"disabled\"  # Use native routing for better performance
  auto-direct-node-routes: \"true\"
Node-Level Network Optimization

Operating system network configurations impact CNI plugin performance and should be optimized for high-throughput workloads.

## Check current network buffer settings
sysctl net.core.rmem_max
sysctl net.core.wmem_max

## Optimize for high-throughput networking
echo 'net.core.rmem_max = 134217728' >> /etc/sysctl.conf
echo 'net.core.wmem_max = 134217728' >> /etc/sysctl.conf
echo 'net.ipv4.tcp_rmem = 4096 87380 134217728' >> /etc/sysctl.conf

## Apply network optimizations
sysctl -p

Multi-Cluster Network Debugging

Organizations running multiple Kubernetes clusters face additional networking challenges when services need to communicate across cluster boundaries.

Cross-Cluster Service Discovery

Debugging service discovery across clusters requires understanding how different multi-cluster solutions handle DNS and service registration.

## For Submariner multi-cluster networking
subctl show networks
subctl show connections
subctl diagnose all

## For Istio multi-cluster setup
istioctl proxy-config cluster your-pod --fqdn=your-service.your-namespace.cluster2.local
Network Policy in Multi-Cluster Environments

Network policies become more complex in multi-cluster setups, where services in one cluster need to communicate with services in another.

## Debug cross-cluster network policy enforcement
kubectl describe networkpolicy cross-cluster-policy
kubectl get services -A | grep multi-cluster

Multi-cluster nightmare: Had an issue in late 2022 where API calls worked fine during the day but died at night during batch processing. Spent 3 weeks debugging it because management wouldn't approve cluster downtime for troubleshooting. Turns out the network policies were written by someone who left the company - they were matching pod counts instead of actual service identity. When pods scaled up at night from 10 to 200, legitimate traffic got blocked. Fixed it at 3am on a Tuesday after finally convincing my manager to let me delete all network policies temporarily. Don't write policies when you're sleep deprived.

Look, most networking issues are either DNS being DNS, CIDR conflicts, or someone's network policy blocking legitimate traffic. Start with the basic stuff from the previous section before diving into this advanced diagnostic hell.

Network Policies Have Broken Our Production Three Times

Network Policies

Network policies break legitimate traffic more than they block attacks. Whoever thought default-deny for everything was a good idea never worked production at 3am.

Network Policy Debugging - The Three Biggest Fuckups

After dealing with this shit for years, here are the mistakes that kill everything:

The \"Just Added One Policy\" Trap

Most people don't realize that adding ANY network policy to a namespace changes the default from "allow all" to "deny all" for the pods it selects. I've seen this break entire platforms.

## Check all network policies affecting a namespace
kubectl get networkpolicies -n your-namespace -o yaml

## Find policies that might be blocking your traffic
kubectl describe networkpolicy -n your-namespace your-policy

## Check which pods are selected by a policy
kubectl get pods -n your-namespace --show-labels
kubectl get pods -n your-namespace -l \"app=your-app\" --show-labels

The trap: Zero policies = everything works. Add one policy = only that specific traffic works, everything else dies.

War story: Back in August 2023, our security team wanted "defense in depth" so they deployed a single ingress policy on a Friday at 4:30pm to allow web traffic. By Monday morning, our frontend couldn't talk to the database and customer support was flooded with complaints. Turns out when you add ANY policy to pods, those pods default to deny-all for everything not explicitly allowed. Frontend could receive web requests but couldn't make database calls. Should've taken 5 minutes to fix, but spent 4 hours debugging because I kept assuming it was DNS again. The security guy who deployed it was on vacation in Cancun.

Policy Selector Debugging

Network policy selectors use label matching, and subtle label mismatches cause policies to select unexpected pods or miss their intended targets.

## Debug pod selector matching
kubectl get pods -n your-namespace -o jsonpath='{range .items[*]}{.metadata.name}{\"	\"}{.metadata.labels}{\"
\"}{end}'

## Check namespace selector behavior
kubectl get namespaces --show-labels
kubectl get networkpolicy your-policy -o jsonpath='{.spec.ingress[*].from[*].namespaceSelector}'

## Verify policy application with kubectl debug
kubectl run policy-test --image=busybox --rm -it -- sh
## Test connectivity from inside the policy-test pod
The Label Selector Clusterfuck

90% of network policy problems are just label selectors matching the wrong shit.

## See what labels your pods actually have
kubectl get pods --show-labels | grep your-app
## Compare with what your policy is selecting
kubectl describe networkpolicy your-policy | grep -A5 \"Pod Selector\"

DNS Becomes DNS't

Network policies break DNS more than anything else. Your pods can't reach CoreDNS in kube-system, so everything fails with nslookup: can't resolve.

The DNS Fix That Actually Works

Copy this. It allows DNS traffic to CoreDNS without opening everything up:

## Test if DNS is broken
kubectl run test-dns --image=busybox --rm -it -- nslookup kubernetes.default
## If that fails, your network policy is blocking DNS
apiVersion: networking.k8s.io/v1
kind: NetworkPolicy
metadata:
  name: allow-dns
  namespace: your-namespace
spec:
  podSelector: {}  # Apply to all pods in namespace
  policyTypes:
  - Egress
  egress:
  # Allow DNS to CoreDNS
  - to:
    - namespaceSelector:
        matchLabels:
          name: kube-system
    - podSelector:
        matchLabels:
          k8s-app: kube-dns
    ports:
    - protocol: UDP
      port: 53
    - protocol: TCP
      port: 53
  # Allow external DNS (adjust IP ranges as needed)
  - to: []
    ports:
    - protocol: UDP
      port: 53
    - protocol: TCP
      port: 53

The Three Network Policy Mistakes That Ruin Your Day

Network Policy Visualization

Stop trying to be comprehensive. Here are the only 3 network policy problems you actually need to fix:

1. You Applied One Policy and Broke Everything Else

The default behavior flip from "allow all" to "deny all" catches everyone.

## See what policies are actually applied
kubectl get networkpolicies -A
## Check if any pods are selected but missing egress rules
kubectl describe networkpolicy -A | grep -A10 \"Pod Selector\"
2. DNS is Blocked

Your pods can't resolve service names because DNS traffic is blocked.

## Test DNS immediately  
kubectl run dns-test --image=busybox --rm -it -- nslookup kubernetes.default
## If it fails: \"server can't find kubernetes.default\"
## Add the DNS policy from above
3. Service Mesh Sidecar Traffic is Blocked

Istio and Linkerd proxies need specific ports allowed or everything breaks.

## Check for sidecar connection errors
kubectl logs your-pod -c istio-proxy | grep -E \"(connection refused|connection reset)\"
## Fix: Add ports 15001, 15006, and 15090 to your egress rules

Stop Overthinking Network Policies

Look, 90% of network policy problems are one of those three issues above. Before you dive into cloud security groups or complex policy evaluation, fix the basic shit first:

  1. Check if you accidentally enabled deny-all mode
  2. Make sure DNS works
  3. Allow your service mesh ports

If those three things are working and you still have connectivity issues, THEN it might be something exotic like AWS security groups blocking your pod CIDR or conntrack table exhaustion. But 95% of the time, it's one of the three basic fuckups above.

Don't write network policies when you're sleep deprived. Don't apply them on Friday at 5pm. And always have a way to quickly delete all policies when everything breaks - which it will, probably during the demo to your CEO.

Networking FAQ (What to Check When Everything's Fucked)

Q

Why can't my pods talk to each other even though they're in the same namespace?

A

99% of the time it's network policies. Check this first:

kubectl get networkpolicies -n your-namespace

If you see anything, that's probably your problem. Usually some asshole installed a Helm chart that included default network policies without telling anyone.

## Test direct pod connectivity first
kubectl exec pod-1 -- ping pod-2-ip

If ping works but your app doesn't, it's not networking - it's your app being broken.

Q

My service returns "connection refused" but the pods are running and healthy - what's wrong?

A

Service selector is fucked. Check this:

kubectl get endpoints your-service

If it shows no endpoints, your service isn't selecting your pods. Usually because someone changed the labels and forgot to update the service selector.

Quick fix: Copy the pod labels and paste them into your service selector. Should take 30 seconds, will take 2 hours when you discover the port numbers are also wrong.

Q

DNS resolution works intermittently - why is nslookup failing 20% of the time?

A

CoreDNS is getting throttled. The default resource limits are complete garbage:

kubectl top pods -n kube-system | grep coredns

If CPU is maxed out, bump the resource limits to something that isn't insane:

kubectl patch deployment coredns -n kube-system -p '{"spec":{"template":{"spec":{"containers":[{"name":"coredns","resources":{"limits":{"cpu":"500m","memory":"512Mi"}}}]}}}}'

This should take 30 seconds but will take 3 hours when you realize you also need to restart the pods and there's some random network policy blocking DNS.

Q

My ingress shows "Address: <none>" and never gets an external IP - how do I fix this?

A

Your cloud provider can't create a load balancer. Check the ingress controller logs:

kubectl logs -n ingress-nginx deployment/ingress-nginx-controller --tail=20

Usually it's either IAM permissions (AWS), quotas (GCP), or someone forgot to enable the load balancer service (everywhere).

On AWS, check your node groups have the ELB permissions. On GCP, make sure you didn't hit the forwarding rule limits. This will take 20 minutes to fix, 4 hours to figure out what's wrong.

Q

Why do my external API calls timeout but internal service calls work fine?

A

This points to egress traffic being blocked by network policies or firewall rules:

Network policies blocking external traffic:

kubectl get networkpolicies -n your-namespace
kubectl describe networkpolicy your-policy | grep -A 10 "egress"

## Test external connectivity
kubectl exec your-pod -- curl -v https://httpbin.org/ip
kubectl exec your-pod -- dig google.com

Cloud provider security groups blocking egress:

## AWS: Check security group egress rules
aws ec2 describe-security-groups --group-ids your-sg-id --query 'SecurityGroups[*].IpPermissionsEgress'

## GCP: Check VPC firewall rules  
gcloud compute firewall-rules list --filter="direction=EGRESS"

Corporate proxy/firewall requirements:

kubectl exec your-pod -- env | grep -i proxy
kubectl exec your-pod -- curl -v --proxy proxy-server:8080 https://www.google.com
Q

My CNI plugin is crashing and nodes are going NotReady - how do I recover?

A

CNI crashes usually indicate configuration problems or resource exhaustion:

Check CNI pod status and logs:

kubectl get pods -n kube-system | grep -E "flannel|calico|cilium|weave"
kubectl logs -n kube-system ds/kube-flannel-ds --tail=100

Verify CNI configuration matches cluster setup:

## Check pod CIDR configuration
kubectl get nodes -o jsonpath='{.items[*].spec.podCIDR}'
kubectl cluster-info dump | grep -A 1 -B 1 cluster-cidr

## For Flannel, check subnet configuration
kubectl get configmap kube-flannel-cfg -n kube-flannel -o yaml

IP address exhaustion: Cluster ran out of pod IPs

## Check IP pool utilization (Calico example)
calicoctl get ippool -o wide
kubectl get nodes -o custom-columns="NAME:.metadata.name,PODCIDR:.spec.podCIDR,ALLOCATED:.status.allocatable.pods"

Emergency recovery: Restart CNI pods to recover temporarily

kubectl delete pods -n kube-system -l k8s-app=flannel
## Or for other CNIs:
kubectl rollout restart ds/calico-node -n calico-system
Q

How do I debug network policies without breaking everything?

A

Network policy debugging requires careful testing to avoid blocking legitimate traffic:

Start with logging/monitoring mode (if your CNI supports it):

## Calico example: log but don't enforce
kubectl annotate networkpolicy your-policy projectcalico.org/metadata='{"defaultEndpointToHostAction":"ALLOW"}'

Create a test pod in the same namespace:

kubectl run policy-test --image=busybox --rm -it -- sh
## Inside pod, test connections to various services

Use debugging tools to visualize policies:

## Check existing policies and their selectors
kubectl get networkpolicies -A -o wide
kubectl describe networkpolicy your-policy | grep -A 10 -B 10 selector

Test policy impact with temporary exemptions:

## Add temporary label to exempt pods from policies
kubectl label pod your-pod policy-exempt=true

## Create bypass policy for testing
kubectl apply -f - <<EOF
apiVersion: networking.k8s.io/v1
kind: NetworkPolicy
metadata:
  name: debug-bypass
spec:
  podSelector:
    matchLabels:
      policy-exempt: "true"
  policyTypes: []  # Allow all traffic
EOF
Q

Why is my service mesh (Istio/Linkerd) breaking basic networking?

A

Service meshes add complexity that can interfere with basic Kubernetes networking:

Sidecar injection problems: Pods don't have proxy sidecars

kubectl get pods your-pod -o yaml | grep -A 5 -B 5 "istio-proxy\|linkerd-proxy"
kubectl describe namespace your-namespace | grep -i "injection\|mesh"

mTLS configuration conflicts: Automatic mTLS is breaking non-mesh services

## Istio: Check mTLS policy
istioctl authn tls-check your-service.your-namespace.svc.cluster.local
kubectl get peerauthentication -A

## Linkerd: Check mTLS status
linkerd edges deployments
linkerd stat deploy/your-deployment

Traffic routing conflicts: Service mesh policies override Kubernetes services

## Istio: Check virtual services and destination rules
kubectl get virtualservice,destinationrule -A
istioctl analyze -n your-namespace

## Linkerd: Check service profiles
kubectl get serviceprofile -A

Resource exhaustion from sidecars: Proxy containers using too much memory/CPU

kubectl top pods | grep -E "istio-proxy|linkerd-proxy"
kubectl describe pod your-pod | grep -A 10 -B 10 "istio-proxy\|linkerd-proxy"
Q

How do I know if the problem is CNI, kube-proxy, or something else?

A

Network problems can originate from multiple components. Here's a systematic approach to isolate the issue:

Test Layer 3 connectivity (bypasses kube-proxy and services):

## Get pod IPs and test direct connectivity
kubectl get pods -o wide
kubectl exec pod-1 -- ping pod-2-ip

Test DNS resolution (isolates CoreDNS issues):

kubectl exec pod-1 -- nslookup kubernetes.default
kubectl exec pod-1 -- nslookup your-service.your-namespace

Test service connectivity (isolates kube-proxy issues):

kubectl exec pod-1 -- curl your-service:8080
kubectl get endpoints your-service  # Should show backend pod IPs

Check component health:

## CNI health (varies by plugin)
kubectl get pods -n kube-system | grep -E "flannel|calico|cilium"

## kube-proxy health
kubectl get pods -n kube-system -l k8s-app=kube-proxy
kubectl logs -n kube-system -l k8s-app=kube-proxy --tail=50

## CoreDNS health
kubectl get pods -n kube-system -l k8s-app=kube-dns
kubectl logs -n kube-system -l k8s-app=kube-dns --tail=50

Layer-by-layer diagnosis:

  • Layer 3 fails → CNI problem
  • Layer 3 works, DNS fails → CoreDNS problem
  • DNS works, service access fails → kube-proxy problem
  • Everything works internally, external access fails → Ingress/LoadBalancer problem
Q

My pods keep getting new IP addresses and losing connections - how do I fix this?

A

Frequent pod IP changes indicate instability in the networking layer or pod scheduling:

Pod restart loops: Pods are crashing and getting new IPs on restart

kubectl describe pod your-pod | grep -A 10 "Events\|Restart"
kubectl logs your-pod --previous  # Logs from crashed container

Node network instability: CNI is reassigning IPs due to node issues

kubectl get nodes -o wide  # Check node status
kubectl describe node your-node | grep -A 10 "Conditions\|Events"

IP address pool exhaustion: CNI is reusing IPs due to shortage

## Check available IP ranges
kubectl get nodes -o jsonpath='{.items[*].spec.podCIDR}'
calicoctl get ippool -o wide  # For Calico
kubectl describe node your-node | grep "PodCIDR\|Allocatable"

Service mesh connection draining: Proxy isn't handling connection migration

## Check proxy logs for connection errors
kubectl logs your-pod -c istio-proxy | grep -i "connection\|reset"
kubectl exec your-pod -c linkerd-proxy -- curl localhost:4191/metrics | grep connection

The fix usually involves identifying why pods are restarting (resource limits, liveness probe failures) or expanding IP address pools to reduce IP reuse frequency.

Network Troubleshooting Tools Comparison - What Actually Works When Your Cluster Network is Broken

Tool/Command

Best For

What It Reveals

When It's Useless

Setup Required

Learning Curve

kubectl logs

Application-level network issues

Connection errors, timeout messages, DNS failures

CNI problems, iptables issues, kernel-level drops

None

Low

kubectl describe pod

Pod networking setup issues

IP assignment, CNI errors, container port config

Inter-pod connectivity, service routing

None

Low

kubectl get endpoints

Service routing problems

Which pods are backing a service

Why pods aren't healthy, DNS issues

None

Low

kubectl exec -- ping/curl

Basic connectivity testing

Layer 3/4 connectivity, service reachability

Root cause of failures, policy blocks

None

Low

kubectl run netshoot

Advanced network diagnostics

Packet flow, DNS resolution, port availability

CNI-specific issues, policy evaluation

None

Medium

calicoctl

Calico CNI debugging

BGP status, IP allocation, policy programming

Non-Calico CNI issues, application problems

Calico CLI install

Medium

cilium

Cilium CNI debugging

eBPF program status, endpoint connectivity, policy trace

Non-Cilium issues, basic connectivity

Access to Cilium pods

High

istioctl

Service mesh networking

mTLS config, traffic policies, proxy status

CNI issues, basic k8s networking

Istio installation

High

tcpdump/Wireshark

Packet-level analysis

Actual network traffic, dropped packets, protocol issues

High-level service problems, policy intent

Network tools pod

High

Related Tools & Recommendations

tool
Similar content

Helm: Simplify Kubernetes Deployments & Avoid YAML Chaos

Package manager for Kubernetes that saves you from copy-pasting deployment configs like a savage. Helm charts beat maintaining separate YAML files for every dam

Helm
/tool/helm/overview
100%
howto
Similar content

Set Up Microservices Observability: Prometheus & Grafana Guide

Stop flying blind - get real visibility into what's breaking your distributed services

Prometheus
/howto/setup-microservices-observability-prometheus-jaeger-grafana/complete-observability-setup
95%
tool
Similar content

Debugging Istio Production Issues: The 3AM Survival Guide

When traffic disappears and your service mesh is the prime suspect

Istio
/tool/istio/debugging-production-issues
79%
integration
Similar content

Jenkins Docker Kubernetes CI/CD: Deploy Without Breaking Production

The Real Guide to CI/CD That Actually Works

Jenkins
/integration/jenkins-docker-kubernetes/enterprise-ci-cd-pipeline
75%
integration
Similar content

Kafka, MongoDB, K8s, Prometheus: Event-Driven Observability

When your event-driven services die and you're staring at green dashboards while everything burns, you need real observability - not the vendor promises that go

Apache Kafka
/integration/kafka-mongodb-kubernetes-prometheus-event-driven/complete-observability-architecture
73%
troubleshoot
Recommended

Docker Desktop Won't Install? Welcome to Hell

When the "simple" installer turns your weekend into a debugging nightmare

Docker Desktop
/troubleshoot/docker-cve-2025-9074/installation-startup-failures
70%
howto
Recommended

Complete Guide to Setting Up Microservices with Docker and Kubernetes (2025)

Split Your Monolith Into Services That Will Break in New and Exciting Ways

Docker
/howto/setup-microservices-docker-kubernetes/complete-setup-guide
70%
troubleshoot
Recommended

Fix Docker Daemon Connection Failures

When Docker decides to fuck you over at 2 AM

Docker Engine
/troubleshoot/docker-error-during-connect-daemon-not-running/daemon-connection-failures
70%
integration
Recommended

OpenTelemetry + Jaeger + Grafana on Kubernetes - The Stack That Actually Works

Stop flying blind in production microservices

OpenTelemetry
/integration/opentelemetry-jaeger-grafana-kubernetes/complete-observability-stack
68%
troubleshoot
Similar content

Kubernetes Crisis Management: Fix Your Down Cluster Fast

How to fix Kubernetes disasters when everything's on fire and your phone won't stop ringing.

Kubernetes
/troubleshoot/kubernetes-production-crisis-management/production-crisis-management
60%
tool
Recommended

Red Hat OpenShift Container Platform - Enterprise Kubernetes That Actually Works

More expensive than vanilla K8s but way less painful to operate in production

Red Hat OpenShift Container Platform
/tool/openshift/overview
57%
troubleshoot
Similar content

Kubernetes CrashLoopBackOff: Debug & Fix Pod Restart Issues

Your pod is fucked and everyone knows it - time to fix this shit

Kubernetes
/troubleshoot/kubernetes-pod-crashloopbackoff/crashloopbackoff-debugging
56%
integration
Recommended

Making Pulumi, Kubernetes, Helm, and GitOps Actually Work Together

Stop fighting with YAML hell and infrastructure drift - here's how to manage everything through Git without losing your sanity

Pulumi
/integration/pulumi-kubernetes-helm-gitops/complete-workflow-integration
55%
tool
Recommended

Fix Helm When It Inevitably Breaks - Debug Guide

The commands, tools, and nuclear options for when your Helm deployment is fucked and you need to debug template errors at 3am.

Helm
/tool/helm/troubleshooting-guide
55%
integration
Recommended

Setting Up Prometheus Monitoring That Won't Make You Hate Your Job

How to Connect Prometheus, Grafana, and Alertmanager Without Losing Your Sanity

Prometheus
/integration/prometheus-grafana-alertmanager/complete-monitoring-integration
53%
troubleshoot
Similar content

Debug Kubernetes AI GPU Failures: Pods Stuck Pending & OOM

Debugging workflows for when Kubernetes decides your AI workload doesn't deserve those GPUs. Based on 3am production incidents where everything was on fire.

Kubernetes
/troubleshoot/kubernetes-ai-workload-deployment-issues/ai-workload-gpu-resource-failures
52%
tool
Similar content

Debug Kubernetes Issues: The 3AM Production Survival Guide

When your pods are crashing, services aren't accessible, and your pager won't stop buzzing - here's how to actually fix it

Kubernetes
/tool/kubernetes/debugging-kubernetes-issues
50%
alternatives
Recommended

GitHub Actions Alternatives That Don't Suck

integrates with GitHub Actions

GitHub Actions
/alternatives/github-actions/use-case-driven-selection
48%
alternatives
Recommended

Tired of GitHub Actions Eating Your Budget? Here's Where Teams Are Actually Going

integrates with GitHub Actions

GitHub Actions
/alternatives/github-actions/migration-ready-alternatives
48%
alternatives
Recommended

GitHub Actions Alternatives for Security & Compliance Teams

integrates with GitHub Actions

GitHub Actions
/alternatives/github-actions/security-compliance-alternatives
48%

Recommendations combine user behavior, content similarity, research intelligence, and SEO optimization