So you want to run machine learning at scale? Welcome to Kubeflow Pipelines (KFP) - what happens when you decide Kubernetes wasn't complicated enough and you need to run ML workflows on top of it. It's a container orchestration system that makes every data scientist cry and every DevOps engineer question their career choices.
After 18 months of production KFP, I can tell you exactly what you're signing up for: 6 months of setup hell, $50K in cloud costs while you figure out resource limits, and the deep satisfaction of watching your perfectly working notebook become a distributed systems nightmare.
How This Madness Actually Works
Pipeline Definition: You write Python code using KFP SDK 2.14.3, which compiles into YAML hell. Every function becomes a containerized component. The SDK spits out an Intermediate Representation that looks like someone threw a dictionary at YAML and called it a day.
Component Isolation: Every pipeline step runs in its own container, which sounds great until you realize container startup times will drive you insane. Want to run a 2-second data validation? Cool, wait 45 seconds for the container image pull and start. Your preprocessing won't break from dependency conflicts anymore, but now you're debugging pod scheduling failures at 3am instead.
Execution Engine: KFP uses Argo Workflows underneath. When your pipeline runs, Argo spins up pods that randomly fail with ImagePullBackOff because someone fucked with registry permissions. The execution gets tracked through ML Metadata, assuming the metadata store doesn't crash from concurrent writes.
ML-Specific Features That Actually Work (Sometimes)
Artifact Management: KFP has an artifact system that's genuinely useful when it's not breaking. Components pass around structured data like model objects instead of just files. The artifact lineage is solid - you can trace any model back to its training data. Just don't try to debug artifact serialization failures at 2am when your models randomly disappear from the ML Metadata registry.
Experiment Tracking: Built-in experiment management that actually doesn't suck. Compare model performance across hyperparameter sweeps without wrestling with MLflow or Weights & Biases. Each run stores metrics and artifacts with automatic versioning. The UI crashes occasionally but the data persists.
Caching System: The caching is brilliant when you configure it right.
If your data preprocessing hasn't changed, KFP skips re-running those 4-hour feature engineering jobs. Saved us like $3K last month.
But misconfigure the cache keys? You'll be debugging stale results for days while wondering why your "random" model keeps giving identical outputs.
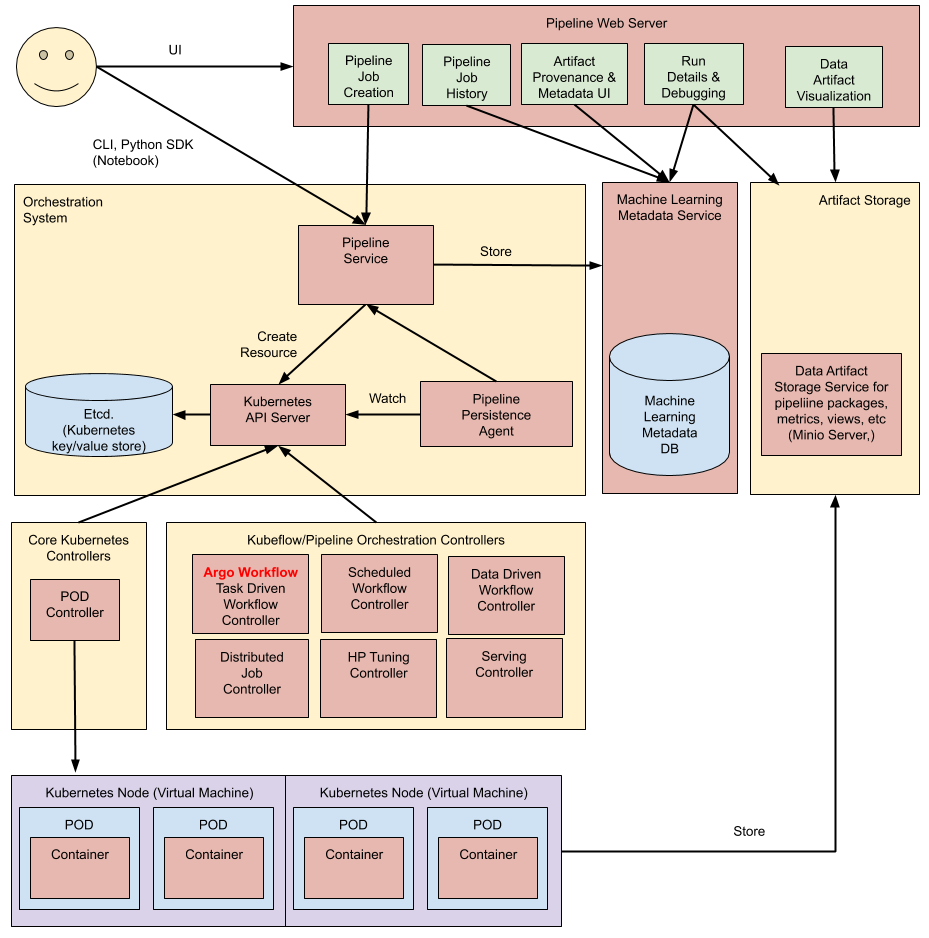
The Architecture That Keeps You Up at Night
API Server: The central control plane that'll randomly return 500 errors during high load. Stores metadata in MySQL, which means you get to debug database connection pools when everything grinds to a halt. The RBAC integration works until someone misconfigures a namespace and locks out half the team.
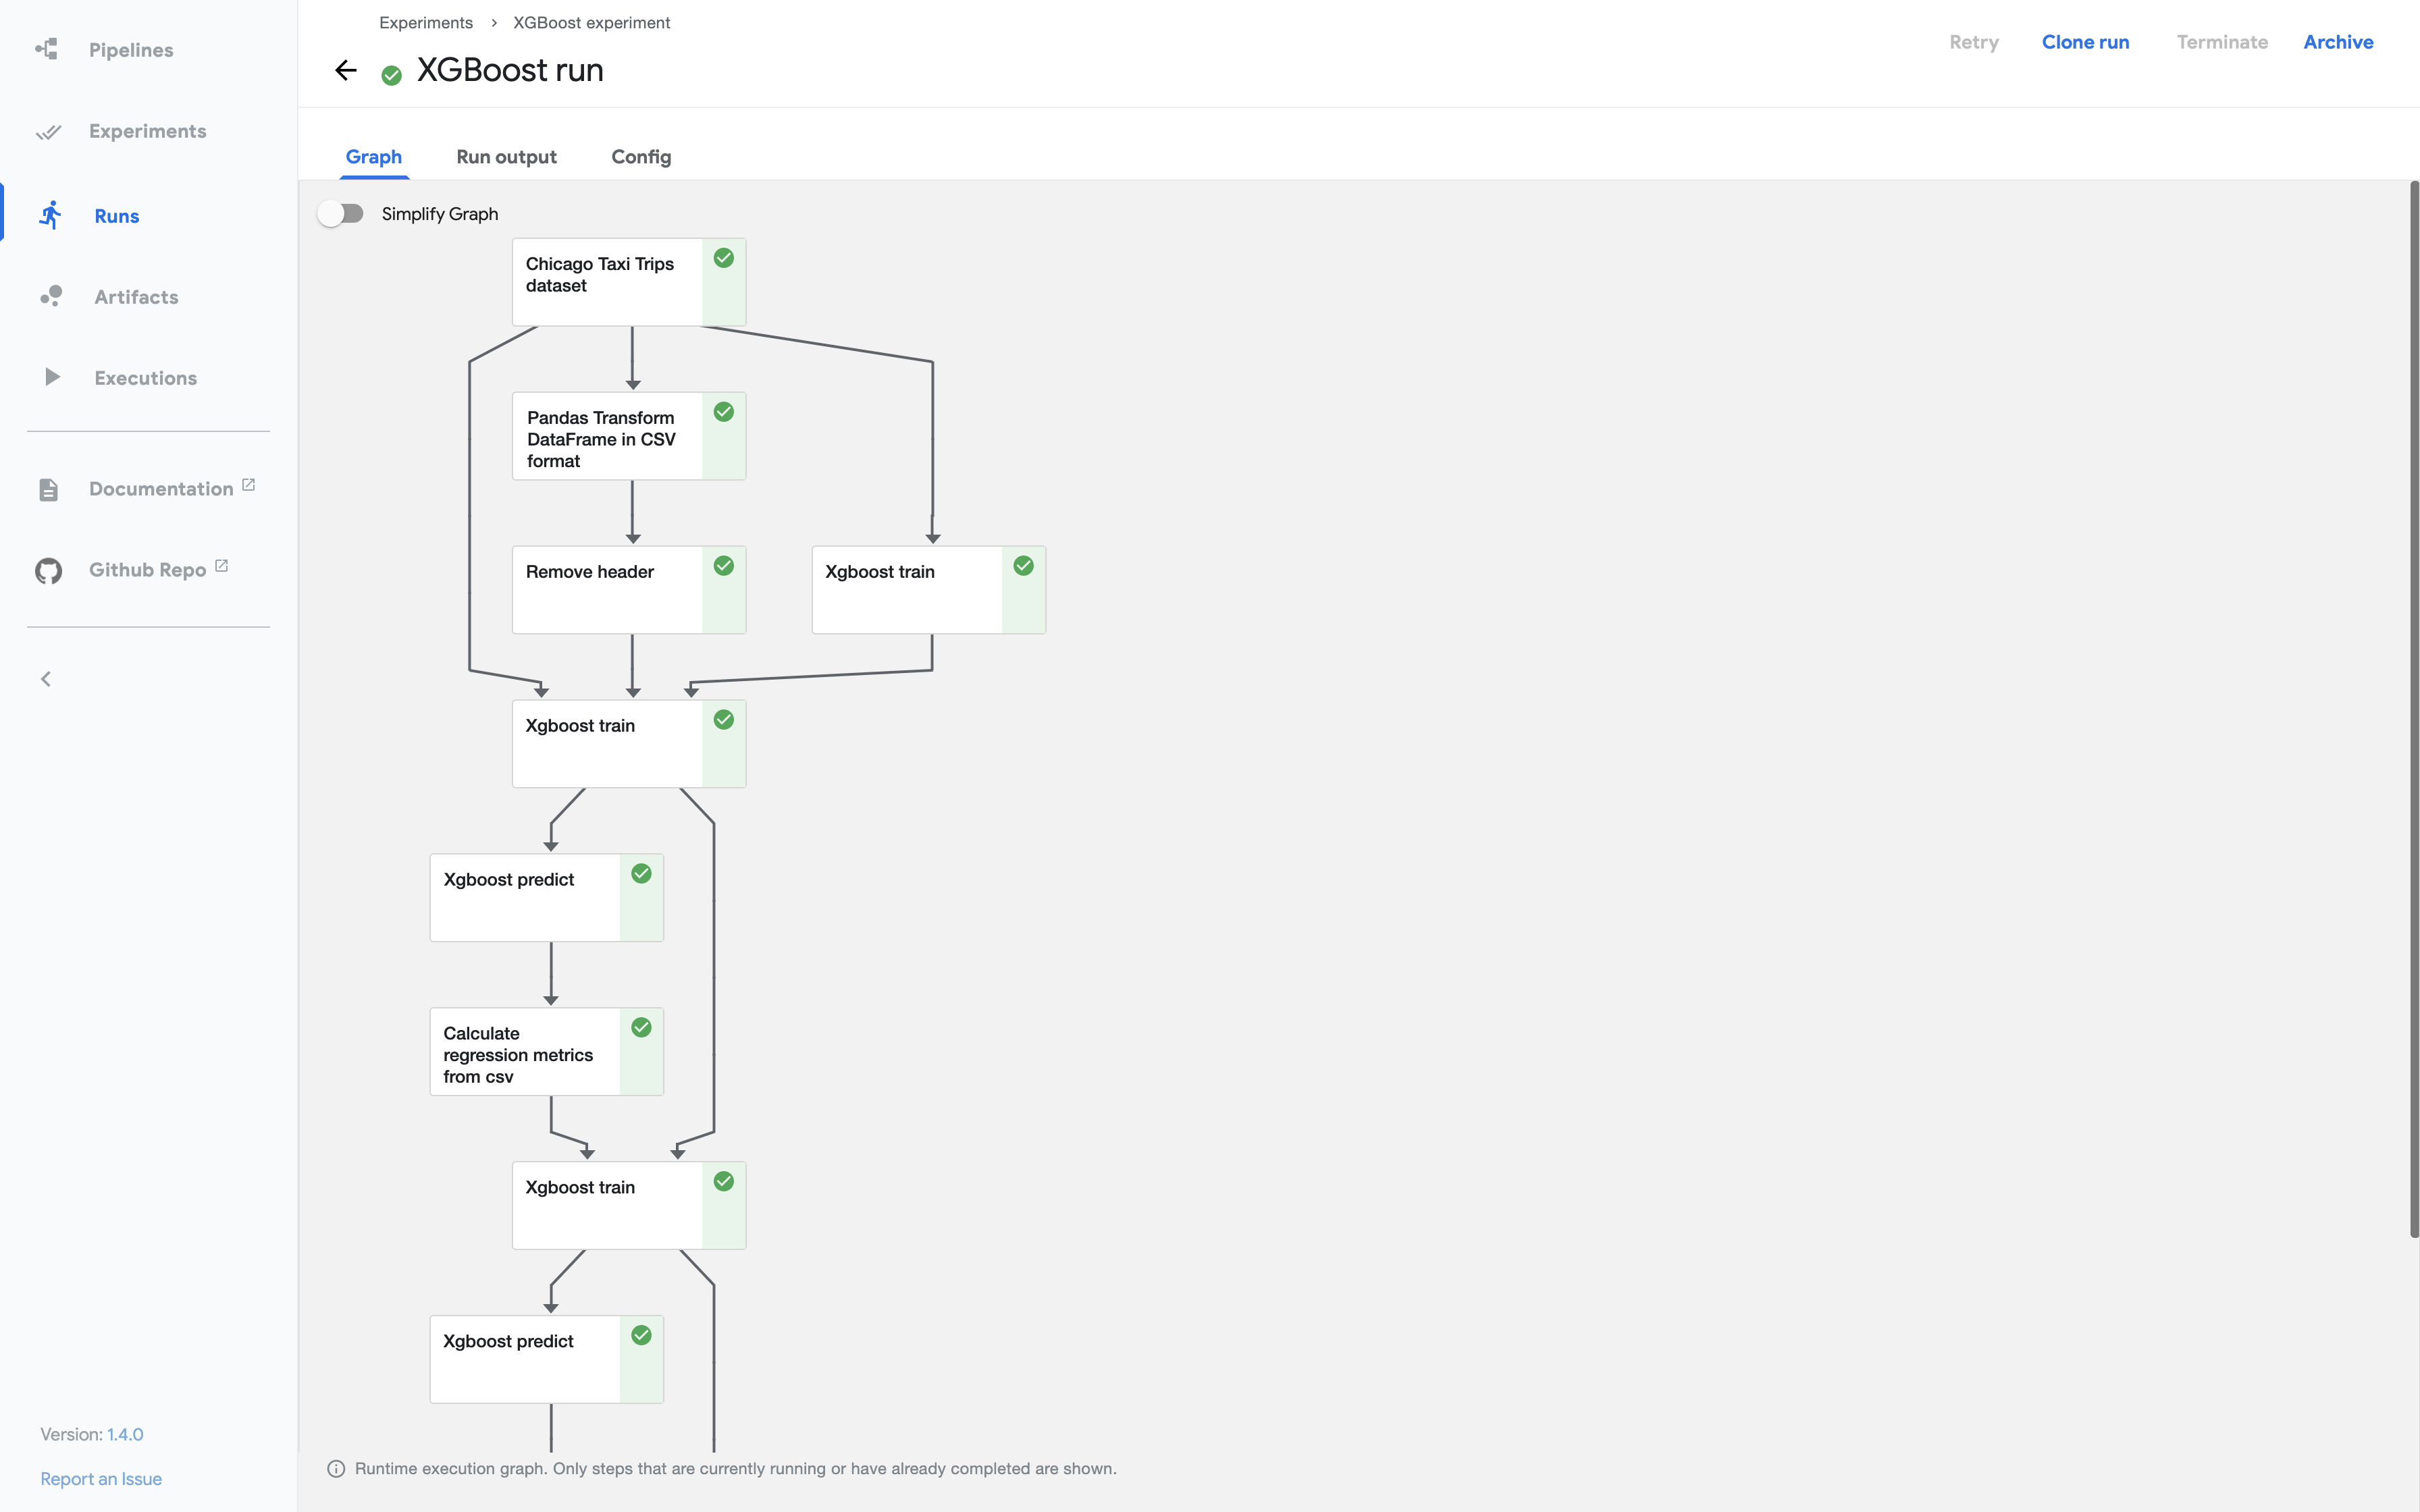
UI Dashboard: A React app that looks pretty but crashes when you load more than 50 pipeline runs. The pipeline graph visualization is actually decent - you can see which step failed and why. Just don't try to browse large experiments; the UI will timeout and you'll be back to kubectl commands.
SDK & CLI: The Python SDK is where you'll spend most of your debugging time. Version mismatches between SDK and backend will ruin your week - KFP 2.14.x SDK with a 2.13.x backend equals pipeline compilation errors that make no sense. The CLI works for CI/CD assuming your jenkins agents have the right Python version.
Storage Integration: Works great with S3, GCS, and MinIO until you hit permission issues. Configuring the pipeline root is straightforward, but debugging why artifacts randomly disappear involves diving into IAM policies and object lifecycle rules.
Performance Reality Check
We've run KFP in production for 18 months. It handles decent workloads if everything's configured perfectly.
Problem is, it's never configured perfectly.
The Argo backend scales to about 150-200 concurrent runs before etcd starts choking or the API server falls over. Storage I/O becomes the bottleneck way before CPU - especially moving our 80-120GB training datasets around.
Resource Management: You'll spend weeks figuring out CPU and memory limits. Set them too low and your training jobs die with OOMKilled. Set them too high and you're burning money on idle resources. Node affinity works for placing workloads on GPU nodes, assuming your cluster isn't a heterogeneous nightmare of different instance types.
Monitoring Integration: Prometheus integration exists and mostly works. You'll track pipeline failure rates, execution times, and watch your AWS bill explode in real-time. Grafana dashboards are decent once you figure out which metrics actually matter. Pro tip: alert on pipeline success rates dropping below 85% or you'll be firefighting failures all week.