Recognizing Cluster-Wide Production Outages vs Individual Component Failures

When everything catches fire at 3 AM and you get 47 Slack notifications in 30 seconds, the first thing you need to figure out is whether a single pod shat the bed or your entire cluster just decided to take a vacation. This isn't theoretical - get this wrong and you'll waste hours debugging the wrong shit while your manager breathes down your neck.

Here's what this section will teach you: How to perform the critical 60-second assessment that determines whether you're dealing with a manageable component failure or a cluster-wide catastrophe that requires the nuclear option. You'll learn the exact commands to run, the warning signs that indicate cascade potential, and the real-world failure patterns that have fucked over major companies. Most importantly, you'll understand how to avoid the most common mistake: debugging symptoms instead of causes.

The Difference Between Component Failures and Cluster Outages

Component failures are the Tuesday afternoon kind of broken. One service is acting up, maybe a deployment is stuck, you can still run kubectl commands and your standard debugging techniques work fine.

Cluster-wide outages are the "wake up the entire dev team at 3 AM" kind of fucked. Nothing works, kubectl just hangs, and you're about to discover that your backup plan wasn't as good as you thought.

Immediate Triage: The 60-Second Assessment

Signs of Cluster-Wide Outage

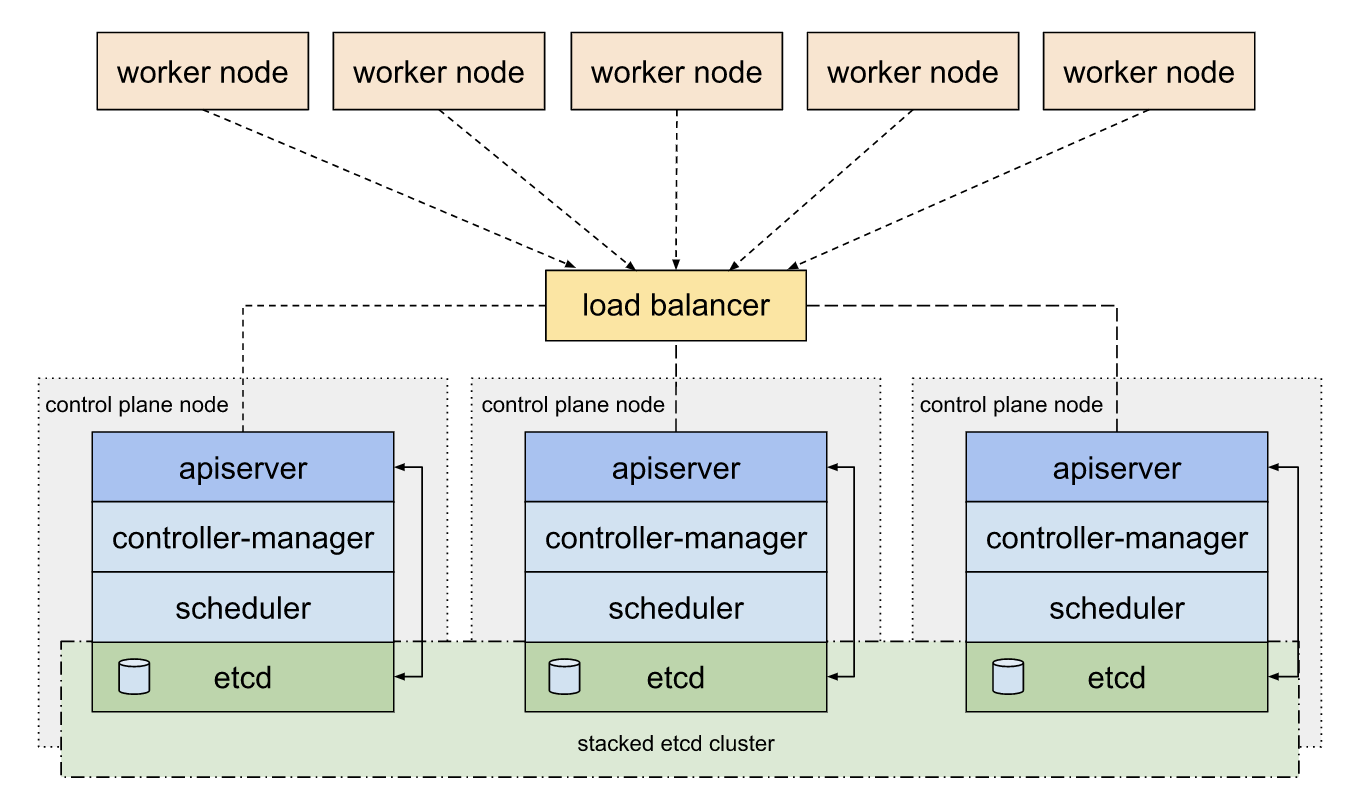
Control Plane Symptoms:

Quick verification commands:

## Test cluster connectivity (30-second timeout)
kubectl get nodes --request-timeout=30s

## Check control plane component status
kubectl get componentstatuses

## Verify API server health from outside the cluster  
curl -k https\://10.0.1.100:6443/healthz
## Replace 10.0.1.100 with your actual API server endpoint IP
## Common errors: \"connection refused\", \"context deadline exceeded\", \"x509: certificate signed by unknown authority\"

If these basic commands fail or hang, you're dealing with a cluster-wide issue.

Signs of Component-Level Issues

  • kubectl get nodes works normally
  • Some services work while others don't
  • Problems are confined to specific namespaces or applications
  • System pods in kube-system namespace are healthy
  • You can deploy test workloads successfully

Real-World Production Outage Patterns

IP Exhaustion: The Silent Cluster Killer

Here's how we got fucked completely: our cluster looked totally fine - kubectl get nodes was green, existing pods just humming along like nothing was wrong. But we couldn't deploy anything new and it took like 45 minutes of head-scratching before we found the real problem.

Here's what was actually happening:

  • AWS CNI ran out of IPs in our subnets (classic EKS gotcha that bites everyone eventually)
  • New pods just sat there Pending forever with some bullshit "insufficient resources" message
  • Existing stuff kept working fine, so our monitoring was all green (which made this extra painful)
  • Control plane was completely healthy, so we kept looking in all the wrong places first
  • kubectl describe pod eventually showed "no available IP addresses" but it was buried in like 50 lines of other garbage

Why this was extra fucking painful:

  • All our dashboards were green because existing pods were fine
  • We wasted 30 minutes assuming it was a scheduler problem (wrong)
  • The actual error was buried deep in AWS CNI logs that we never check
  • Autoscaling just... stopped working, so the next traffic spike killed us
  • Took forever - felt like hours but was probably 45 minutes of actual work and a lot of head-scratching

The brutal lesson: Partial outages are the absolute worst because they trick you into debugging the wrong shit first. Half your users are screaming, the other half haven't noticed, and you're chasing ghosts.

The Spotify \"Oops I Deleted Production\" Chronicles

Spotify fucked up their Terraform and accidentally deleted everything during what was supposed to be a routine change. Took them hours to recover because, surprise, they didn't have proper backups of their K8s configs.

What that looks like:

  • kubectl suddenly returns "cluster not found"
  • Your entire monitoring dashboard goes blank in seconds
  • No gradual degradation, no warning signs - everything just stops existing
  • The GCP console shows empty where your cluster used to be

Only reason it wasn't completely fucked: Spotify had failover systems that weren't running on Kubernetes. But if K8s was your only infrastructure? You're done.

What made it worse: I bet they had three different people trying to fix it at the same time, probably making it worse. Recovery is messy when everyone panics.

The Monzo Banking Kubernetes Bug That Ate Production (2017)

Monzo got completely fucked by some old Kubernetes bug that took down their entire cluster for over an hour. Customer payments just stopped working.

What went sideways:

  • A dormant K8s bug triggered during routine operations
  • Control plane components started failing in a cascade
  • New pods couldn't schedule, existing ones started dying
  • Payment processing completely stopped - bank customers couldn't move money

Why it was extra painful:

  • No gradual degradation - the cluster just shit the bed all at once
  • Their monitoring couldn't help them diagnose a bug in Kubernetes itself
  • Recovery required rebuilding the cluster while customers were locked out of their bank accounts
  • The post-mortem revealed multiple failure points happening simultaneously

The brutal lesson: Even mature platforms like Kubernetes can have deep bugs that only surface when all the wrong things happen at once. And when they do, there's no "quick fix" - you're rebuilding from scratch.

The DNS Cascade: When Everything Breaks Because Nothing Can Talk

Here's the nightmare scenario that'll keep you up at night: your control plane gets unstable and DNS stops working. Suddenly even your healthy apps can't function because they can't resolve basic service names. Render learned this the hard way in 2022.

How it goes to hell:

  1. Something triggers etcd stress (memory spike, network hiccup, whatever)
  2. API server starts choking (timeouts, slow responses, general misery)
  3. CoreDNS pods die but can't restart because API server is fucked
  4. Everything else dies because nothing can resolve DNS anymore

Kubernetes Monitoring Dashboard

It's simple and completely devastating. Your dashboard goes completely red.

CoreDNS Monitoring

Detection commands:

## Check if DNS is working from within pods
kubectl exec -it <any-running-pod> -- nslookup kubernetes.default

## Verify CoreDNS pod health
kubectl get pods -n kube-system -l k8s-app=kube-dns

## Test API server DNS resolution
kubectl exec -it <pod> -- nslookup kubernetes.default.svc.cluster.local

The \"Is Everything Actually Fucked?\" Decision Tree

Step 1: Can you even run kubectl without it hanging?

YES → Great, run kubectl get nodes and kubectl get pods --all-namespaces right now

  • All green and mostly running? → It's probably just one service being a pain in the ass
  • Nodes showing NotReady or tons of Pending pods? → Your infrastructure is having a bad time
  • Weird mixed status everywhere? → Something is cascading and it's about to get worse

NO → Your control plane is dead, Jim

  • Try kubectl from a different machine/network (maybe it's just your connection)
  • Check AWS/GCP/Azure status pages (maybe it's not your fault)
  • SSH directly to control plane nodes if you can (spoiler: you probably can't)

SORT OF → kubectl works but your apps are returning 500s everywhere

  • DNS is probably fucked (check CoreDNS pods)
  • Your ingress controller might be dead
  • Load balancers could be routing traffic to nowhere

Kubernetes Troubleshooting Workflow

What to Actually Do When Everything is on Fire

First 5 minutes (while you're still panicking):

  1. Wake everyone up: Post in #incidents, page the on-call team, text your manager
  2. Check if it's not your fault: AWS status, GCP status, whatever cloud you're using
  3. Try kubectl from different places: Your laptop, a server, a different VPN - rule out network issues
  4. Screenshot everything: Trust me, you'll forget what the error messages looked like

Next 10 minutes (when the adrenaline kicks in):

  1. Figure out what's actually broken: Is it just you? Just one region? Everything?
  2. Hit the big red button: If you have backup infrastructure, start failing over NOW
  3. Start collecting evidence: Control plane logs, cloud events, anything that might be useful
  4. Update the war room: Keep people informed so they stop asking "what's the status?"

The hard truth: Those first 15 minutes determine whether your outage becomes a minor incident or a career-defining disaster. The difference isn't technical skill - it's having a systematic approach that works under pressure and knowing exactly which questions to ask first. Every minute you spend debugging the wrong thing is another minute of customer-facing downtime and another thousand dollars in lost revenue.

The systematic recovery procedures in the following sections will walk you through the exact steps for different failure scenarios, from simple etcd hiccups to complete cluster destruction. But none of it matters if you don't correctly diagnose what type of outage you're dealing with first.

Control Plane Recovery: Bringing Your Cluster Back from the Dead

When your control plane dies, you're not debugging a single broken pod - you're trying to resurrect the brain of your entire infrastructure while your manager asks for ETAs every 5 minutes. Here's what actually works when everything is falling apart.

Control Plane Architecture and Failure Points

Kubernetes Architecture

The Kubernetes control plane consists of four critical components that must work in harmony:

  • etcd: The cluster's persistent data store containing all configuration and state
  • kube-apiserver: The central management hub that validates and processes API requests
  • kube-scheduler: Assigns pods to nodes based on resource requirements and constraints
  • kube-controller-manager: Runs control loops that regulate cluster state

Failure hierarchy: etcd dies = you're completely fucked and might lose everything. API server dies = you can't control anything but stuff keeps running. Scheduler/controller-manager die = new things won't start but existing stuff mostly works.

etcd Recovery: The Foundation of Cluster Recovery

etcd in Kubernetes

etcd failures represent the most severe cluster outage scenario. As the single source of truth for all cluster state, etcd corruption or unavailability can render your entire cluster unusable.

Diagnosing etcd Health Issues

Primary diagnostic commands:

## Check etcd cluster health
kubectl get componentstatuses
etcdctl endpoint health --cluster

## Verify etcd member list
etcdctl member list --write-out=table

## Check etcd metrics and performance
etcdctl endpoint status --cluster --write-out=table

## Monitor etcd logs for errors
kubectl logs -n kube-system etcd-<control-plane-node>

Common etcd failure signatures:

etcd Recovery Scenarios

Scenario 1: etcd Cluster Majority Failure (2/3 or 3/5 nodes down)

When this happens: Network partitions, simultaneous node failures, or disk corruption affect multiple etcd members.

Recovery approach:

  1. Stop all etcd members to prevent split-brain scenarios
  2. Restore from backup using the latest available etcd snapshot
  3. Bootstrap new cluster with restored data
  4. Rejoin remaining healthy members to the cluster
## Stop etcd on all control plane nodes
systemctl stop etcd

## Restore from backup on leader node (fix the IPs obviously)
etcdctl snapshot restore snapshot.db \
  --name etcd-1 \
  --initial-cluster etcd-1=https://etcd-node1.local:2380 \
  --initial-cluster-token etcd-cluster-1 \
  --initial-advertise-peer-urls https\://10.0.1.101:2380

## Start etcd with restored data
systemctl start etcd

## Verify cluster health before adding members
etcdctl endpoint health

Here's what actually happens: etcd restore looks simple in the docs but always goes sideways. First you find out your backup is from 6 hours ago instead of the 30 minutes you thought. Then the restore fails at 90% with some cryptic etcdctl error. I've learned to always budget most of the day because etcdctl gives you the most useless error messages when shit breaks.

Scenario 2: Single etcd Member Failure in HA Cluster

When this happens: One etcd node experiences hardware failure, disk corruption, or network isolation while others remain healthy.

Recovery approach:

  1. Remove failed member from cluster
  2. Add new member with same configuration
  3. Wait for data replication to catch up
## List current members and identify failed one
etcdctl member list

## Remove failed member (use member ID from list command)
etcdctl member remove <failed-member-id>

## Add new member with same name and endpoints
etcdctl member add etcd-3 --peer-urls=https://10.0.1.12:2380

## Start etcd on replacement node
systemctl start etcd

## Verify member successfully joined
etcdctl endpoint health --cluster

Don't be like me: I declared victory after 30 seconds once and watched the new member die 10 minutes later when we got a client flood. Give it at least 5 minutes to see if the replacement actually works. etcd is sneaky like that - looks healthy until it gets loaded.

Kubernetes Components

etcd Backup and Restore Best Practices

Automated backup strategy:

#!/bin/bash
## Daily etcd backup script
BACKUP_DIR=\"/var/backups/etcd\"
BACKUP_NAME=\"etcd-snapshot-$(date +%Y%m%d-%H%M%S).db\"

etcdctl snapshot save ${BACKUP_DIR}/${BACKUP_NAME} \
  --endpoints=https://127.0.0.1:2379 \
  --cacert=/etc/kubernetes/pki/etcd/ca.crt \
  --cert=/etc/kubernetes/pki/etcd/peer.crt \
  --key=/etc/kubernetes/pki/etcd/peer.key

## Verify backup integrity - THIS STEP IS CRITICAL
etcdctl snapshot status ${BACKUP_DIR}/${BACKUP_NAME} --write-out=table

## CRITICAL: etcd versions have different restore syntax - check first
## etcd --version  
## Older versions (3.4.x) use --initial-cluster-state=new, newer versions (3.5.x+) may have different requirements
## etcd 3.6.x (current stable as of 2025) has additional syntax changes - always check the docs

## Retain only last 7 days of backups
find ${BACKUP_DIR} -name \"etcd-snapshot-*.db\" -mtime +7 -delete

Container Debugging

Recovery validation checklist:

  • Verify etcd cluster reports all members healthy
  • Confirm API server can connect to etcd successfully
  • Test basic cluster operations (kubectl get nodes, kubectl create namespace test)
  • Validate that existing workloads continue running normally

API Server Recovery: Restoring Cluster Management

API server failures manifest as kubectl command timeouts, dashboard inaccessibility, and inability to schedule new workloads. Unlike etcd failures, API server issues are often easier to recover from since the underlying data remains intact.

API Server Failure Patterns

Pattern 1: Configuration Issues (50% of API server failures)

Common causes:

  • Invalid certificate configurations after certificate rotation
  • Incorrect etcd endpoints in API server configuration
  • Resource exhaustion (CPU, memory, file descriptors)
  • Admission controller webhook failures

Diagnostic approach:

## Check API server pod logs
kubectl logs -n kube-system kube-apiserver-<control-plane-node>

## Verify API server process status on control plane
systemctl status kubelet
ps aux | grep kube-apiserver

## Test direct API server connectivity
curl -k https://<api-server>:6443/healthz

## Check certificate validity
openssl x509 -in /etc/kubernetes/pki/apiserver.crt -text -noout | grep \"Not After\"

Recovery steps:

  1. Review recent configuration changes in /etc/kubernetes/manifests/kube-apiserver.yaml
  2. Restore previous working configuration from backup or version control
  3. Restart kubelet to reload static pod manifests: systemctl restart kubelet
  4. Wait 2-3 minutes for API server pod to restart and become ready
Pattern 2: Resource Exhaustion

Symptoms:

  • API server responds slowly or times out
  • High CPU or memory usage on control plane nodes
  • etcd request timeouts due to API server overload

Immediate remediation:

## Check resource usage on control plane
top -p $(pgrep kube-apiserver)
free -h
df -h

## Identify resource-intensive API calls
grep \"took longer than\" /var/log/pods/kube-system_kube-apiserver-*/kube-apiserver/*.log

## Increase API server resource limits temporarily
kubectl patch -n kube-system --type='merge' --patch='{\"spec\":{\"containers\":[{\"name\":\"kube-apiserver\",\"resources\":{\"requests\":{\"memory\":\"512Mi\",\"cpu\":\"500m\"},\"limits\":{\"memory\":\"1Gi\",\"cpu\":\"1000m\"}}}]}}' pod/kube-apiserver-<node>
Pattern 3: Network Connectivity Issues

Symptoms:

  • API server starts successfully but clients can't connect
  • Load balancer health checks fail
  • Certificate or DNS resolution errors

Network troubleshooting:

## Test API server listening ports
netstat -tulpn | grep 6443

## Verify load balancer configuration
curl -k https://<load-balancer>:6443/healthz

## Check API server service endpoints
kubectl get endpoints kubernetes -o yaml

## Test internal cluster DNS resolution
nslookup kubernetes.default.svc.cluster.local

Multi-Master Control Plane Recovery

High Availability (HA) Kubernetes clusters run multiple control plane instances to prevent single points of failure. However, HA configurations introduce additional complexity during outage recovery.

Staggered Recovery for HA Clusters

Recovery sequence: Always recover etcd first, then API servers, then scheduler and controller-manager components.

Phase 1: etcd Cluster Recovery

  1. Identify healthy etcd members: etcdctl member list --write-out=table
  2. Recover majority: Ensure at least 2 out of 3 (or 3 out of 5) etcd members are healthy
  3. Remove failed members: Clean up dead etcd instances before adding replacements

Phase 2: API Server Coordination

## Start API servers one at a time, waiting for each to become ready
systemctl start kubelet  # On first control plane node
kubectl get pods -n kube-system -l component=kube-apiserver

## Verify first API server healthy before starting others
curl -k https://<first-api-server>:6443/healthz

## Start remaining API servers
systemctl start kubelet  # On other control plane nodes

Phase 3: Scheduler and Controller-Manager

  • These components use leader election, so starting multiple instances is safe
  • Verify leader election is working: kubectl get endpoints -n kube-system kube-scheduler
  • Check for control loops resuming: kubectl get events --sort-by='.lastTimestamp'

Common HA Recovery Pitfalls

Split-brain scenarios: If network partitions separate control plane nodes, multiple API servers might accept conflicting updates. Always ensure etcd cluster has achieved quorum before allowing API server traffic.

Certificate synchronization: API server certificates must be valid and synchronized across all control plane nodes. Mismatched certificates cause intermittent failures as load balancers route requests to different API servers.

Load balancer configuration: External load balancers must health-check API servers correctly. Misconfigured health checks can route traffic to failed API servers, causing user-facing intermittent failures.

Validation and Monitoring Recovery Progress

Post-recovery validation checklist:

  1. Control plane health: kubectl get componentstatuses shows all components healthy
  2. Node connectivity: kubectl get nodes displays all nodes as Ready
  3. Basic operations: Create and delete test namespaces and deployments
  4. Workload health: Existing applications continue running without restarts
  5. Cluster operations: Scaling, rolling updates, and service discovery work normally

Monitoring recovery metrics:

  • API server request latency returns to baseline (typically <100ms)
  • etcd disk I/O and network latency normalize
  • Control plane CPU and memory usage stabilize
  • No error events in kubectl get events --all-namespaces

Kubernetes Disaster Recovery

Recovery times for control plane failures (learned the hard way):

  • API server config issues: 5 minutes if you immediately check the obvious thing first. Otherwise, plan for an hour of debugging why certs expired
  • Single etcd member replacement: 20-30 minutes if everything goes right. Add 2 hours if you forget to update the cluster config first like I did
  • Complete etcd cluster restore: Could take 30 minutes to all fucking day. First time I did this, I spent 3 hours on the wrong backup file
  • Full control plane rebuild: Budget a whole day and get help from someone who's done it before

Critical warning: Control plane recovery is only the beginning. What starts as a simple etcd hiccup can trigger cascading failures that take down DNS, networking, and every app in your cluster. Even if you restore the control plane perfectly, you're not done until you've broken the cascade chain and verified that secondary failures aren't spreading through your infrastructure.

Understanding how one failing component triggers dependent system failures is the difference between a 30-minute etcd recovery and a 12-hour outage where "everything keeps breaking." The next section covers systematic approaches for identifying, interrupting, and preventing these cascade patterns before they turn your manageable incident into a career-defining disaster.

Cascading Failure Recovery and Prevention: Breaking the Chain of Dependencies

Kubernetes production outages rarely remain isolated. A single component failure triggers a cascade of dependent system failures, turning manageable incidents into multi-hour catastrophic outages. Understanding and interrupting these cascade patterns is critical for effective production recovery.

The Anatomy of Cascading Failures

Here's the nightmare: one component dies and triggers a chain reaction that kills everything else.

The Typical Death Spiral

Then the control plane gets fucked:

Then DNS shits the bed:

  • CoreDNS pods can't restart because they depend on the API server
  • Apps can't resolve DNS, so internal service calls fail
  • Health checks fail due to DNS resolution errors
  • Load balancers mark healthy backends as unhealthy

Then everything else dies:

  • Even previously healthy applications become unreachable
  • Database connections fail due to DNS resolution issues
  • User-facing services return errors despite underlying systems being functional
  • Recovery becomes impossible without external intervention

Real-World Cascade Analysis: The Render Frankfurt Incident (2022)

Render learned this the hard way when their etcd got stressed and DNS took down the entire platform.

What happened: etcd memory spike fucked the control plane
Then it cascaded:

  1. etcd overload → API server started timing out
  2. API server failures → CoreDNS pods couldn't restart
  3. DNS down → healthy services couldn't resolve internal dependencies
  4. Everything broke → user-facing services became completely inaccessible

What made it worse: DNS broke, so even healthy services couldn't talk to each other. Total outage.

Recovery approach:

  1. Stabilize etcd by restarting affected etcd instances
  2. Force CoreDNS restart by manually deleting and recreating pods
  3. Validate DNS resolution before declaring recovery complete
  4. Implement DNS independence by running CoreDNS on dedicated nodes

Breaking Cascade Chains: Systematic Intervention Strategies

Strategy 1: Dependency Mapping and Circuit Breaking

Pre-incident preparation: Map critical dependency chains in your cluster architecture.

Essential dependency chains to document:

  • DNS dependencies: Which services require DNS resolution for startup?
  • Storage dependencies: Which workloads depend on persistent volume availability?
  • Network dependencies: Which services must communicate for basic functionality?
  • Control plane dependencies: Which operations require API server availability?

Cascade breaking technique:

## Emergency DNS bypass - point services to IP addresses temporarily
kubectl patch service <service-name> -p '{"spec":{"clusterIP":"<known-ip>"}}'

## Bypass DNS in application pods by updating /etc/hosts
kubectl exec -it <pod> -- sh -c 'echo "<service-ip> <service-name>" >> /etc/hosts'

## Temporarily disable health checks to prevent healthy services from being marked down
kubectl patch deployment <app> -p '{"spec":{"template":{"spec":{"containers":[{"name":"<container>","readinessProbe":null,"livenessProbe":null}]}}}}'

Strategy 2: Controlled Component Isolation

When multiple systems are failing simultaneously, isolate and recover components in dependency order rather than attempting parallel recovery.

Recovery priority order:

  1. Infrastructure layer: Nodes, networking, storage
  2. Control plane: etcd, API server, scheduler, controller-manager
  3. System services: DNS, ingress controllers, monitoring
  4. Application services: User-facing applications and APIs

Controlled isolation approach:

## Isolate failing nodes to prevent cascade propagation
kubectl cordon <problematic-node>
kubectl drain <problematic-node> --ignore-daemonsets --delete-emptydir-data

## Temporarily scale down non-essential services
kubectl scale deployment <non-critical-service> --replicas=0

## Pause automatic operations that might interfere with recovery
kubectl patch deployment <deployment> -p '{"spec":{"paused":true}}'

Infrastructure-Level Cascading Failures

Node Failure Cascades

Pattern: Single node failure triggers resource shortage, causing pod eviction, which overloads remaining nodes, leading to additional node failures.

Detection:

## Identify nodes under resource pressure
kubectl describe nodes | grep -A 5 "Conditions:"

## Check for memory or disk pressure events
kubectl get events --field-selector reason=MemoryPressure,DiskPressure --all-namespaces

## Monitor node resource utilization trends
kubectl top nodes --sort-by=memory
kubectl top nodes --sort-by=cpu

Intervention strategies:

  1. Immediate resource relief: Scale down non-critical workloads
  2. Pod priority enforcement: Use pod priority classes to evict low-priority workloads first
  3. Resource request adjustments: Temporarily reduce resource requests for critical services
  4. Emergency node addition: Rapidly provision additional cluster capacity

Emergency resource management:

## Identify pods with highest resource consumption
kubectl top pods --all-namespaces --sort-by=memory | head -20
kubectl top pods --all-namespaces --sort-by=cpu | head -20

## Emergency pod priority adjustment
kubectl patch pod <high-priority-pod> -p '{"spec":{"priorityClassName":"system-cluster-critical"}}'

## Force evict resource-intensive non-critical pods
kubectl delete pod <resource-intensive-pod> --grace-period=0 --force

Storage Cascading Failures

Pattern: Storage backend failure (EBS outage, NFS server failure) causes pods with persistent volumes to become stuck, leading to node resource exhaustion and eventual node failure.

Detection and mitigation:

## Identify pods stuck in terminating state due to storage issues
kubectl get pods --all-namespaces | grep Terminating

## Check persistent volume claim status
kubectl get pvc --all-namespaces | grep -v Bound

## Force cleanup of stuck pods (use with caution)
kubectl patch pod <stuck-pod> -p '{"metadata":{"finalizers":null}}'

## Temporarily detach problematic persistent volumes
kubectl patch pvc <pvc-name> -p '{"metadata":{"finalizers":null}}'

Network Cascading Failures

CNI Plugin Failures

Pattern: Container Network Interface (CNI) plugin failures prevent pod networking, causing pods to remain stuck in ContainerCreating state, eventually exhausting node resources.

Common CNI cascade triggers:

  • AWS VPC CNI IP exhaustion (common issue in EKS clusters)
  • Calico or Flannel configuration conflicts during upgrades
  • Network policy misconfigurations blocking system traffic

Recovery approach:

## Diagnose CNI plugin health
kubectl get pods -n kube-system -l k8s-app=aws-node  # For AWS VPC CNI
kubectl get pods -n calico-system  # For Calico
kubectl logs -n kube-system <cni-pod>

## Check available IP addresses (AWS specific)
kubectl describe node <node> | grep "vpc.amazonaws.com/pod-eni"

## Emergency CNI restart
kubectl delete pod -n kube-system -l k8s-app=aws-node
kubectl delete pod -n calico-system -l k8s-app=calico-node

Ingress Controller Cascade Failures

Pattern: Ingress controller failure causes all external traffic to fail, triggering application-level failovers that overload internal services.

Recovery prioritization:

  1. Restore ingress controller functionality before attempting application-level fixes
  2. Validate ingress rules aren't causing controller crashes
  3. Check external dependencies (load balancers, DNS, certificates)
## Emergency ingress controller restart
kubectl rollout restart deployment/<ingress-controller> -n <ingress-namespace>

## Check ingress controller resource consumption
kubectl top pods -n <ingress-namespace> --sort-by=memory

## Validate ingress configuration
kubectl get ingress --all-namespaces -o yaml | kubectl validate -f -

Prevention: Building Cascade-Resistant Architectures

Dependency Isolation Strategies

1. DNS Independence

## Run CoreDNS on dedicated nodes to prevent control plane dependency
apiVersion: apps/v1
kind: Deployment
metadata:
  name: coredns
spec:
  template:
    spec:
      nodeSelector:
        node-role.kubernetes.io/dns: "true"
      tolerations:
      - key: node-role.kubernetes.io/dns
        operator: Equal
        value: "true"
        effect: NoSchedule

2. Critical Service Pinning

## Pin critical services to specific nodes to prevent cascade propagation
apiVersion: apps/v1
kind: Deployment
metadata:
  name: critical-service
spec:
  template:
    spec:
      nodeSelector:
        node-role.kubernetes.io/critical: "true"
      tolerations:
      - key: node-role.kubernetes.io/critical
        operator: Equal
        value: "true"
        effect: NoSchedule

3. Circuit Breaker Implementation

## Use pod disruption budgets to prevent cascading evictions
apiVersion: policy/v1
kind: PodDisruptionBudget
metadata:
  name: critical-service-pdb
spec:
  minAvailable: 2
  selector:
    matchLabels:
      app: critical-service

Monitoring and Alerting for Cascade Prevention

Essential cascade detection metrics:

  • Control plane component restart rates
  • DNS resolution failure rates within the cluster
  • Pod creation/deletion rates (spikes indicate cascading issues)
  • Node resource utilization trends
  • etcd performance metrics (request latency, disk I/O)

Cascade prevention alerts:

## Example Prometheus alert for cascade detection
groups:
- name: cascade-prevention
  rules:
  - alert: MultipleComponentFailures
    expr: up{job=~"kubernetes-.*"} == 0
    for: 5m
    labels:
      severity: critical
    annotations:
      summary: "Multiple Kubernetes components failing - possible cascade"
      
  - alert: DNSResolutionFailures
    expr: coredns_dns_request_duration_seconds{rcode="SERVFAIL"} > 0.1
    for: 2m
    labels:
      severity: warning
    annotations:
      summary: "DNS resolution failures detected - potential cascade trigger"

Recovery Time Objectives for Cascade Scenarios

Cascade failure recovery takes way longer than fixing one thing:

  • Simple cascade (DNS + API server): 30 minutes if you immediately know what broke. 3 hours if you waste time debugging the symptoms first like I always do
  • Complex cascade (storage + networking + control plane): Plan for most of your day and order dinner
  • Cross-region cascade (multi-cluster dependencies): You're fucked for at least a day. I've had these take a whole weekend

Recovery acceleration strategies:

  1. Pre-built runbooks for common cascade patterns (that you actually test and keep updated)
  2. Automated cascade detection with early intervention triggers
  3. Emergency access patterns that bypass normal cluster dependencies
  4. Regular cascade simulation exercises - learned this after spending a weekend figuring out recovery procedures during a real outage

Understanding cascading failure patterns and having systematic intervention strategies can reduce catastrophic outage duration by 60-80%. But knowledge without practical application is worthless when you're staring at a cluster meltdown at 3am.

Key takeaway: Every cascade starts with a single component failure. Your ability to recognize the cascade potential in that first failure and take immediate circuit-breaking action determines whether you'll be back in bed in 30 minutes or still debugging at sunrise. The systematic intervention strategies above aren't just theory - they're battle-tested approaches that work when you're operating under maximum stress with limited information.

The FAQ section that follows addresses the most common questions engineers ask during real outages - the panicked "what the fuck do I do now?" moments when standard troubleshooting guides fall apart and you need concrete, actionable answers that actually work.

Production Outage Recovery FAQ - Shit You'll Ask When Everything is Broken

Q

How the fuck do I tell if my entire cluster is dead or just one thing?

A

The 30-second test: Run kubectl get nodes --request-timeout=30s and see what happens:

  • Works fine → Only one service is being an asshole, you can debug normally
  • Hangs forever or fails → Your control plane is dead, prepare for pain
  • Shows nodes as NotReady everywhere → Infrastructure is fucked or something is cascading

Backup test: Try hitting your monitoring dashboard or Kubernetes dashboard. If multiple monitoring systems all went dark at the same time, congrats - you have a real outage on your hands.

Q

kubectl is just hanging there like an idiot - what now?

A

Check these things in order (don't skip around):

  1. Is the API server even responding? curl -k https://your-api-server:6443/healthz
  2. Is the API server process running? SSH to a control plane node: docker ps | grep kube-apiserver
  3. Is etcd dead? etcdctl endpoint health --cluster - usually fails with "context deadline exceeded"
  4. Are the control plane nodes out of resources? top, free -h, df -h on control plane boxes

kubectl Commands Cheat Sheet

If somehow all that looks fine but kubectl still won't work: Your kubeconfig is probably pointing at the wrong place or your certs are fucked. Check /etc/kubernetes/admin.conf or wherever your config lives.

Q

How long do I waste trying to fix etcd before I just restore from backup?

A

Real timeline (not the bullshit in the docs):

  • First 15 minutes: Try the "simple" etcd member recovery stuff while people are still calm
  • 15-30 minutes: Get your hands dirty with manual etcd replacement while your manager starts hovering
  • 30-45 minutes: If it's still fucked and customers are complaining, cut your losses and restore from backup
  • 45+ minutes: You should have restored already. I learned this the hard way - don't be a hero

The brutal truth: If you lost 2 out of 3 etcd members (or 3 out of 5), stop pretending you can fix this easily. Restore from backup immediately because etcd can't even elect a leader anymore.

Q

Can I recover a cluster if all control plane nodes are destroyed?

A

Yes, but requires preparation: You need recent etcd backups stored externally (not on the destroyed nodes).

Recovery approach:

  1. Provision new control plane nodes with same network configuration
  2. Restore etcd from backup using etcdctl snapshot restore
  3. Regenerate certificates if needed (check if they were backed up)
  4. Reconfigure API server, scheduler, controller-manager to point to restored etcd
  5. Worker nodes should automatically reconnect once control plane is restored

Timeline: Complete cluster rebuild could take 1 hour if you've automated everything and practiced. More likely 4-8 hours if you're figuring it out as you go.

Q

During cascading failures, should I fix multiple components simultaneously or sequentially?

A

Always sequential recovery in dependency order:

  1. Infrastructure first: Fix nodes, networking, storage issues
  2. Control plane: etcd → API server → scheduler/controller-manager
  3. System services: DNS, ingress, monitoring
  4. Applications: User-facing services

Why sequential? Parallel recovery can cause resource conflicts, duplicate work, and make it harder to identify which fixes are working. Dependencies mean fixing component A often automatically resolves issues in component B.

Q

How do I force restart stuck system pods during control plane recovery?

A

For static pods (API server, etcd, scheduler):

## Move manifest temporarily to stop pod
sudo mv /etc/kubernetes/manifests/kube-apiserver.yaml /tmp/
sleep 10
sudo mv /tmp/kube-apiserver.yaml /etc/kubernetes/manifests/

For regular system pods:

## Force delete with grace period bypass (use with caution)
kubectl delete pod <stuck-pod> -n kube-system --grace-period=0 --force

## If kubectl isn't working, use docker/containerd directly
docker stop <container-id> && docker rm <container-id>
crictl stopp <pod-id> && crictl rmp <pod-id>
Q

My cluster has partial connectivity - some nodes work, others don't. What's happening?

A

Most likely causes:

  1. Network partition: Some nodes can't reach control plane due to network issues
  2. Certificate expiration: Node certificates expired and can't renew due to API server issues
  3. Resource exhaustion: Some nodes hit memory/disk limits and became unresponsive
  4. CNI plugin failure: Container networking is broken on affected nodes

Diagnosis approach:

## Check node status and conditions
kubectl describe node <problematic-node>

## Look for network connectivity from working nodes
kubectl exec -it <working-pod> -- ping <node-ip>

## Check certificate validity on problematic nodes
sudo openssl x509 -in /var/lib/kubelet/pki/kubelet-client-current.pem -noout -dates
Q

Can I safely restart the entire cluster during a production outage?

A

Only as a last resort and with these precautions:

Pre-restart checklist:

  • Verify recent etcd backups exist and are valid
  • Document current cluster state and errors for post-incident analysis
  • Notify all stakeholders about planned restart and expected downtime
  • Ensure you have out-of-band access to all control plane nodes

Restart sequence:

  1. Restart worker nodes first (applications will temporarily relocate)
  2. Restart control plane nodes one at a time (maintain quorum)
  3. Verify each component before proceeding to next

Expected downtime: Maybe 15-45 minutes if the restart goes smoothly. Could be hours if things don't come up right and you're troubleshooting blind.

Q

How do I know when my cluster recovery is actually complete?

A

Recovery checklist (if you can even call it that):

  • kubectl get componentstatuses shows all components healthy
  • kubectl get nodes displays all nodes as Ready
  • kubectl get pods --all-namespaces shows system pods Running
  • Can create/delete test resources: kubectl create namespace test-recovery
  • DNS resolution works: kubectl run test --image=busybox --rm -it -- nslookup kubernetes.default
  • Applications report healthy and serve traffic normally
  • Monitoring systems show metrics flowing and alerts clearing

Performance indicators:

  • API server response time returns to normal (typically <100ms)
  • etcd request latency stabilizes
  • No error events: kubectl get events --field-selector type=Warning
Q

What should I do if recovery attempts are making the outage worse?

A

Stop and stabilize immediately:

  1. Document current state before changing anything else
  2. Revert last changes if possible to return to previous state
  3. Engage additional expertise - escalate to senior engineers or vendors
  4. Consider emergency failover to backup systems if available

Communication: Tell people you're pausing to reassess. Otherwise you'll have three different people trying "fixes" at the same time and making it worse - been there.

Q

How can I prevent these types of cluster-wide outages in the future?

A

Essential prevention strategies:

  • Automated etcd backups every 6 hours with offsite storage
  • Multi-AZ control plane with proper load balancing
  • Resource monitoring and alerting for control plane components
  • Regular disaster recovery drills to practice recovery procedures
  • Dependency documentation to understand cascade failure patterns
  • Circuit breakers and timeouts to limit blast radius of component failures

Monitoring priorities: Focus on control plane health metrics, etcd performance, and early warning indicators of resource exhaustion before they cause outages.

Kubernetes Production Outage Recovery - Strategy Comparison and Decision Matrix

Failure Scenario

Recovery Time

Data Loss Risk

Complexity

Business Impact

Recommended Approach

Single etcd member down

15-30 minutes

None (quorum maintained)

Low

Minimal

Member replacement + rejoin

etcd majority failure

30-90 minutes

Potential recent changes

High

Severe

Immediate backup restore

API server configuration error

5-15 minutes

None

Low

High (no deployments)

Revert config + restart

API server resource exhaustion

10-30 minutes

None

Medium

High

Scale resources + optimization

Control plane network partition

15-45 minutes

None

Medium

Severe

Network troubleshooting + DNS

Complete cluster destruction

1-4 hours

Depends on backup age

Very High

Critical

Full cluster rebuild

Cascading DNS failure

20-60 minutes

None

Medium

Critical

DNS isolation + circuit breaking

Related Tools & Recommendations

integration
Similar content

Temporal Kubernetes Production Deployment Guide: Avoid Failures

What I learned after three failed production deployments

Temporal
/integration/temporal-kubernetes/production-deployment-guide
100%
troubleshoot
Similar content

Debug Kubernetes AI GPU Failures: Pods Stuck Pending & OOM

Debugging workflows for when Kubernetes decides your AI workload doesn't deserve those GPUs. Based on 3am production incidents where everything was on fire.

Kubernetes
/troubleshoot/kubernetes-ai-workload-deployment-issues/ai-workload-gpu-resource-failures
96%
compare
Recommended

PostgreSQL vs MySQL vs MongoDB vs Redis vs Cassandra - Enterprise Scaling Reality Check

When Your Database Needs to Handle Enterprise Load Without Breaking Your Team's Sanity

PostgreSQL
/compare/postgresql/mysql/mongodb/redis/cassandra/enterprise-scaling-reality-check
85%
integration
Recommended

Setting Up Prometheus Monitoring That Won't Make You Hate Your Job

How to Connect Prometheus, Grafana, and Alertmanager Without Losing Your Sanity

Prometheus
/integration/prometheus-grafana-alertmanager/complete-monitoring-integration
73%
troubleshoot
Recommended

Docker Daemon Won't Start on Linux - Fix This Shit Now

Your containers are useless without a running daemon. Here's how to fix the most common startup failures.

Docker Engine
/troubleshoot/docker-daemon-not-running-linux/daemon-startup-failures
70%
troubleshoot
Recommended

Fix Kubernetes ImagePullBackOff Error - The Complete Battle-Tested Guide

From "Pod stuck in ImagePullBackOff" to "Problem solved in 90 seconds"

Kubernetes
/troubleshoot/kubernetes-imagepullbackoff/comprehensive-troubleshooting-guide
62%
troubleshoot
Recommended

Docker Containers Can't Connect - Fix the Networking Bullshit

Your containers worked fine locally. Now they're deployed and nothing can talk to anything else.

Docker Desktop
/troubleshoot/docker-cve-2025-9074-fix/fixing-network-connectivity-issues
49%
troubleshoot
Recommended

Got Hit by CVE-2025-9074? Here's How to Figure Out What Actually Happened

Docker Container Escape Forensics - What I Learned After Getting Paged at 3 AM

Docker Desktop
/troubleshoot/docker-cve-2025-9074/forensic-investigation-techniques
49%
compare
Recommended

PostgreSQL vs MySQL vs MongoDB vs Cassandra vs DynamoDB - Database Reality Check

Most database comparisons are written by people who've never deployed shit in production at 3am

PostgreSQL
/compare/postgresql/mysql/mongodb/cassandra/dynamodb/serverless-cloud-native-comparison
46%
integration
Recommended

OpenTelemetry + Jaeger + Grafana on Kubernetes - The Stack That Actually Works

Stop flying blind in production microservices

OpenTelemetry
/integration/opentelemetry-jaeger-grafana-kubernetes/complete-observability-stack
43%
tool
Recommended

Helm - Because Managing 47 YAML Files Will Drive You Insane

Package manager for Kubernetes that saves you from copy-pasting deployment configs like a savage. Helm charts beat maintaining separate YAML files for every dam

Helm
/tool/helm/overview
42%
tool
Recommended

Fix Helm When It Inevitably Breaks - Debug Guide

The commands, tools, and nuclear options for when your Helm deployment is fucked and you need to debug template errors at 3am.

Helm
/tool/helm/troubleshooting-guide
42%
integration
Recommended

Making Pulumi, Kubernetes, Helm, and GitOps Actually Work Together

Stop fighting with YAML hell and infrastructure drift - here's how to manage everything through Git without losing your sanity

Pulumi
/integration/pulumi-kubernetes-helm-gitops/complete-workflow-integration
42%
tool
Similar content

containerd - The Container Runtime That Actually Just Works

The boring container runtime that Kubernetes uses instead of Docker (and you probably don't need to care about it)

containerd
/tool/containerd/overview
36%
integration
Similar content

gRPC Service Mesh Integration: Solve Load Balancing & Production Issues

What happens when your gRPC services meet service mesh reality

gRPC
/integration/microservices-grpc/service-mesh-integration
35%
tool
Recommended

Prometheus - Scrapes Metrics From Your Shit So You Know When It Breaks

Free monitoring that actually works (most of the time) and won't die when your network hiccups

Prometheus
/tool/prometheus/overview
35%
integration
Recommended

GitOps Integration Hell: Docker + Kubernetes + ArgoCD + Prometheus

How to Wire Together the Modern DevOps Stack Without Losing Your Sanity

prometheus
/integration/docker-kubernetes-argocd-prometheus/gitops-workflow-integration
35%
tool
Recommended

Grafana - The Monitoring Dashboard That Doesn't Suck

integrates with Grafana

Grafana
/tool/grafana/overview
34%
news
Recommended

Google Hit With $425M Privacy Fine for Tracking Users Who Said No

Jury rules against Google for continuing data collection despite user opt-outs in landmark US privacy case

Microsoft Copilot
/news/2025-09-07/google-425m-privacy-fine
32%
news
Recommended

Google Survives Antitrust Case With Chrome Intact, Has to Share Search Secrets

Microsoft finally gets to see Google's homework after 20 years of getting their ass kicked in search

go
/news/2025-09-03/google-antitrust-survival
32%

Recommendations combine user behavior, content similarity, research intelligence, and SEO optimization