Docker Compose GPU Patterns That Don't Suck

Docker GPU Container Architecture

Most Docker Compose GPU tutorials show toy examples with a single container. Real production setups need multiple containers sharing GPUs, proper resource limits, monitoring, and failover handling. Here's what actually works when you have $50k in AWS bills riding on your GPU containers.

The Production-Ready Docker Compose Template

This isn't a "hello world" - it's a battle-tested setup I've deployed across dozens of production environments. It handles GPU sharing, resource constraints, health checks, and monitoring:

version: '3.8'

services:
  # Primary ML inference service
  inference-api:
    image: nvidia/pytorch:24.08-py3
    deploy:
      resources:
        reservations:
          devices:
            - driver: nvidia
              device_ids: ['0']
              capabilities: [gpu]
    environment:
      - NVIDIA_VISIBLE_DEVICES=0
      - CUDA_VISIBLE_DEVICES=0
      - NVIDIA_DRIVER_CAPABILITIES=compute,utility
    volumes:
      - ./models:/app/models:ro
      - nvidia_ml_repos:/app/workspace
    ports:
      - "8080:8080"
    healthcheck:
      test: ["CMD", "curl", "-f", "http://localhost:8080/health"]
      interval: 30s
      timeout: 10s
      retries: 3
      start_period: 60s
    restart: unless-stopped
    logging:
      driver: "json-file"
      options:
        max-size: "100m"
        max-file: "5"

  # Background processing service sharing GPU
  batch-processor:
    image: nvidia/tensorflow:24.08-tf2-py3
    deploy:
      resources:
        reservations:
          devices:
            - driver: nvidia
              device_ids: ['0']
              capabilities: [gpu]
    environment:
      - NVIDIA_VISIBLE_DEVICES=0
      - CUDA_VISIBLE_DEVICES=0
      - CUDA_MPS_ENABLE_PER_CTX_DEVICE_MULTIPROCESSOR_PARTITIONING=1
    volumes:
      - ./data:/app/data:ro
      - ./output:/app/output
    depends_on:
      inference-api:
        condition: service_healthy
    restart: unless-stopped

  # GPU monitoring and metrics
  gpu-exporter:
    image: mindprince/nvidia_gpu_prometheus_exporter:0.1
    restart: unless-stopped
    ports:
      - "9445:9445"
    deploy:
      resources:
        reservations:
          devices:
            - driver: nvidia
              capabilities: [gpu]

  # Redis for job queuing
  redis:
    image: redis:7-alpine
    ports:
      - "6379:6379"
    volumes:
      - redis_data:/data
    restart: unless-stopped

volumes:
  nvidia_ml_repos:
  redis_data:

GPU Resource Management in Production

The biggest production nightmare is containers fighting over GPU memory. Here's how to prevent your containers from stepping on each other:

Memory Limit Enforcement:

environment:
  - CUDA_MEMORY_POOL_LIMIT=50  # Limit to 50% of GPU memory
  - TF_FORCE_GPU_ALLOW_GROWTH=true  # TensorFlow-specific
  - PYTORCH_CUDA_ALLOC_CONF=max_split_size_mb:512  # PyTorch memory fragmentation fix

For detailed GPU memory management strategies, see NVIDIA's CUDA Best Practices Guide and TensorFlow GPU Memory Growth.

MPS (Multi-Process Service) Setup:
When you need multiple containers sharing a single GPU efficiently, NVIDIA MPS is your friend:

sudo nvidia-smi -i 0 -c EXCLUSIVE_PROCESS
sudo nvidia-cuda-mps-control -d

Then in your compose file:

environment:
  - CUDA_MPS_PIPE_DIRECTORY=/tmp/nvidia-mps
  - CUDA_MPS_LOG_DIRECTORY=/tmp/nvidia-log

Health Checks That Actually Work

Don't just check if your container is running - check if the GPU is accessible and performing:

healthcheck:
  test: |
    python -c "
    import torch
    assert torch.cuda.is_available(), 'CUDA not available'
    assert torch.cuda.device_count() > 0, 'No CUDA devices'
    x = torch.randn(1000, 1000).cuda()
    y = torch.mm(x, x.t())
    assert y.device.type == 'cuda', 'GPU computation failed'
    print('GPU health check passed')
    "
  interval: 60s
  timeout: 30s
  retries: 3

The Production Gotchas Nobody Tells You

Container Init Process Issues:
Your containers might hang during GPU initialization. This usually happens when multiple containers start simultaneously and compete for GPU resources during CUDA context creation.

Solution: Use depends_on with health checks and stagger container startup:

depends_on:
  inference-api:
    condition: service_healthy

Driver Version Mismatches:
Works in dev, breaks in prod because your production hosts have different driver versions. Always pin your base images:

image: nvidia/cuda:12.2-devel-ubuntu22.04  # Pin exact versions

Permission Disasters:
AppArmor, SELinux, or container security policies can block GPU device access. I spent 6 hours debugging this on a fresh Ubuntu 22.04 install - AppArmor was blocking access to /dev/nvidiactl. Check Docker security and AppArmor documentation for proper configuration.

Check:

docker run --rm --gpus all nvidia/cuda:12.2-base-ubuntu22.04 ls -la /dev/nvidia*

Network Issues:
GPU containers often need to communicate with each other for distributed training. Make sure your compose networks are configured properly:

networks:
  gpu-network:
    driver: bridge
    ipam:
      config:
        - subnet: 172.20.0.0/16

Monitoring GPU Utilization

GPU Monitoring Dashboard

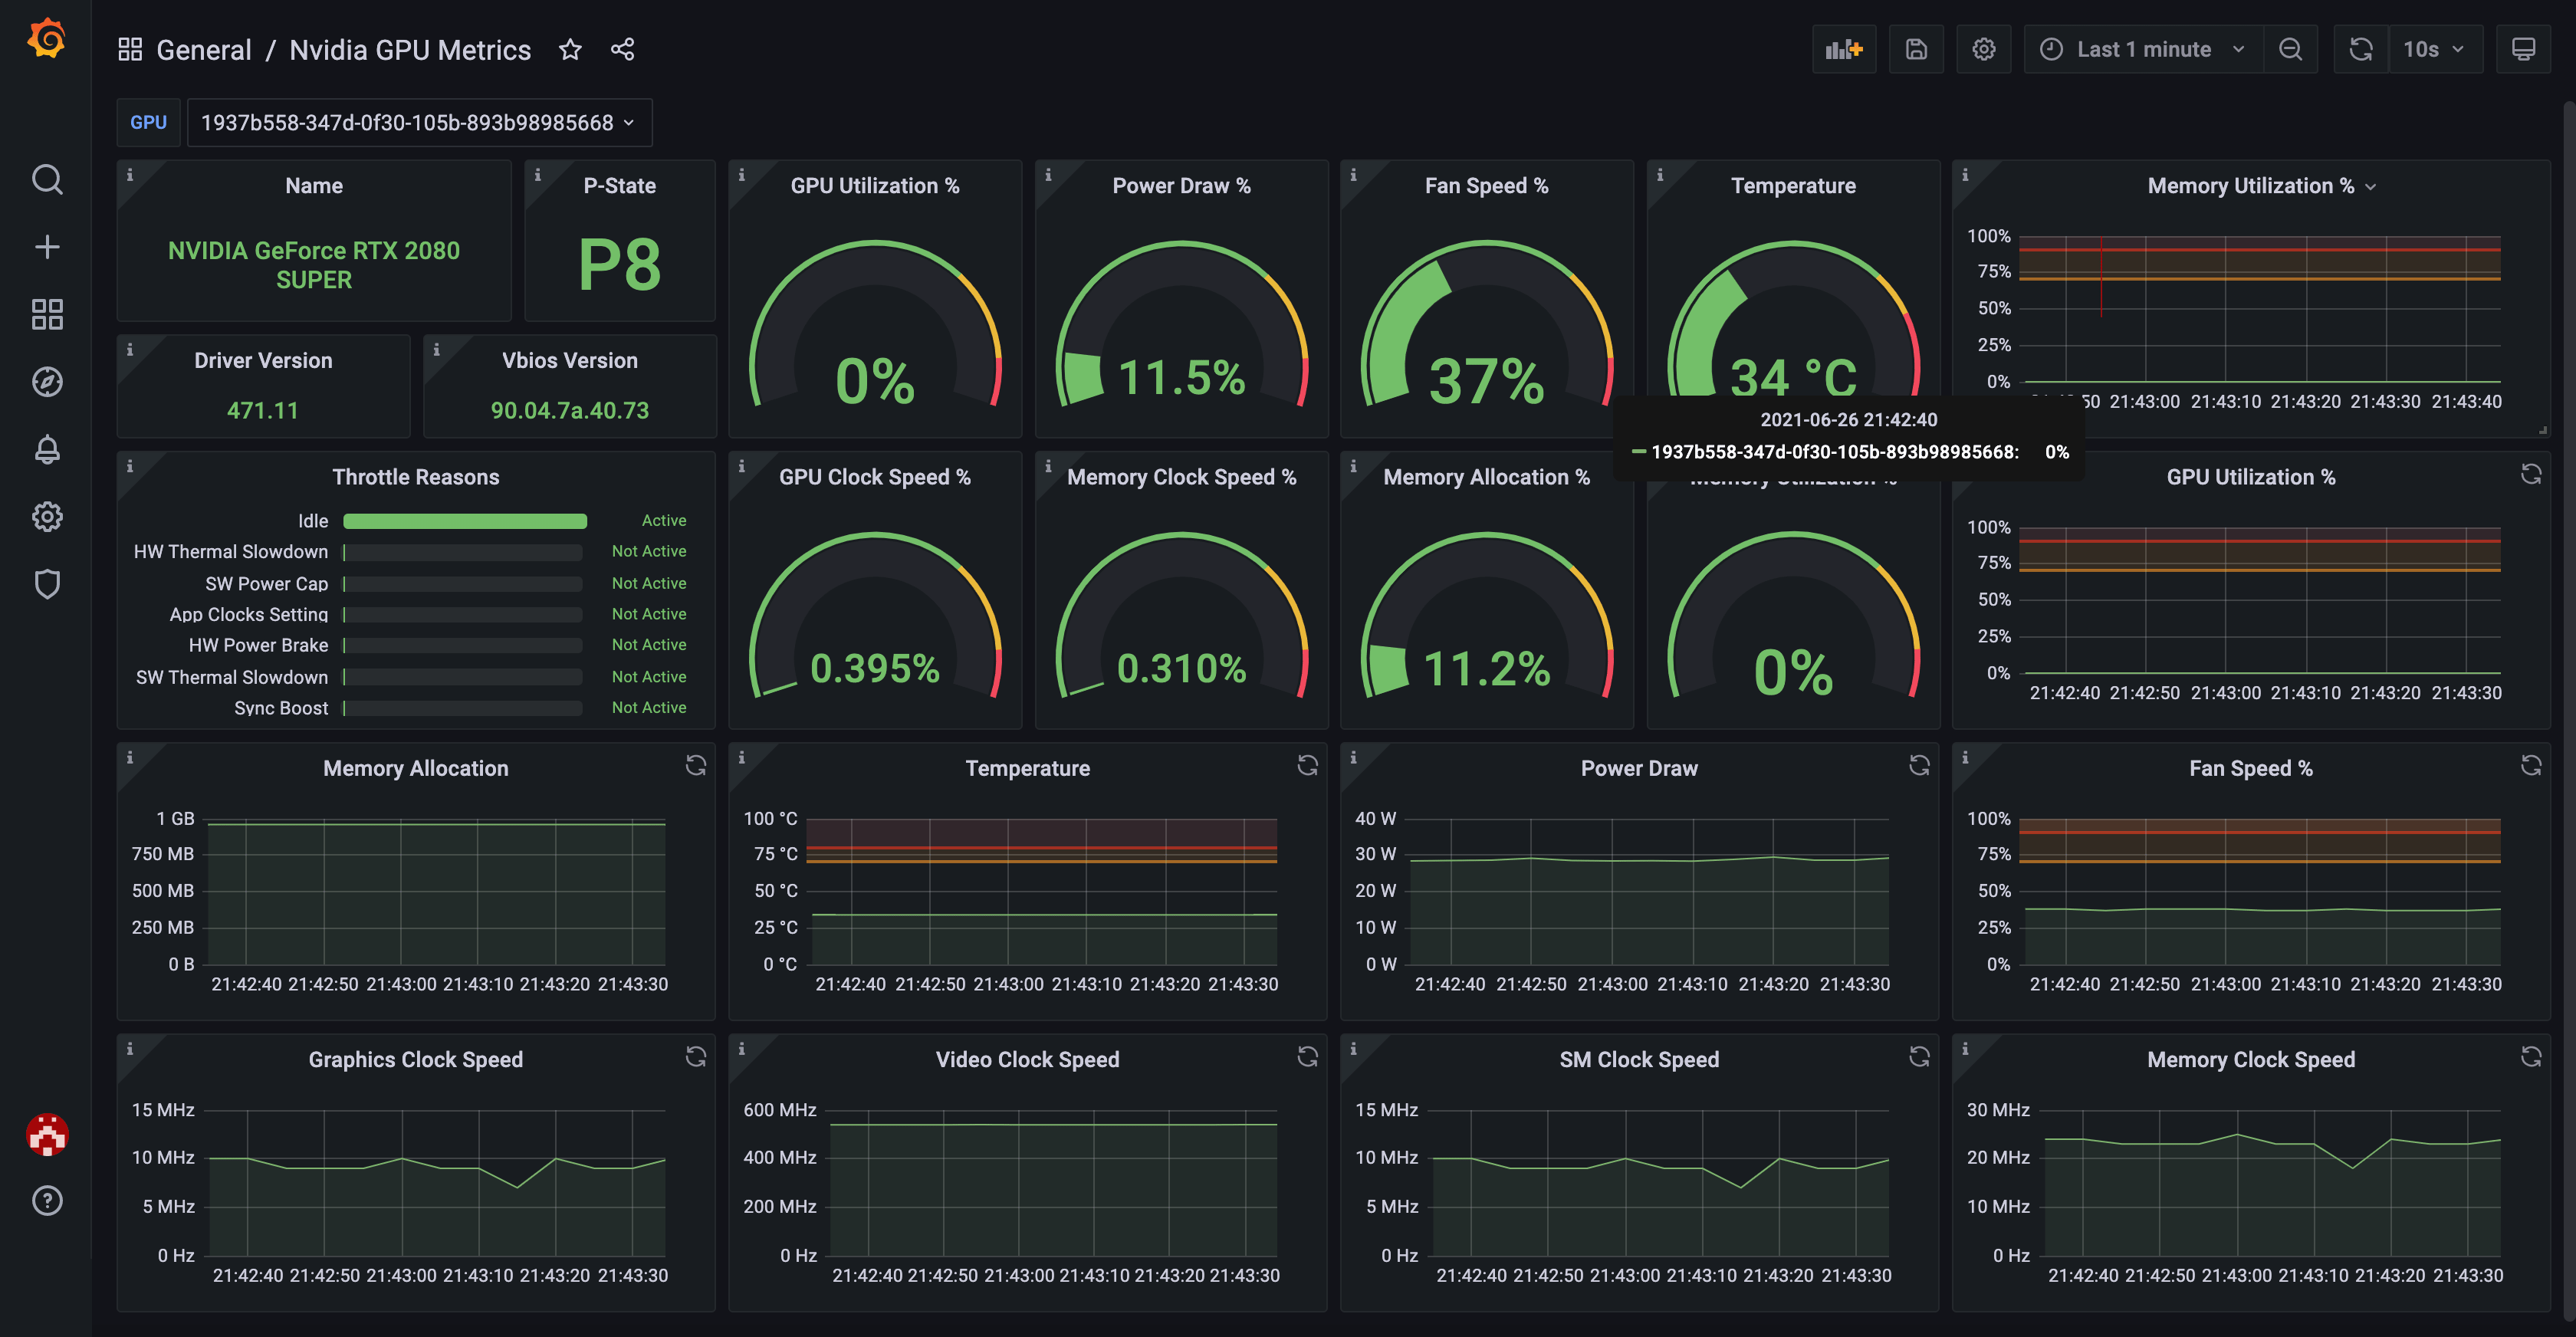
You need visibility into what your GPUs are doing. This Prometheus + Grafana setup gives you the metrics that matter:

  prometheus:
    image: prom/prometheus:latest
    ports:
      - "9090:9090"
    volumes:
      - ./prometheus.yml:/etc/prometheus/prometheus.yml
    restart: unless-stopped

  grafana:
    image: grafana/grafana:latest
    ports:
      - "3000:3000"
    environment:
      - GF_SECURITY_ADMIN_PASSWORD=admin
    volumes:
      - grafana_data:/var/lib/grafana
    restart: unless-stopped

Key metrics to track:

  • GPU utilization percentage
  • GPU memory usage
  • Temperature and power consumption
  • CUDA context switches
  • Container-level GPU usage

Real talk: I once spent 2 hours debugging why our ML pipeline was running slow, only to discover that one rogue container was hogging 90% of GPU memory doing nothing useful.

Load Balancing Multiple GPUs

When you have multiple GPUs, you want to distribute containers across them intelligently:

services:
  worker-gpu0:
    <<: *worker-template
    environment:
      - NVIDIA_VISIBLE_DEVICES=0
      - CUDA_VISIBLE_DEVICES=0
    deploy:
      resources:
        reservations:
          devices:
            - driver: nvidia
              device_ids: ['0']
              capabilities: [gpu]

  worker-gpu1:
    <<: *worker-template  
    environment:
      - NVIDIA_VISIBLE_DEVICES=1
      - CUDA_VISIBLE_DEVICES=1
    deploy:
      resources:
        reservations:
          devices:
            - driver: nvidia
              device_ids: ['1'] 
              capabilities: [gpu]

Using YAML anchors (<<: *worker-template) keeps your compose file DRY and maintainable.

This setup has saved my ass in production more times than I can count. The health checks catch issues before they cascade, the resource limits prevent container wars, and the monitoring gives you visibility when things go sideways at 2am.

For additional Docker Compose best practices, see Docker's official production guide and NVIDIA's Container Toolkit documentation.

Kubernetes GPU Orchestration in the Real World

NVIDIA GPU Operator Architecture

Docker Compose gets you started, but when you need to scale GPU workloads across multiple nodes, Kubernetes is where the real pain begins. The NVIDIA GPU Operator handles most of the complexity, but you'll still spend hours debugging GPU scheduling issues that make you question your life choices.

GPU Operator Setup That Actually Works

Skip the hello-world tutorials. This is production-ready GPU Operator configuration I've used to manage hundreds of GPU nodes:

## gpu-operator-values.yaml
operator:
  defaultRuntime: containerd
  
driver:
  enabled: true
  version: \"535.146.02\"  # Pin driver version - critical for reproducibility
  repository: nvcr.io/nvidia
  
toolkit:
  enabled: true
  version: \"v1.17.8\"  # Latest with CVE-2025-23266 fix
  
devicePlugin:
  enabled: true
  config:
    name: \"gpu-feature-discovery-config\"
    data:
      default: |
        version: v1
        flags:
          migStrategy: \"none\"
          failOnInitError: true
          nvidiaDriverRoot: \"/run/nvidia/driver\"
          gdsEnabled: false
          mofedEnabled: false

dcgmExporter:
  enabled: true
  config:
    name: \"dcgm-metrics-config\"
    data:
      DCGM_FI_DEV_SM_CLOCK: \"1000\"
      DCGM_FI_DEV_MEM_CLOCK: \"1001\"
      DCGM_FI_DEV_GPU_TEMP: \"1004\"

gfd:
  enabled: true

nodeFeatureDiscovery:
  enabled: true

Install it with Helm:

helm repo add nvidia https://catalog.ngc.nvidia.com/helm-charts
helm install gpu-operator nvidia/gpu-operator \
  --namespace gpu-operator \
  --create-namespace \
  --values gpu-operator-values.yaml \
  --wait

Critical Production Settings:

  • Pin driver versions: Never use "latest" in production. Driver updates can break your entire GPU cluster. See NVIDIA driver compatibility.
  • Enable DCGM monitoring: You need GPU metrics or you're flying blind.
  • Set migStrategy: Define how MIG instances are handled upfront.

Pod Resource Requests That Don't Suck

Most GPU pod examples are garbage. Here's how to request GPU resources properly in production:

apiVersion: v1
kind: Pod
metadata:
  name: gpu-workload
spec:
  restartPolicy: Never
  containers:
  - name: gpu-container
    image: nvidia/pytorch:24.08-py3
    resources:
      limits:
        nvidia.com/gpu: 1  # Request 1 GPU
        memory: \"16Gi\"      # GPU workloads are memory-hungry
        cpu: \"4\"           # Don't starve CPU
      requests:
        nvidia.com/gpu: 1
        memory: \"8Gi\"      # Minimum memory needed
        cpu: \"2\"
    env:
    - name: NVIDIA_VISIBLE_DEVICES
      value: \"all\"
    - name: NVIDIA_DRIVER_CAPABILITIES
      value: \"compute,utility\"
    - name: CUDA_CACHE_PATH
      value: \"/tmp/cuda-cache\"  # Avoid permission issues
    volumeMounts:
    - name: cuda-cache
      mountPath: /tmp/cuda-cache
    - name: shm
      mountPath: /dev/shm  # Shared memory for multi-process training
  volumes:
  - name: cuda-cache
    emptyDir: {}
  - name: shm
    emptyDir:
      medium: Memory
      sizeLimit: \"2Gi\"
  nodeSelector:
    accelerator: nvidia-tesla-v100  # Pin to specific GPU types
  tolerations:
  - key: nvidia.com/gpu
    operator: Exists
    effect: NoSchedule

Multi-GPU Pod Scheduling

When you need multiple GPUs for distributed training, the scheduler can be a bastard. Here's how to get it right:

apiVersion: batch/v1
kind: Job
metadata:
  name: multi-gpu-training
spec:
  template:
    spec:
      containers:
      - name: trainer
        image: nvidia/pytorch:24.08-py3
        resources:
          limits:
            nvidia.com/gpu: 4  # Request 4 GPUs on same node
        env:
        - name: NVIDIA_VISIBLE_DEVICES
          value: \"0,1,2,3\"
        - name: NCCL_DEBUG
          value: \"INFO\"  # Debug distributed communication
        command: [\"python\", \"-m\", \"torch.distributed.launch\"]
        args: 
        - \"--nproc_per_node=4\"
        - \"--master_port=29500\"
        - \"train.py\"
      restartPolicy: Never
      # CRITICAL: This ensures all GPUs are on the same node
      affinity:
        nodeAffinity:
          requiredDuringSchedulingIgnoredDuringExecution:
            nodeSelectorTerms:
            - matchExpressions:
              - key: accelerator
                operator: In
                values: [\"nvidia-tesla-v100\", \"nvidia-tesla-a100\"]

The GPU Scheduling Hell Everyone Hits:

  1. GPU fragmentation: You have 8 nodes with 1 GPU each, but need 4 GPUs on one node. Kubernetes says "fuck you" and your pod stays pending forever.

  2. Node selector conflicts: Your pods get scheduled to CPU-only nodes because you forgot node selectors.

  3. Resource quota fights: Different teams fighting over the same GPU pool.

Solutions that actually work:

GPU Node Pool Management

Managing GPU nodes is expensive and complex. Here's how to do it without going bankrupt:

## Node pool for training workloads (expensive, scale to zero)
apiVersion: v1
kind: Node
metadata:
  labels:
    workload-type: \"training\"
    gpu-type: \"nvidia-tesla-a100\"
    cost-category: \"expensive\"
spec:
  taints:
  - key: \"workload-type\"
    value: \"training\"
    effect: \"NoSchedule\"
  
## Node pool for inference workloads (cheaper, always running)  
apiVersion: v1
kind: Node
metadata:
  labels:
    workload-type: \"inference\"
    gpu-type: \"nvidia-tesla-t4\"
    cost-category: \"moderate\"
spec:
  taints:
  - key: \"workload-type\"
    value: \"inference\"
    effect: \"NoSchedule\"

Cost Optimization Patterns:

  • Spot instances for training: Training jobs can handle interruptions
  • On-demand for inference: Inference needs reliability
  • Node auto-scaling: Scale expensive GPU nodes to zero when not needed

Debugging GPU Pods When Everything's Fucked

When your GPU pods won't start, here's the debugging checklist that actually works:

## Check GPU Operator status
kubectl get pods -n gpu-operator

## Verify GPU nodes are labeled correctly
kubectl get nodes -o wide -l accelerator

## Check GPU resource availability
kubectl describe node <gpu-node-name>

## Debug pending pods
kubectl describe pod <pod-name>

## Check GPU device allocation
kubectl get events --sort-by='.lastTimestamp'

Common failures and fixes:

"UnexpectedAdmissionError": GPU device plugin isn't running

kubectl logs -n gpu-operator nvidia-device-plugin-daemonset-xyz

Pod stuck in "Pending": Resource conflicts or node selector issues

## Check resource requests vs availability
kubectl describe nodes | grep -A 5 \"nvidia.com/gpu\"

CUDA initialization failures: Driver/runtime version mismatches

## Check driver versions across nodes
kubectl get nodes -o custom-columns=NAME:.metadata.name,DRIVER:.status.nodeInfo.kernelVersion

Production Monitoring Stack

You need observability into your GPU cluster. This Prometheus setup tracks what matters:

## ServiceMonitor for GPU Operator DCGM metrics
apiVersion: monitoring.coreos.com/v1
kind: ServiceMonitor
metadata:
  name: gpu-metrics
spec:
  selector:
    matchLabels:
      app: nvidia-dcgm-exporter
  endpoints:
  - port: gpu-metrics
    interval: 30s
    path: /metrics

## Grafana dashboard config
apiVersion: v1
kind: ConfigMap
metadata:
  name: gpu-dashboard
data:
  dashboard.json: |
    {
      \"dashboard\": {
        \"title\": \"GPU Cluster Overview\",
        \"panels\": [
          {
            \"title\": \"GPU Utilization by Node\",
            \"type\": \"graph\",
            \"targets\": [
              {
                \"expr\": \"DCGM_FI_DEV_GPU_UTIL{instance=~\\\".*\\\"}\"
              }
            ]
          },
          {
            \"title\": \"GPU Memory Usage\",
            \"type\": \"graph\", 
            \"targets\": [
              {
                \"expr\": \"DCGM_FI_DEV_MEM_USED{instance=~\\\".*\\\"} / DCGM_FI_DEV_MEM_TOTAL{instance=~\\\".*\\\"} * 100\"
              }
            ]
          },
          {
            \"title\": \"GPU Temperature\",
            \"type\": \"graph\",
            \"targets\": [
              {
                \"expr\": \"DCGM_FI_DEV_GPU_TEMP{instance=~\\\".*\\\"}\"
              }
            ]
          }
        ]
      }
    }

Key metrics to alert on:

  • GPU utilization < 10% (wasted money)
  • GPU temperature > 85°C (thermal throttling)
  • Pod scheduling failures (resource contention)
  • CUDA out of memory errors

Multi-Tenant GPU Sharing

When different teams need to share GPU resources, you need isolation and quotas:

## Namespace resource quota
apiVersion: v1
kind: ResourceQuota
metadata:
  name: gpu-quota
  namespace: ml-team
spec:
  hard:
    requests.nvidia.com/gpu: \"10\"
    limits.nvidia.com/gpu: \"10\"
    requests.memory: \"100Gi\"

## Network policy for isolation
apiVersion: networking.k8s.io/v1
kind: NetworkPolicy
metadata:
  name: gpu-isolation
  namespace: ml-team
spec:
  podSelector: {}
  policyTypes:
  - Ingress
  - Egress
  ingress:
  - from:
    - namespaceSelector:
        matchLabels:
          name: ml-team

Real production lesson: one team's runaway training job can consume all available GPU memory and starve other workloads. Resource quotas and limits aren't optional - they're mandatory for multi-tenant environments.

The GPU Operator makes Kubernetes GPU management bearable, but you'll still spend time debugging scheduling quirks, resource conflicts, and the occasional driver crash that takes down half your cluster. Plan for it.

Production Deployment FAQ

Q

How do I share GPUs between multiple containers without them fighting over memory?

A

This is the #1 production nightmare. Multiple containers trying to allocate GPU memory simultaneously leads to CUDA out of memory errors and container crashes. Here's what actually works:

Use MPS (Multi-Process Service):

## Enable MPS on the host
sudo nvidia-smi -i 0 -c EXCLUSIVE_PROCESS  
sudo nvidia-cuda-mps-control -d

Set memory limits in your compose:

environment:
  - CUDA_MEMORY_POOL_LIMIT=25  # Limit each container to 25% GPU memory
  - TF_FORCE_GPU_ALLOW_GROWTH=true

Pro tip: I learned this after a 3am outage where competing containers kept killing each other fighting for VRAM.

Q

Why do my GPU containers work in dev but fail in production?

A

Usually one of three things: driver version mismatch, different kernel modules, or security policies blocking device access.

Debug checklist:

  1. Driver versions: nvidia-smi output should match between dev and prod
  2. Kernel modules: lsmod | grep nvidia should show loaded modules
  3. Device permissions: ls -la /dev/nvidia* should show accessible devices
  4. Container runtime: docker info | grep nvidia should show nvidia runtime configured

Common culprit: AppArmor or SELinux blocking /dev/nvidiactl access. Check dmesg for permission denials.

Q

How do I handle GPU container failures and automatic recovery?

A

GPU processes can crash, hang, or corrupt GPU memory requiring full container restarts. Standard restart policies aren't enough.

Docker Compose health checks:

healthcheck:
  test: |
    python -c \" 
    import torch; 
    assert torch.cuda.is_available();
    x = torch.randn(100, 100).cuda();
    torch.mm(x, x.t())
    \"
  interval: 60s
  timeout: 30s
  retries: 3
  start_period: 120s
restart: unless-stopped

Kubernetes liveness probes:

livenessProbe:
  exec:
    command: [\"nvidia-smi\", \"--query-gpu=utilization.gpu\", \"--format=csv,noheader\"]
  initialDelaySeconds: 60
  periodSeconds: 30
  timeoutSeconds: 10
  failureThreshold: 3

Nuclear option: Reset GPU state on container restart:

nvidia-smi --gpu-reset -i 0
Q

What's the best way to monitor GPU utilization across multiple containers?

A

You need metrics at both the GPU hardware level and container level. This Prometheus setup gives you both:

Hardware metrics (DCGM Exporter):

dcgm-exporter:
  image: nvcr.io/nvidia/k8s/dcgm-exporter:3.3.8-3.6.0-ubuntu22.04
  deploy:
    resources:
      reservations:
        devices:
          - driver: nvidia
            capabilities: [gpu]

Container-level metrics:

cadvisor:
  image: gcr.io/cadvisor/cadvisor:latest
  volumes:
    - /dev/kmsg:/dev/kmsg:ro
    - /var/lib/docker/:/var/lib/docker:ro
    - /var/run:/var/run:ro
    - /sys:/sys:ro

Key alerts to set up:

  • GPU memory > 90% (prevent OOM crashes)
  • GPU utilization < 10% for > 30 minutes (wasted money)
  • Container restart rate > 3 per hour (stability issues)
Q

How do I debug CUDA "out of memory" errors in production?

A

CUDA OOM errors are the bane of GPU containerization. They're often not actually about insufficient memory, but memory fragmentation or leaks.

Immediate debugging:

## Check actual GPU memory usage
nvidia-smi --query-gpu=memory.used,memory.total --format=csv

## Check memory fragmentation  
python -c \"import torch; print(torch.cuda.memory_summary())\"

Prevention strategies:

environment:
  - PYTORCH_CUDA_ALLOC_CONF=max_split_size_mb:512  # Reduce fragmentation
  - CUDA_LAUNCH_BLOCKING=1  # Synchronous execution for debugging
  - CUDA_MEMORY_POOL_LIMIT=80  # Reserve 20% memory headroom

In your application code:

## Clear cache between operations
torch.cuda.empty_cache()

## Use context managers for memory management
with torch.cuda.device(0):
    # GPU operations here
    pass

Real lesson learned: spent 4 hours debugging OOM errors only to find a memory leak in a PyTorch data loader. Always check your data loading pipeline.

Q

How do I handle GPU driver updates in production without downtime?

A

GPU driver updates require kernel module reloads, which means container restarts. Here's how to minimize impact:

Rolling update strategy:

  1. Drain node: Move workloads to other GPU nodes
  2. Update driver: Install new NVIDIA driver
  3. Update toolkit: Match Container Toolkit version
  4. Restart containerd/Docker: Reload GPU runtime
  5. Validate: Test GPU access with sample container
  6. Return to service: Allow workloads to schedule back

Kubernetes automated approach:

## Use GPU Operator with staged rollouts
spec:
  driver:
    version: \"535.146.02\"  # Pin specific version
    upgradePolicy:
      autoUpgrade: false   # Manual control
      maxUnavailable: 1    # One node at a time

Test before production:

## Validate new driver version
docker run --rm --gpus all nvidia/cuda:12.2-base-ubuntu22.04 nvidia-smi
Q

What are the security implications of GPU containers in production?

A

GPU containers require privileged access to hardware, which creates security risks. The CVE-2025-23266 container escape vulnerability proved this isn't theoretical.

Security hardening checklist:

1. Update immediately: Toolkit version 1.17.8+ has the container escape fix

nvidia-ctk --version  # Must be 1.17.8 or higher

2. Limit container capabilities:

security_context:
  capabilities:
    drop:
      - ALL
    add:
      - SYS_ADMIN  # Only what's needed for GPU access
  seccomp_profile:
    type: RuntimeDefault

3. Use user namespaces:

user: \"1000:1000\"  # Run as non-root inside container

4. Network isolation:

network_mode: none  # If GPU workload doesn't need network

5. Read-only root filesystem:

read_only: true
tmpfs:
  - /tmp
  - /var/tmp

Enterprise considerations:

  • GPU containers need device access = higher attack surface
  • Container escape = full host compromise
  • Multi-tenant environments need strict resource isolation
  • Audit container images for malicious GPU code
Q

How do I scale GPU workloads cost-effectively?

A

GPU compute is expensive. Here's how to avoid $10k surprise bills:

Auto-scaling patterns:

## Scale inference deployment based on queue depth
apiVersion: autoscaling/v2
kind: HorizontalPodAutoscaler
metadata:
  name: gpu-inference-hpa
spec:
  scaleTargetRef:
    apiVersion: apps/v1
    kind: Deployment
    name: gpu-inference
  minReplicas: 1
  maxReplicas: 10
  metrics:
  - type: External
    external:
      metric:
        name: queue_depth
      target:
        type: AverageValue
        averageValue: \"5\"

Spot instance strategies:

  • Use spot instances for training workloads (can handle interruptions)
  • Keep inference on on-demand instances (needs reliability)
  • Implement checkpointing for long-running training jobs

Resource optimization:

  • GPU sharing: Use MPS or MIG for smaller workloads
  • Batch processing: Group small inference requests
  • Model optimization: Quantization and pruning reduce memory needs
  • Scheduled scaling: Scale down during off-hours

Cost monitoring:

## Track GPU utilization vs cost
kubectl top nodes --selector=accelerator=nvidia-tesla-v100

Real example: moved batch training jobs to spot instances and saved 70% on compute costs. The key is designing for interruption from day one.

Q

Why do my containers hang during GPU initialization?

A

GPU initialization hangs are usually caused by multiple containers competing for CUDA context creation or driver resource locks.

Common causes:

  1. Multiple containers starting simultaneously - stagger startup times
  2. Driver initialization locks - NVIDIA driver isn't fully loaded
  3. CUDA context conflicts - multiple processes fighting for GPU exclusive access
  4. Insufficient shared memory - mount /dev/shm properly

Solutions:

## Stagger container startup
depends_on:
  gpu-service-1:
    condition: service_healthy

## Increase shared memory
shm_size: '2gb'

## Set CUDA initialization timeout
environment:
  - CUDA_LAUNCH_BLOCKING=1
  - CUDA_DEVICE_ORDER=PCI_BUS_ID

Debug hanging initialization:

## Check what processes are using GPU
sudo fuser -v /dev/nvidia*

## Monitor CUDA context creation
sudo nvidia-smi -l 1

I've debugged this exact issue probably 20 times. Usually it's containers stepping on each other during startup. Use health checks and staged dependencies.

Performance Optimization and Production Best Practices

Performance Optimization and Production Best Practices

Container Performance Architecture

Running GPU workloads in containers adds overhead.

In production, that overhead costs money

Container Image Optimization for GPU Workloads

Most GPU container images are bloated disasters.

A typical PyTorch image with CUDA is 8GB+ because everyone just ships everything.

Here's how to build lean, fast GPU images using multi-stage builds:

# Multi-stage build for production GPU images
FROM nvidia/cuda:
12.2-devel-ubuntu22.04 AS builder

# Install only build dependencies
RUN apt-get update && apt-get install -y --no-install-recommends \
    python3-dev python3-pip build-essential \
    && rm -rf /var/lib/apt/lists/*

# Install Python packages with specific CUDA version
RUN pip install --no-cache-dir torch==2.1.0+cu121 -f https://download.pytorch.org/whl/torch_stable.html

# Production image 
- minimal runtime
FROM nvidia/cuda:
12.2-runtime-ubuntu22.04

# Copy only runtime dependencies
COPY --from=builder /usr/local/lib/python3.10/site-packages /usr/local/lib/python3.10/site-packages
COPY --from=builder /usr/local/bin /usr/local/bin

# Install only runtime dependencies
RUN apt-get update && apt-get install -y --no-install-recommends \
    python3 python3-pip \
    && rm -rf /var/lib/apt/lists/* \
    && apt-get clean

# Non-root user for security
RUN useradd --create-home --shell /bin/bash gpu-user
USER gpu-user

WORKDIR /app

Image optimization wins:

  • Size reduction: 8GB → 2.5GB (faster pulls, lower storage costs)

  • Security: Remove build tools from production images

  • Startup time: Smaller images start faster

  • Layer caching: Separate dependencies from application code

CUDA Memory Management in Containers

CUDA memory management in containers is different from bare metal.

The container layer adds complexity and potential performance hits. Here's how to optimize using PyTorch memory management:

Memory Pool Configuration:

# Set memory pool limits to prevent fragmentation
import os
os.environ['PYTORCH_CUDA_ALLOC_CONF'] = 'max_split_size_mb:512,roundup_power2_divisions:16'

# Pre-allocate memory pools to avoid runtime allocation overhead
import torch
torch.cuda.empty_cache()
torch.cuda.memory.set_per_process_memory_fraction(0.8)  # Reserve 20% headroom

Container-specific optimizations:

environment:
  
- CUDA_MEMORY_POOL_LIMIT=80          # Limit memory pool size
  
- CUDA_CACHE_PATH=/tmp/cuda-cache    # Persistent CUDA kernel cache
  
- CUDA_CACHE_DISABLE=0               # Enable caching
  
- CUDA_CACHE_MAXSIZE=2147483648      # 2GB cache size
volumes:
  
- cuda_cache:/tmp/cuda-cache

Memory fragmentation prevention:

# Implement proper memory lifecycle management
class GPUMemoryManager:
    def __init__(self, max_memory_fraction=0.8):
        torch.cuda.set_per_process_memory_fraction(max_memory_fraction)
        self.memory_pool = torch.cuda.memory.

MemoryPool()
        
    def cleanup(self):
        torch.cuda.empty_cache()
        torch.cuda.synchronize()
        
    def __enter__(self):
        return self
        
    def __exit__(self, exc_type, exc_val, exc_tb):
        self.cleanup()

# Usage in your application
with GPUMemoryManager() as gpu_mem:
    # Your GPU operations here
    model_output = model(input_tensor)

Multi-GPU Container Strategies

Single GPU containers are easy.

Multi-GPU containers in production are where shit gets complicated. Here are patterns that actually work using distributed training and NCCL communication:

Data Parallel Training:

# Docker Compose for multi-GPU training
version: '3.8'
services:
  distributed-trainer:
    image: my-training-image:latest
    deploy:
      resources:
        reservations:
          devices:
            
- driver: nvidia
              device_ids: ['0', '1', '2', '3']  # All GPUs on one node
              capabilities: [gpu]
    environment:
      
- MASTER_ADDR=localhost
      
- MASTER_PORT=29500
      
- WORLD_SIZE=4
      
- NCCL_DEBUG=INFO
      
- NCCL_SOCKET_IFNAME=eth0
    command: >
      python -m torch.distributed.launch \
      --nproc_per_node=4 \
      --master_port=29500
      train.py
    volumes:
      
- ./checkpoints:/app/checkpoints
      
- /dev/shm:/dev/shm  # Critical for multi-GPU communication
    shm_size: '8gb'        # Increase shared memory

Pipeline Parallel Inference:

# Chain containers for pipeline parallelism
services:
  preprocessing:
    image: preprocess:latest
    deploy:
      resources:
        reservations:
          devices:
            
- driver: nvidia
              device_ids: ['0']
              capabilities: [gpu]

  model-inference:
    image: inference:latest
    deploy:
      resources:
        reservations:
          devices:
            
- driver: nvidia
              device_ids: ['1']
              capabilities: [gpu]
    depends_on:
      
- preprocessing

  postprocessing:
    image: postprocess:latest
    deploy:
      resources:
        reservations:
          devices:
            
- driver: nvidia
              device_ids: ['2']
              capabilities: [gpu]
    depends_on:
      
- model-inference

Network Optimization for GPU Containers

GPU workloads generate massive amounts of data.

Network becomes the bottleneck faster than you think. Here's how to optimize using Docker networking and Kubernetes networking:

Container Network Configuration:

# High-performance networking for GPU containers
version: '3.8'
services:
  gpu-workload:
    image: gpu-app:latest
    networks:
      
- gpu-network
    deploy:
      resources:
        reservations:
          devices:
            
- driver: nvidia
              capabilities: [gpu]

networks:
  gpu-network:
    driver: bridge
    driver_opts:
      com.docker.network.bridge.name: br-gpu
      com.docker.network.driver.mtu: 9000  # Jumbo frames for high throughput
    ipam:
      config:
        
- subnet: 172.20.0.0/16
          gateway: 172.20.0.1

Kubernetes network optimizations:

apiVersion: v1
kind:

 Pod
spec:
  containers:
  
- name: gpu-container
    resources:
      requests:
        nvidia.com/gpu: 1
        hugepages-2Mi: 1Gi  # Use huge pages for performance
      limits:
        nvidia.com/gpu: 1
        hugepages-2Mi: 1Gi
  volumes:
  
- name: hugepage-2mi
    emptyDir:
      medium:

 HugePages-2Mi

Container Runtime Performance Tuning

The container runtime layer adds latency to GPU operations.

Here's how to minimize overhead with Docker daemon optimization:

Docker daemon optimization:

{
  \"experimental\": true,
  \"features\": {
    \"buildkit\": true
  },
  \"runtimes\": {
    \"nvidia\": {
      \"path\": \"nvidia-container-runtime\",
      \"runtimeArgs\": []
    }
  },
  \"default-runtime\": \"nvidia\",
  \"storage-driver\": \"overlay2\",
  \"storage-opts\": [
    \"overlay2.override_kernel_check=true\"
  ],
  \"exec-opts\": [\"native.cgroupdriver=systemd\"],
  \"live-restore\": true,
  \"group\": \"docker\",
  \"hosts\": [\"fd://\", \"tcp://0.0.0.0:2376\"],
  \"log-driver\": \"json-file\",
  \"log-opts\": {
    \"max-size\": \"100m\",
    \"max-file\": \"3\"
  }
}

Container resource limits tuning:

# Optimized resource allocation
version: '3.8'
services:
  gpu-app:
    image: my-gpu-app:latest
    deploy:
      resources:
        reservations:
          devices:
            
- driver: nvidia
              capabilities: [gpu]
          memory: '16G'
          cpus: '8.0'
        limits:
          memory: '32G'  # Allow burst above reservation
          cpus: '16.0'
    # Optimize container for performance
    privileged: false
    cap_add:
      
- SYS_NICE      # Allow process priority adjustment
      
- IPC_LOCK      # Allow memory locking
    ulimits:
      memlock:
        soft:

-1
        hard:

-1
      nofile:
        soft: 1048576
        hard: 1048576

Production Monitoring and Alerting

You can't optimize what you don't measure.

This monitoring setup gives you the visibility you need using Prometheus and DCGM metrics:

Container-level GPU metrics:

# Custom metrics exporter for detailed GPU stats
gpu-stats-exporter:
  image: nvidia/dcgm-exporter:
3.3.8-3.6.0-ubuntu22.04
  deploy:
    resources:
      reservations:
        devices:
          
- driver: nvidia
            capabilities: [gpu]
  environment:
    
- DCGM_EXPORTER_LISTEN=0.0.0.0:9400
    
- DCGM_EXPORTER_KUBERNETES=true
    
- DCGM_EXPORTER_COLLECTORS=/etc/dcgm-exporter/dcp-metrics-included.csv
  volumes:
    
- ./dcgm-metrics-config.csv:/etc/dcgm-exporter/dcp-metrics-included.csv:ro

Performance alerting rules:

groups:

- name: gpu-performance
  rules:
  
- alert:

 GPULowUtilization
    expr: DCGM_FI_DEV_GPU_UTIL < 10
    for: 30m
    annotations:
      summary: \"GPU {{ $labels.gpu }} has low utilization\"
      description: \"GPU utilization below 10% for 30 minutes 
- wasted money\"

  
- alert:

 GPUHighMemoryUsage
    expr: DCGM_FI_DEV_MEM_USED / DCGM_FI_DEV_MEM_TOTAL * 100 > 90
    for: 5m
    annotations:
      summary: \"GPU {{ $labels.gpu }} memory usage critical\"
      description: \"GPU memory usage above 90% 
- risk of OOM crashes\"

  
- alert:

 ContainerGPUThrottling
    expr: increase(container_cpu_throttled_seconds_total{container=~\".*gpu.*\"}[5m]) > 0
    annotations:
      summary: \"GPU container {{ $labels.container }} is CPU throttled\"
      description: \"CPU throttling affecting GPU container performance\"

Real Production Performance Lessons

**Lesson #1:

Container overhead is real**
Measured 5-15% performance penalty running GPU workloads in containers vs bare metal. The overhead comes from:

  • Container filesystem layers

  • Network namespace overhead \

  • Memory management differences

  • CUDA context switching delays

Mitigation: Use optimized base images, tune container resources, minimize filesystem operations.

**Lesson #2:

Memory fragmentation kills performance**
GPU memory fragmentation in containers is worse than bare metal because the container layer affects CUDA's memory allocator behavior.

Solution: Pre-allocate memory pools, implement proper cleanup, use memory-mapped files for large datasets.

**Lesson #3:

Multi-container GPU sharing is hard**
Multiple containers sharing GPUs leads to context switching overhead and memory conflicts. MPS helps but adds complexity.

Best practice: Design applications for single-container-per-GPU when possible, use MPS only when resource utilization demands it.

**Lesson #4:

Network becomes the bottleneck**
GPU containers often move massive datasets. Standard Docker networking can't handle the throughput.

Solution: Use host networking for high-throughput applications, configure jumbo frames, consider SR-IOV for extreme performance.

Performance optimization is about understanding the full stack: application code, CUDA runtime, container layer, host kernel, and hardware. Each layer adds overhead, and production environments amplify every inefficiency. Measure first, optimize systematically, and always validate improvements with real workloads.

Production Resources and Tools

Related Tools & Recommendations

troubleshoot
Similar content

Debug Kubernetes AI GPU Failures: Pods Stuck Pending & OOM

Debugging workflows for when Kubernetes decides your AI workload doesn't deserve those GPUs. Based on 3am production incidents where everything was on fire.

Kubernetes
/troubleshoot/kubernetes-ai-workload-deployment-issues/ai-workload-gpu-resource-failures
100%
tool
Similar content

TypeScript Compiler Performance: Fix Slow Builds & Optimize Speed

Practical performance fixes that actually work in production, not marketing bullshit

TypeScript Compiler
/tool/typescript/performance-optimization-guide
97%
tool
Similar content

Rancher Desktop: The Free Docker Desktop Alternative That Works

Discover why Rancher Desktop is a powerful, free alternative to Docker Desktop. Learn its features, installation process, and solutions for common issues on mac

Rancher Desktop
/tool/rancher-desktop/overview
92%
tool
Similar content

Debug Kubernetes Issues: The 3AM Production Survival Guide

When your pods are crashing, services aren't accessible, and your pager won't stop buzzing - here's how to actually fix it

Kubernetes
/tool/kubernetes/debugging-kubernetes-issues
89%
howto
Similar content

Weaviate Production Deployment & Scaling: Avoid Common Pitfalls

So you've got Weaviate running in dev and now management wants it in production

Weaviate
/howto/weaviate-production-deployment-scaling/production-deployment-scaling
89%
tool
Similar content

Docker: Package Code, Run Anywhere - Fix 'Works on My Machine'

No more "works on my machine" excuses. Docker packages your app with everything it needs so it runs the same on your laptop, staging, and prod.

Docker Engine
/tool/docker/overview
83%
tool
Similar content

Google Cloud Vertex AI Production Deployment Troubleshooting Guide

Debug endpoint failures, scaling disasters, and the 503 errors that'll ruin your weekend. Everything Google's docs won't tell you about production deployments.

Google Cloud Vertex AI
/tool/vertex-ai/production-deployment-troubleshooting
75%
tool
Similar content

Binance Pro Mode: Unlock Advanced Trading & Features for Pros

Stop getting treated like a child - Pro Mode is where Binance actually shows you all their features, including the leverage that can make you rich or bankrupt y

Binance Pro
/tool/binance-pro/overview
67%
tool
Similar content

Jsonnet Overview: Stop Copy-Pasting YAML Like an Animal

Because managing 50 microservice configs by hand will make you lose your mind

Jsonnet
/tool/jsonnet/overview
64%
tool
Similar content

Change Data Capture (CDC) Integration Patterns for Production

Set up CDC at three companies. Got paged at 2am during Black Friday when our setup died. Here's what keeps working.

Change Data Capture (CDC)
/tool/change-data-capture/integration-deployment-patterns
64%
tool
Similar content

KubeCost: Optimize Kubernetes Costs & Stop Surprise Cloud Bills

Stop getting surprise $50k AWS bills. See exactly which pods are eating your budget.

KubeCost
/tool/kubecost/overview
64%
tool
Similar content

Playwright Overview: Fast, Reliable End-to-End Web Testing

Cross-browser testing with one API that actually works

Playwright
/tool/playwright/overview
61%
tool
Similar content

CDC Enterprise Implementation Guide: Real-World Challenges & Solutions

I've implemented CDC at 3 companies. Here's what actually works vs what the vendors promise.

Change Data Capture (CDC)
/tool/change-data-capture/enterprise-implementation-guide
61%
tool
Similar content

AWS CDK Production Horror Stories: CloudFormation Deployment Nightmares

Real War Stories from Engineers Who've Been There

AWS Cloud Development Kit
/tool/aws-cdk/production-horror-stories
61%
tool
Similar content

ArgoCD - GitOps for Kubernetes That Actually Works

Continuous deployment tool that watches your Git repos and syncs changes to Kubernetes clusters, complete with a web UI you'll actually want to use

Argo CD
/tool/argocd/overview
61%
troubleshoot
Recommended

Docker Desktop Won't Install? Welcome to Hell

When the "simple" installer turns your weekend into a debugging nightmare

Docker Desktop
/troubleshoot/docker-cve-2025-9074/installation-startup-failures
61%
howto
Recommended

Complete Guide to Setting Up Microservices with Docker and Kubernetes (2025)

Split Your Monolith Into Services That Will Break in New and Exciting Ways

Docker
/howto/setup-microservices-docker-kubernetes/complete-setup-guide
61%
troubleshoot
Recommended

Fix Docker Daemon Connection Failures

When Docker decides to fuck you over at 2 AM

Docker Engine
/troubleshoot/docker-error-during-connect-daemon-not-running/daemon-connection-failures
61%
integration
Recommended

OpenTelemetry + Jaeger + Grafana on Kubernetes - The Stack That Actually Works

Stop flying blind in production microservices

OpenTelemetry
/integration/opentelemetry-jaeger-grafana-kubernetes/complete-observability-stack
61%
troubleshoot
Recommended

Fix Kubernetes ImagePullBackOff Error - The Complete Battle-Tested Guide

From "Pod stuck in ImagePullBackOff" to "Problem solved in 90 seconds"

Kubernetes
/troubleshoot/kubernetes-imagepullbackoff/comprehensive-troubleshooting-guide
61%

Recommendations combine user behavior, content similarity, research intelligence, and SEO optimization