The Real Performance Problems (And How to Actually Fix Them)

Most MariaDB performance guides tell you to "tune your configuration" without explaining what actually breaks in production. Here's what kills performance and the specific fixes that work.

InnoDB Buffer Pool: Give It Most of Your RAM
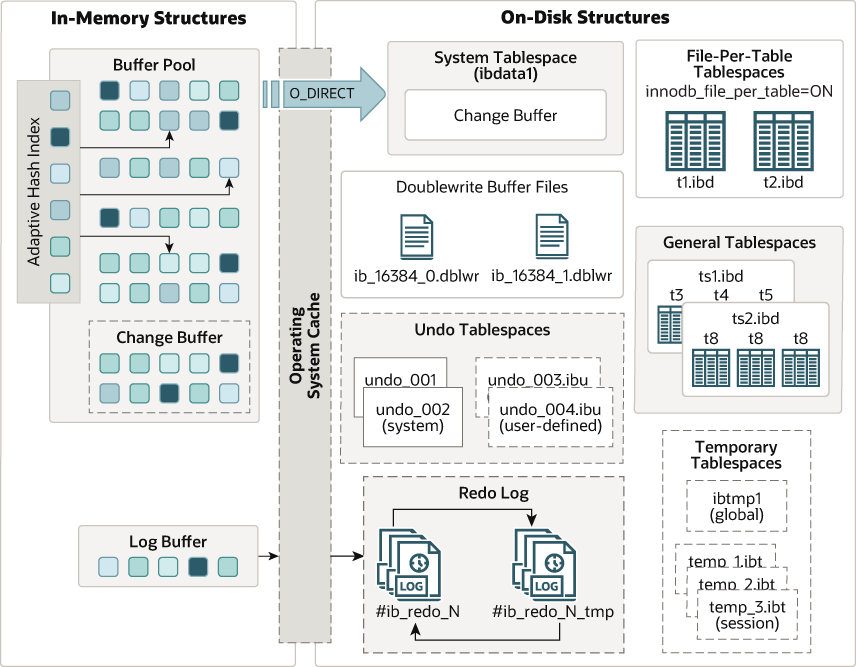
InnoDB Architecture Diagram

The InnoDB buffer pool is where MariaDB caches your data and indexes. If it's too small, you'll be hitting disk constantly. If it's too big, you'll run out of memory for the OS and other processes. This is the single most important setting for MariaDB performance.

The Math That Actually Works:

  • Dedicated database server: Set to 70-80% of total RAM
  • Shared server: Set to 50-60% of RAM
  • Minimum viable: 1GB (but seriously, get more RAM)
## For a 16GB dedicated server
innodb_buffer_pool_size = 12G

## For a 8GB shared server
innodb_buffer_pool_size = 4G

Don't guess - calculate based on your actual workload. I've seen too many servers die because someone set this to 90% and left no memory for the OS. The Releem performance tuning guide has detailed calculations for different server configurations.

Query Cache: Probably Turn It Off

Query cache sounds great in theory - cache query results for faster responses. In practice, it becomes a bottleneck with high concurrency. Every INSERT, UPDATE, or DELETE invalidates related cached queries, causing cache thrashing.

## For most workloads
query_cache_type = 0
query_cache_size = 0

## Only enable if you have mostly SELECT workloads
query_cache_type = 1
query_cache_size = 128M

Modern applications with proper caching layers (Redis, Memcached) make query cache redundant. Disable it unless you have a specific read-heavy use case. Percona's performance blog covers this in detail with actual benchmarks.

Connection Management: Stop the Memory Leak

Database Connections

MariaDB allocates memory per connection. With default settings, you can easily hit memory limits under load.

## Don't set this higher than you need
max_connections = 200

## Reuse threads instead of creating new ones
thread_cache_size = 16

## Connection timeout to prevent hanging connections
wait_timeout = 600
interactive_timeout = 600

Connection Pool Math: Each connection uses roughly 256KB + (sort_buffer_size + read_buffer_size + join_buffer_size). With 500 connections, that's easily 1GB+ just in connection overhead. NameHero's tuning guide has detailed memory calculations for connection planning.

Log File Sizing: Stop the Checkpoint Hell

InnoDB log files control transaction logging. Too small and you get frequent checkpoints that stall writes. Too large and crash recovery takes forever.

## For write-heavy workloads
innodb_log_file_size = 1G

## Multiple log files for better I/O distribution  
innodb_log_files_in_group = 2

## Log buffer to reduce disk I/O
innodb_log_buffer_size = 64M

Rule of thumb: Size your log files to handle at least an hour of peak write activity. Monitor Innodb_os_log_written to see your actual log write rate. MariaDB's workload optimization blog explains log sizing calculations in detail.

Table Cache: Stop Opening/Closing Files

MariaDB caches open table handles to avoid filesystem overhead. Too low and you'll see constant file open/close operations.

## Base on number of tables and concurrent connections
table_open_cache = 4000
table_definition_cache = 2000

## Monitor open file limits
open_files_limit = 65535

Check your actual usage with SHOW GLOBAL STATUS LIKE 'Open%tables'. If Opened_tables keeps increasing rapidly, you need a larger cache. Severalnines' MariaDB tuning guide covers table caching in production environments.

The Storage Engine Trap

Stop using MyISAM unless you know exactly why you need it. InnoDB handles crash recovery, foreign keys, and row-level locking properly.

InnoDB Tuning That Matters:

## Use modern flush method
innodb_flush_method = O_DIRECT

## Separate logs from data files
innodb_log_group_home_dir = /var/log/mysql/
innodb_data_home_dir = /var/lib/mysql/

## Faster commits with some durability risk
innodb_flush_log_at_trx_commit = 2

## More I/O threads for better parallelism
innodb_read_io_threads = 8
innodb_write_io_threads = 8

innodb_flush_log_at_trx_commit = 2 trades some crash safety for performance. You'll survive server crashes but not system crashes. For most applications, this is fine. Releem's InnoDB tuning guide explains the durability vs performance trade-offs in detail.

Memory-Based Tables: The Temporary Table Problem

Temporary tables that exceed memory limits get written to disk, which kills performance for complex queries.

## Size for in-memory temporary tables
tmp_table_size = 256M
max_heap_table_size = 256M

## Buffer for sorting operations
sort_buffer_size = 2M
join_buffer_size = 2M

Monitor Created_tmp_disk_tables vs Created_tmp_tables. If more than 25% of temp tables hit disk, increase these values. Cloudways' MariaDB performance guide covers temporary table optimization with real-world examples.

Configuration Parameter Impact Matrix

Parameter

Default Value

Production Value

Impact

When to Change

innodb_buffer_pool_size

128M

70-80% of RAM

⭐⭐⭐⭐⭐

Always

  • most critical setting

query_cache_type

1 (ON)

0 (OFF)

⭐⭐⭐⭐

High concurrency workloads

max_connections

151

200-500

⭐⭐⭐⭐

Based on connection pool size

innodb_log_file_size

48M

512M-2G

⭐⭐⭐⭐

Write-heavy applications

table_open_cache

2000

4000+

⭐⭐⭐

Many tables or high concurrency

innodb_flush_log_at_trx_commit

1

2

⭐⭐⭐

Performance over durability

tmp_table_size

16M

256M

⭐⭐⭐

Complex queries with GROUP BY/ORDER BY

sort_buffer_size

256K

2M

⭐⭐

Large result set sorting

join_buffer_size

256K

2M

⭐⭐

Queries with table joins

thread_cache_size

8

16-32

⭐⭐

High connection turnover

Query Optimization: Finding and Fixing Slow Shit

Configuration only gets you so far. Bad queries will kill performance no matter how much RAM you throw at them. Here's how to identify and fix the queries that are murdering your database.

Enable the Slow Query Log (And Actually Use It)

The slow query log records queries that take longer than a threshold to execute. Enable it before you have problems, not after.

## Enable slow query logging
slow_query_log = 1
slow_query_log_file = /var/log/mysql/slow.log
long_query_time = 1

## Log queries that don't use indexes
log_queries_not_using_indexes = 1

## Sample rate to avoid log spam
log_slow_rate_limit = 10

Analyzing the Log: Don't read the raw log file - use pt-query-digest from Percona Toolkit:

pt-query-digest /var/log/mysql/slow.log

This shows you which queries consume the most total time, not just which individual queries are slowest. A query that runs 0.5 seconds but executes 10,000 times per hour is worse than one that runs 30 seconds once per day.

The EXPLAIN Command: Your Query X-Ray

EXPLAIN shows how MariaDB executes your query. If you see type: ALL or Extra: Using filesort, your query is probably fucked.

EXPLAIN SELECT * FROM orders o 
JOIN customers c ON o.customer_id = c.id 
WHERE o.order_date > '2025-01-01';

Red Flags in EXPLAIN Output:

  • type: ALL - Full table scan (usually bad)
  • Extra: Using filesort - Sorting without an index
  • Extra: Using temporary - Creating temp tables
  • High rows count - Examining too many rows
  • Missing key - No index being used

Index Strategy: More Isn't Always Better

Wrong indexes hurt performance by slowing down writes and consuming memory. Right indexes make queries instant.

The Index Rules That Work:

  1. Primary key: Always use AUTO_INCREMENT integer, not UUIDs or natural keys
  2. Foreign keys: Index them or suffer in JOIN hell
  3. WHERE clause columns: Index columns used in WHERE conditions
  4. Composite indexes: Order matters - most selective column first
  5. Covering indexes: Include SELECT columns to avoid table lookups
-- Bad: Separate indexes that don't help
ALTER TABLE orders ADD INDEX idx_customer (customer_id);
ALTER TABLE orders ADD INDEX idx_date (order_date);

-- Good: Composite index for common query pattern
ALTER TABLE orders ADD INDEX idx_customer_date (customer_id, order_date);

-- Better: Covering index that includes SELECT columns
ALTER TABLE orders ADD INDEX idx_covering (customer_id, order_date, total_amount);

Fixing Common Query Anti-Patterns

SELECT * is Usually Stupid

-- Bad: Retrieves columns you don't need
SELECT * FROM orders WHERE customer_id = 123;

-- Good: Only get what you need
SELECT order_id, order_date, total_amount FROM orders WHERE customer_id = 123;

OR Conditions Kill Performance

-- Bad: OR prevents index usage
SELECT * FROM orders WHERE customer_id = 123 OR total_amount > 1000;

-- Good: Use UNION for better index usage
SELECT * FROM orders WHERE customer_id = 123
UNION
SELECT * FROM orders WHERE total_amount > 1000;

LIMIT with Large OFFSETs Scale Terribly

-- Bad: Gets slower with higher page numbers
SELECT * FROM orders ORDER BY order_date LIMIT 10000, 10;

-- Good: Use cursor-based pagination
SELECT * FROM orders WHERE order_id > 150000 ORDER BY order_id LIMIT 10;

Advanced Query Performance Techniques

Use Query Hints Sparingly

-- Force index usage when optimizer is wrong
SELECT * FROM orders FORCE INDEX (idx_customer_date) 
WHERE customer_id = 123;

-- Hint join order for complex queries
SELECT STRAIGHT_JOIN * FROM orders o, customers c 
WHERE o.customer_id = c.id;

Optimize Subqueries Into JOINs

-- Bad: Correlated subquery
SELECT * FROM customers c 
WHERE EXISTS (SELECT 1 FROM orders o WHERE o.customer_id = c.id);

-- Good: JOIN is usually faster
SELECT DISTINCT c.* FROM customers c 
INNER JOIN orders o ON c.id = o.customer_id;

Batch Operations Instead of Row-by-Row

-- Bad: Multiple single-row operations
INSERT INTO products (name, price) VALUES ('Product A', 10.00);
INSERT INTO products (name, price) VALUES ('Product B', 15.00);
INSERT INTO products (name, price) VALUES ('Product C', 20.00);

-- Good: Batch insert
INSERT INTO products (name, price) VALUES 
('Product A', 10.00),
('Product B', 15.00),
('Product C', 20.00);

Performance Schema: The Query Performance Microscope

MariaDB's Performance Schema provides detailed query metrics. Enable it for production monitoring:

-- Find queries consuming the most total time
SELECT 
    DIGEST_TEXT,
    COUNT_STAR as exec_count,
    AVG_TIMER_WAIT/1000000000 as avg_sec,
    SUM_TIMER_WAIT/1000000000 as total_sec
FROM performance_schema.events_statements_summary_by_digest 
ORDER BY SUM_TIMER_WAIT DESC 
LIMIT 10;

This tells you which query patterns need optimization first. Don't waste time optimizing queries that rarely run.

Memory Usage Optimization

Connection Memory Leaks
Each connection allocates buffers that add up quickly:

-- Check current memory usage per connection
SHOW VARIABLES LIKE '%buffer_size';
SHOW VARIABLES LIKE 'max_connections';

-- Calculate theoretical max memory usage
-- (sort_buffer_size + read_buffer_size + join_buffer_size) * max_connections

Temporary Table Problems
Monitor temp table creation to catch memory issues:

SHOW GLOBAL STATUS LIKE 'Created_tmp%';
-- Created_tmp_tables: Total temporary tables created
-- Created_tmp_disk_tables: Those that hit disk (bad)

If more than 25% of temp tables hit disk, increase tmp_table_size and max_heap_table_size.

Frequently Asked Questions About MariaDB Performance

Q

How much RAM should I allocate to innodb_buffer_pool_size?

A

On a dedicated database server, set it to 70-80% of total RAM. On shared servers, 50-60%. I've seen servers crash when set to 90%+ because the OS needs memory too. Start conservative and monitor actual usage with SHOW ENGINE INNODB STATUS.

Q

Why is my MariaDB server using so much memory?

A

Each connection allocates buffers (sort_buffer_size, read_buffer_size, join_buffer_size). With max_connections=500 and default buffer sizes, that's over 1GB just for connection overhead. Reduce max_connections or buffer sizes if memory usage is excessive.

Q

Should I enable query cache for better performance?

A

Usually no. Query cache becomes a bottleneck with high concurrency because every INSERT/UPDATE/DELETE invalidates related cached queries. Modern applications use application-level caching (Redis, Memcached) instead. Only enable for read-heavy workloads with rare writes.

Q

My queries were fast but suddenly became slow. What changed?

A

Check if table statistics became stale. MariaDB's optimizer relies on table statistics to choose execution plans. Run ANALYZE TABLE tablename to update statistics. Also check if the query plan changed with EXPLAIN

  • missing indexes or statistics can cause the optimizer to choose terrible plans.
Q

How do I know if my indexes are being used?

A

Use EXPLAIN before your queries.

Look for key column showing index usage and type showing access method. type: ALL means full table scan (usually bad). Monitor Handler_read_rnd_next in SHOW GLOBAL STATUS

  • high values indicate table scans.
Q

What's the difference between innodb_flush_log_at_trx_commit settings?

A
  • 1 (default): Full ACID compliance, logs flushed on every commit (slowest, safest)
  • 2: Logs written but not flushed on commit (faster, survives crashes but not system failures)
  • 0: Logs written/flushed once per second (fastest, can lose up to 1 second of data)

For most web applications, 2 offers good performance with acceptable risk.

Q

How do I fix "Too many connections" errors?

A

First check if you have connection leaks

  • applications not closing connections properly.

Monitor Threads_connected and Max_used_connections. If legitimate, increase max_connections but be aware of memory usage. Better solution: use connection pooling to limit actual connections.

Q

Why are my temporary tables hitting disk?

A

Temporary tables larger than tmp_table_size or max_heap_table_size get written to disk, which is slow. Increase these values, but monitor memory usage. Better solution: optimize queries to reduce temporary table size with better WHERE clauses and indexes.

Q

Should I use MyISAM instead of InnoDB for better performance?

A

No. MyISAM is faster for simple SELECT queries but has no crash recovery, no transactions, and table-level locking. Any corruption requires manual repair. InnoDB provides better overall performance for real applications with its row-level locking and crash safety.

Q

How large should my InnoDB log files be?

A

Size them to handle at least an hour of peak write activity. Too small causes frequent checkpoints that stall writes. Too large means slow crash recovery. Monitor Innodb_os_log_written to see your write rate. Start with 1GB log files for most production systems.

Q

My MariaDB server keeps running out of file handles. What's wrong?

A

Check open_files_limit setting and system ulimits. Each connection can open multiple files (tables, indexes, logs). With high max_connections and many tables, you can hit file handle limits. Increase open_files_limit and system limits via /etc/security/limits.conf.

Q

How do I monitor MariaDB performance in production?

A

Enable Performance Schema for detailed metrics. Use tools like Percona Monitoring and Management (PMM), Grafana with Prometheus mysqld_exporter, or commercial solutions. Key metrics: query response time, connection count, buffer pool hit ratio, lock wait time.

Q

Can I change performance settings without restarting MariaDB?

A

Some variables can be changed dynamically with SET GLOBAL variable_name = value, but critical ones like innodb_buffer_pool_size require a restart. Check if a variable is dynamic with SHOW VARIABLES LIKE 'variable_name' and look at the "Dynamic" column in documentation.

Q

What's the best storage engine for analytics workloads?

A

For pure analytics, try ColumnStore but expect it to break in creative ways. For mixed workloads, stick with InnoDB and use proper indexes. Consider dedicated analytical databases like ClickHouse if analytics are critical.

Q

How do I backup MariaDB without impacting performance?

A

Use mariadb-backup (hot backup tool) or set up a read replica for backups. Avoid mysqldump on large production databases during peak hours

  • it locks tables and impacts performance. Schedule backups during low-traffic periods.
Q

Why does MariaDB performance degrade over time?

A

Common causes: fragmented tables (run OPTIMIZE TABLE), stale statistics (run ANALYZE TABLE), growing log files, increasing data size outgrowing buffer pool, or memory leaks in application connections. Regular maintenance and monitoring prevent most issues.

Monitoring and Troubleshooting Performance Issues

Configuration and query optimization prevent most problems, but you still need monitoring to catch issues before they kill your application. Here's what actually matters in production.

Key Performance Metrics That Predict Problems

Don't monitor everything - focus on metrics that predict failure:

Connection Health

SHOW GLOBAL STATUS LIKE 'Threads_connected';
SHOW GLOBAL STATUS LIKE 'Max_used_connections';
SHOW GLOBAL STATUS LIKE 'Connection_errors_max_connections';

When Threads_connected approaches max_connections, you'll start getting "too many connections" errors. If Connection_errors_max_connections increases, you've already hit the limit.

Buffer Pool Efficiency

SHOW GLOBAL STATUS LIKE 'Innodb_buffer_pool_read_requests';
SHOW GLOBAL STATUS LIKE 'Innodb_buffer_pool_reads';

Buffer pool hit ratio should be >99%. Calculate it: (read_requests - reads) / read_requests * 100. If it's under 95%, you need more RAM or better indexing.

Query Performance Degradation

SHOW GLOBAL STATUS LIKE 'Slow_queries';
SHOW GLOBAL STATUS LIKE 'Created_tmp_disk_tables';
SHOW GLOBAL STATUS LIKE 'Handler_read_rnd_next';

Slow_queries increasing rapidly indicates performance regression. Created_tmp_disk_tables means temp tables are hitting disk instead of memory. High Handler_read_rnd_next suggests table scans from missing indexes.

The 3AM Debugging Toolkit

When MariaDB shits the bed at 3AM, you need fast diagnostics:

Process List Analysis

-- Find long-running queries
SELECT ID, USER, HOST, DB, COMMAND, TIME, STATE, LEFT(INFO,50) 
FROM INFORMATION_SCHEMA.PROCESSLIST 
WHERE TIME > 30 ORDER BY TIME DESC;

-- Kill specific problematic query
KILL QUERY 12345;

Lock Analysis

-- Check for deadlocks and lock waits
SHOW ENGINE INNODB STATUS;

-- Find blocking transactions
SELECT 
  r.trx_id waiting_trx_id,
  r.trx_mysql_thread_id waiting_thread,
  r.trx_query waiting_query,
  b.trx_id blocking_trx_id,
  b.trx_mysql_thread_id blocking_thread,
  b.trx_query blocking_query
FROM information_schema.innodb_lock_waits w
INNER JOIN information_schema.innodb_trx b ON b.trx_id = w.blocking_trx_id
INNER JOIN information_schema.innodb_trx r ON r.trx_id = w.requesting_trx_id;

Memory Pressure Signs

-- Check if you're swapping
SHOW GLOBAL STATUS LIKE 'Innodb_buffer_pool_pages_dirty';
SHOW GLOBAL STATUS LIKE 'Innodb_buffer_pool_wait_free';

-- High dirty pages or wait_free indicates memory pressure

Common Performance Failure Patterns

The Connection Exhaustion Death Spiral

  1. Application doesn't close connections properly
  2. Threads_connected hits max_connections
  3. New connections get "too many connections" error
  4. Application retry logic makes it worse
  5. Database becomes completely unresponsive

Fix: Implement connection pooling and connection timeouts. Monitor connection usage continuously.

The Buffer Pool Thrashing Pattern

  1. Working set exceeds buffer pool size
  2. Frequent disk I/O as pages get evicted
  3. Query performance becomes unpredictable
  4. Disk I/O saturates storage subsystem

Fix: Increase RAM and buffer pool size, or optimize queries to reduce working set.

The Lock Escalation Cascade

  1. Long-running transaction holds locks
  2. Other transactions start waiting
  3. Lock wait timeout causes application errors
  4. Application retries worsen the problem

Fix: Optimize transaction scope, add proper indexes, use READ COMMITTED isolation level.

Production Monitoring Setup

Essential Monitoring Queries
Set up automated alerts for these:

-- Buffer pool hit ratio (should be >99%)
SELECT 
  ROUND((1 - (Innodb_buffer_pool_reads / Innodb_buffer_pool_read_requests)) * 100, 2) 
  AS buffer_pool_hit_ratio
FROM 
  (SELECT VARIABLE_VALUE AS Innodb_buffer_pool_reads 
   FROM information_schema.GLOBAL_STATUS 
   WHERE VARIABLE_NAME = 'Innodb_buffer_pool_reads') t1,
  (SELECT VARIABLE_VALUE AS Innodb_buffer_pool_read_requests 
   FROM information_schema.GLOBAL_STATUS 
   WHERE VARIABLE_NAME = 'Innodb_buffer_pool_read_requests') t2;

-- Connection usage percentage (alert at >80%)
SELECT 
  ROUND((Threads_connected / max_connections) * 100, 2) AS connection_usage_pct
FROM 
  (SELECT VARIABLE_VALUE AS Threads_connected 
   FROM information_schema.GLOBAL_STATUS 
   WHERE VARIABLE_NAME = 'Threads_connected') t1,
  (SELECT VARIABLE_VALUE AS max_connections 
   FROM information_schema.GLOBAL_VARIABLES 
   WHERE VARIABLE_NAME = 'max_connections') t2;

Automated Health Checks

#!/bin/bash
## Simple health check script

## Check if MariaDB is responding
mysqladmin ping --silent || echo "CRITICAL: MariaDB not responding"

## Check connection usage
CONN_USAGE=$(mysql -se "SELECT ROUND((t1.c/t2.c)*100,2) FROM 
  (SELECT VARIABLE_VALUE c FROM information_schema.GLOBAL_STATUS 
   WHERE VARIABLE_NAME = 'Threads_connected') t1,
  (SELECT VARIABLE_VALUE c FROM information_schema.GLOBAL_VARIABLES 
   WHERE VARIABLE_NAME = 'max_connections') t2;")

if (( $(echo "$CONN_USAGE > 80" | bc -l) )); then
    echo "WARNING: Connection usage at ${CONN_USAGE}%"
fi

Performance Regression Detection

Baseline Performance Metrics
Capture baseline performance during normal operation:

-- Capture current performance snapshot
CREATE TABLE performance_baseline AS
SELECT 
  NOW() as snapshot_time,
  (SELECT VARIABLE_VALUE FROM information_schema.GLOBAL_STATUS 
   WHERE VARIABLE_NAME = 'Questions') as questions,
  (SELECT VARIABLE_VALUE FROM information_schema.GLOBAL_STATUS 
   WHERE VARIABLE_NAME = 'Slow_queries') as slow_queries,
  (SELECT VARIABLE_VALUE FROM information_schema.GLOBAL_STATUS 
   WHERE VARIABLE_NAME = 'Threads_connected') as threads_connected;

Trend Analysis
Compare current metrics against historical baselines to detect gradual degradation before it becomes critical.

Emergency Response Procedures

When Everything Goes to Shit:

  1. Stop the bleeding: Kill problematic long-running queries
  2. Assess damage: Check connection count, lock waits, buffer pool pressure
  3. Quick fixes: Restart connections, increase memory limits temporarily
  4. Root cause: Analyze slow query log, check for schema changes
  5. Permanent fix: Apply configuration changes, optimize problematic queries

Never Do This in Production:

  • Change critical parameters without understanding impact
  • Kill all connections (use KILL QUERY not KILL CONNECTION)
  • Restart MariaDB without investigating root cause
  • Increase limits without considering memory constraints

The key to production performance management is proactive monitoring and having runbooks ready for common failure scenarios. Most performance crises are predictable and preventable with proper monitoring.

Essential MariaDB Performance Resources

Related Tools & Recommendations

compare
Similar content

PostgreSQL vs MySQL vs MariaDB vs SQLite vs CockroachDB

Compare PostgreSQL, MySQL, MariaDB, SQLite, and CockroachDB to pick the best database for your project. Understand performance, features, and team skill conside

/compare/postgresql-mysql-mariadb-sqlite-cockroachdb/database-decision-guide
100%
tool
Similar content

PostgreSQL Performance Optimization: Master Tuning & Monitoring

Optimize PostgreSQL performance with expert tips on memory configuration, query tuning, index design, and production monitoring. Prevent outages and speed up yo

PostgreSQL
/tool/postgresql/performance-optimization
69%
tool
Similar content

Apache Cassandra Performance Optimization Guide: Fix Slow Clusters

Stop Pretending Your 50 Ops/Sec Cluster is "Scalable"

Apache Cassandra
/tool/apache-cassandra/performance-optimization-guide
56%
tool
Similar content

MySQL Workbench Performance Fixes: Crashes, Slowdowns, Memory

Stop wasting hours on crashes and timeouts - actual solutions for MySQL Workbench's most annoying performance problems

MySQL Workbench
/tool/mysql-workbench/fixing-performance-issues
52%
tool
Similar content

Redis Cluster Production Issues: Troubleshooting & Survival Guide

When Redis clustering goes sideways at 3AM and your boss is calling. The essential troubleshooting guide for split-brain scenarios, slot migration failures, and

Redis
/tool/redis/clustering-production-issues
49%
tool
Similar content

PostgreSQL: Why It Excels & Production Troubleshooting Guide

Explore PostgreSQL's advantages over other databases, dive into real-world production horror stories, solutions for common issues, and expert debugging tips.

PostgreSQL
/tool/postgresql/overview
43%
tool
Similar content

PostgreSQL Logical Replication: When Streaming Isn't Enough

Unlock PostgreSQL Logical Replication. Discover its purpose, how it differs from streaming replication, and a practical guide to setting it up, including tips f

PostgreSQL
/tool/postgresql/logical-replication
43%
tool
Similar content

MySQL Overview: Why It's Still the Go-To Database

Explore MySQL's enduring popularity, real-world performance, and vast ecosystem. Understand why this robust database remains a top choice for developers worldwi

MySQL
/tool/mysql/overview
42%
tool
Similar content

Liquibase Overview: Automate Database Schema Changes & DevOps

Because manually deploying schema changes while praying is not a sustainable strategy

Liquibase
/tool/liquibase/overview
42%
tool
Similar content

MariaDB Overview: The MySQL Alternative & Installation Guide

Discover MariaDB, the powerful open-source alternative to MySQL. Learn why it was created, how to install it, and compare its benefits for your applications.

MariaDB
/tool/mariadb/overview
40%
compare
Similar content

PostgreSQL vs MySQL vs MariaDB - Performance Analysis 2025

Which Database Will Actually Survive Your Production Load?

PostgreSQL
/compare/postgresql/mysql/mariadb/performance-analysis-2025
39%
tool
Similar content

ClickHouse Overview: Analytics Database Performance & SQL Guide

When your PostgreSQL queries take forever and you're tired of waiting

ClickHouse
/tool/clickhouse/overview
39%
tool
Similar content

Neon Production Troubleshooting Guide: Fix Database Errors

When your serverless PostgreSQL breaks at 2AM - fixes that actually work

Neon
/tool/neon/production-troubleshooting
39%
tool
Similar content

Cassandra Vector Search for RAG: Simplify AI Apps with 5.0

Learn how Apache Cassandra 5.0's integrated vector search simplifies RAG applications. Build AI apps efficiently, overcome common issues like timeouts and slow

Apache Cassandra
/tool/apache-cassandra/vector-search-ai-guide
39%
tool
Similar content

Neon Serverless PostgreSQL: An Honest Review & Production Insights

PostgreSQL hosting that costs less when you're not using it

Neon
/tool/neon/overview
39%
tool
Similar content

Flyway: Database Migrations Explained - Why & How It Works

Database migrations without the XML bullshit or vendor lock-in

Flyway
/tool/flyway/overview
39%
compare
Similar content

PostgreSQL vs MySQL vs MariaDB: Developer Ecosystem Analysis

PostgreSQL, MySQL, or MariaDB: Choose Your Database Nightmare Wisely

PostgreSQL
/compare/postgresql/mysql/mariadb/developer-ecosystem-analysis
36%
howto
Similar content

PostgreSQL vs MySQL Performance Optimization Guide

I've Spent 10 Years Getting Paged at 3AM Because Databases Fall Over - Here's What Actually Works

PostgreSQL
/howto/optimize-database-performance-postgresql-mysql/comparative-optimization-guide
36%
tool
Similar content

MongoDB Overview: How It Works, Pros, Cons & Atlas Costs

Explore MongoDB's document database model, understand its flexible schema benefits and pitfalls, and learn about the true costs of MongoDB Atlas. Includes FAQs

MongoDB
/tool/mongodb/overview
35%
tool
Similar content

Redis Overview: In-Memory Database, Caching & Getting Started

The world's fastest in-memory database, providing cloud and on-premises solutions for caching, vector search, and NoSQL databases that seamlessly fit into any t

Redis
/tool/redis/overview
33%

Recommendations combine user behavior, content similarity, research intelligence, and SEO optimization