The Reality of MySQL Workbench Performance Problems

If you've landed here, you've probably experienced the soul-crushing frustration firsthand. MySQL Workbench 8.0.40 STILL hasn't fixed the fundamental performance issues that have been pissing us off for years. The memory leaks persist, large dataset operations still crash randomly, and connection timeouts happen precisely when you're debugging production at 3AM.

Why Workbench Performance Sucks (And It's Not Just You)

The core problem is that MySQL Workbench tries to be everything to everyone: visual modeler, SQL editor, administration console, migration tool, and performance monitor all in one desktop application. This kitchen-sink approach results in a bloated architecture that consumes massive amounts of system resources.

The Architecture Problem: Workbench uses Python for many operations, including the data import/export wizards. When you see those cryptic error messages during imports, you're looking at Python stack traces. This interpreted language layer adds significant overhead compared to native database operations like mysqldump or LOAD DATA INFILE.

Memory Management Disaster: Workbench loads entire result sets into memory before displaying them. Try selecting 500K rows and watch your RAM usage spike to 4GB while the application becomes unresponsive. The GUI toolkit doesn't handle large datasets gracefully, and memory isn't properly released after operations complete.

Connection Pool Hell: Unlike proper database tools that maintain efficient connection pools, Workbench's connection management is naive. Each query tab potentially opens new connections, connection timeouts aren't handled gracefully, and SSH tunneling adds another layer of potential failure points.

MySQL Workbench Performance Dashboard

The Performance Problems That Actually Matter

Memory Leaks That Kill Productivity

Every MySQL Workbench user discovers this eventually: the application steadily consumes more memory over time until it becomes unusably slow. On Windows systems, Task Manager shows Workbench climbing from 200MB at startup to over 2GB after a few hours of normal use.

The leak manifests most obviously when working with result sets. Execute a query that returns 100K rows, browse through the results, then close the tab. That memory isn't freed - it accumulates until you restart the entire application. Users dealing with production databases learn to restart Workbench daily, sometimes hourly.

Real-world nightmare: During a critical production incident in March, our team spent 45 minutes troubleshooting what looked like database performance issues. Users couldn't checkout and the CEO was breathing down our necks. First thing we did was fire up Workbench to check slow queries. The piece of shit took 30 seconds to execute a simple SELECT * FROM orders LIMIT 10 - something that should return instantly.

We were convinced the database server was fucked. Started checking CPU, memory, I/O stats on the server - everything looked fine. Then my colleague pointed out that Workbench was using 2.8GB of RAM on my laptop. Restarting the application suddenly made those same queries return in 50ms. We'd wasted nearly an hour debugging a "database performance problem" that was actually just Workbench being a memory-hogging piece of shit.

Export/Import Operations From Hell

The Table Data Import/Export Wizard is where Workbench truly fails. Importing a CSV with 20 million rows? Plan on waiting a month if it doesn't crash first. Stack Overflow is littered with complaints about import operations taking literal days for datasets that should process in minutes.

The wizard processes rows one at a time, committing after each insert. For a 1 million row CSV, that's 1 million individual database transactions instead of bulk operations. Professional database administrators avoid the import wizard entirely, using LOAD DATA INFILE commands that complete the same operation in under a minute.

I once tried importing a 500K row customer data file using the wizard. Started it on Friday afternoon, came back Monday morning to find it had crashed somewhere around 200-something thousand rows with a generic "MySQL server has gone away" error. No partial data imported, no useful error details, just three days of wasted time. Rewrote it as a LOAD DATA INFILE command and the whole thing finished in 12 seconds.

The export side is equally broken: Attempting to export more than 100K rows often results in application crashes with no useful error messages. The export process doesn't stream data efficiently, instead trying to build the entire output file in memory before writing it to disk. Last month I needed to export user analytics data for our marketing team - 750K rows, nothing crazy. Workbench died three times before I gave up and used mysqldump.

Connection Timeout Roulette

MySQL Workbench Home Screen

Connection management in Workbench is unreliable, especially for remote database connections. The default timeout settings are too aggressive for real-world network conditions, SSH tunnel configuration is buried in confusing dialogs, and SSL connection errors provide cryptic messages that require diving into log files to diagnose.

Production debugging nightmare: Picture this scenario - production database is experiencing issues, users are complaining, and you need to run diagnostic queries immediately. You open Workbench, attempt to connect to the production server, and get "Connection timeout" errors. While you're troubleshooting Workbench's connection problems, the actual database issue is getting worse.

This happened to me during Black Friday last year - site was crawling, transactions backing up, and the VP of Engineering was asking for updates every 2 minutes. I needed to identify the blocking queries fast. Workbench gave me "Can't connect to MySQL server on 'prod-db' (110)" errors for 10 straight minutes while I fumbled with timeout settings. Finally said fuck it and SSH'd into the database server directly. Found the problem immediately with SHOW PROCESSLIST - some asshole developer had left a SELECT COUNT(*) running on our 50 million row orders table without a LIMIT.

The SSH tunneling feature is particularly problematic. Configuration options are scattered across multiple dialog tabs, error messages don't indicate whether the problem is SSH authentication or database connectivity, and successful connections sometimes drop randomly during long-running operations. The "Test Connection" button lies - it'll show green, then immediately fail when you try to actually query data.

Most experienced developers maintain multiple database tools specifically because Workbench's connection reliability can't be trusted when it matters most. DBeaver, TablePlus, HeidiSQL, Sequel Ace, phpMyAdmin, MySQL Shell, or even command-line MySQL clients become the fallback options when Workbench fails. For monitoring, Percona Toolkit provides superior diagnostic capabilities.
Quick Fixes for Common MySQL Workbench Performance Issues

Q

Why does MySQL Workbench keep running out of memory and crashing?

A

Because it loads entire result sets into RAM instead of streaming them.

Limit your SELECT queries to under 10,000 rows using LIMIT clauses. If you need to review larger datasets, use pagination: LIMIT 10000 OFFSET 0, then LIMIT 10000 OFFSET 10000, etc. Restart Workbench daily to clear accumulated memory leaks

  • it's not a real solution, but it keeps you productive.
Q

How do I fix "Connection timeout" errors that happen randomly?

A

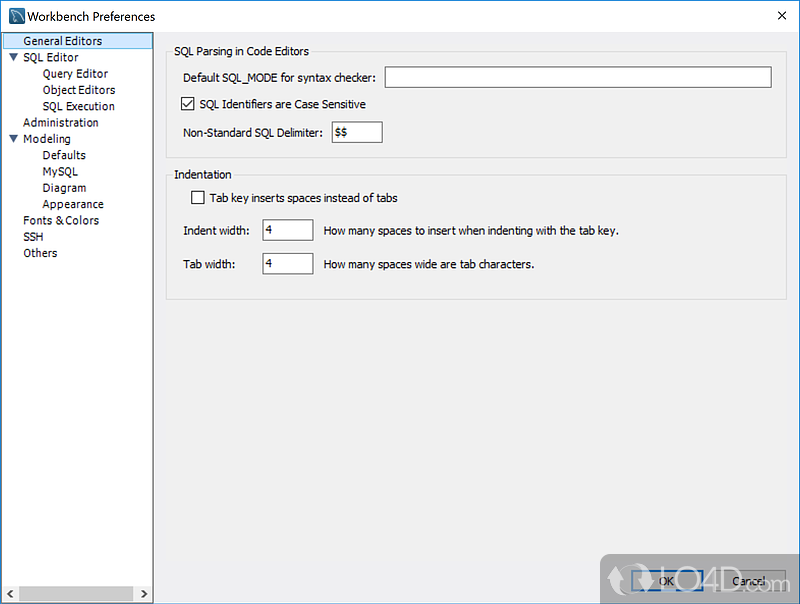
First, increase the timeout values. Go to Edit > Preferences > SQL Editor and set:

  • DBMS connection read timeout: 600 seconds
  • DBMS connection timeout: 60 seconds

For SSH connections, the timeout is often the SSH tunnel failing, not the MySQL connection. Test your SSH connection separately using the command line: ssh -L 3307:localhost:3306 user@server. If SSH works but Workbench still times out, the problem is Workbench's shitty SSH implementation.

Also check the actual error in Workbench's log - it's usually something like "Lost connection to MySQL server at 'reading initial communication packet', system error: 0" which just means the connection dropped. Half the time restarting Workbench fixes it because the app gets confused about connection states.

Q

Why does the data import wizard take forever and how do I fix it?

A

Don't use the import wizard for anything larger than test data. It processes one row at a time like it's 1995. Instead, use LOAD DATA INFILE which can import millions of rows in minutes:

LOAD DATA INFILE '/path/to/your/file.csv' 
INTO TABLE your_table 
FIELDS TERMINATED BY ',' 
ENCLOSED BY '"' 
LINES TERMINATED BY '
' 
IGNORE 1 ROWS;

If you must use the wizard, set sql_mode = '' first to disable strict mode, and disable autocommit: SET autocommit = 0;. This won't make it fast, but it might prevent crashes.

Q

How do I stop Workbench from freezing when I run queries on large tables?

A

Add LIMIT clauses to every query until you find the actual problem. Workbench chokes on large result sets. For analysis work, use aggregate queries:

-- Don't do this:
SELECT * FROM large_table WHERE condition;

-- Do this instead:
SELECT COUNT(*), column_name, AVG(numeric_column) 
FROM large_table 
WHERE condition 
GROUP BY column_name 
LIMIT 100;

If you need to see the actual data, use command line tools: mysql -e "SELECT * FROM large_table LIMIT 1000" > results.txt

Q

Why does Workbench use 4GB of RAM when I'm just browsing a few tables?

A

Memory leaks and poor resource management. Each result set you view accumulates in memory even after you close tabs. The only real fix is restarting the application. To minimize the problem:

  • Close result tabs immediately after reviewing data
  • Don't open multiple query tabs simultaneously
  • Reduce default result set limits in Edit > Preferences > SQL Editor > Limit Rows
  • Use SELECT column_name instead of SELECT * to reduce memory per row
Q

How do I export large tables without Workbench crashing?

A

Don't use the export wizard for production data. Use mysqldump from command line:

mysqldump -u username -p database_name table_name > export.sql

For CSV exports, use SELECT INTO OUTFILE:

SELECT * INTO OUTFILE '/tmp/table_export.csv' 
FIELDS TERMINATED BY ',' 
ENCLOSED BY '"' 
LINES TERMINATED BY '
' 
FROM table_name;

The export wizard crashes because it tries to build the entire file in memory before writing it.

Q

Why do my SSH tunnel connections keep dropping during long queries?

A

SSH tunnels in Workbench are unreliable for long operations. The connection doesn't handle network interruptions gracefully. Create your own SSH tunnel outside of Workbench:

ssh -f -N -L 3307:localhost:3306 user@remote_server

Then connect Workbench to localhost:3307 as a local connection. This separates SSH connection management from Workbench's buggy implementation.

Q

How do I fix the "Lost connection to MySQL server during query" error?

A

This happens because Workbench doesn't handle connection timeouts properly. Increase MySQL server timeouts:

SET SESSION wait_timeout = 28800;
SET SESSION interactive_timeout = 28800;

Also check your network - if you're on WiFi or VPN, connection instability causes this error. Wired connections are more reliable for database work.

Pro tip: This error also happens when Workbench 8.0.43 connects to older MySQL 5.7 servers - there's some compatibility bullshit with the authentication handshake. The error message says "Lost connection to MySQL server during query (2013)" but the real problem is version incompatibility, not your shitty WiFi.

Q

What settings should I change to make Workbench suck less?

A

Go to Edit > Preferences and adjust:

SQL Editor tab:

  • Limit Rows: Set to 1000 (default 1000 is actually reasonable)
  • Limit Rows Count: Check this to prevent accidentally loading massive result sets
  • DBMS connection read timeout: 600 seconds
  • DBMS connection timeout: 60 seconds

SQL Execution tab:

  • Continue on SQL script error: Uncheck this - stop on errors instead of continuing
  • Leave autocommit mode enabled: Check this unless you specifically need transactions

Modeling tab:

  • Automatically save model changes: Uncheck this to prevent constant file I/O
Q

When should I just give up on Workbench and use something else?

A

If you're doing any of these regularly, just fucking switch tools:

  • Importing/exporting datasets larger than 50K rows: Use command line tools or die slowly
  • Working with multiple database types: Use DBeaver instead of suffering
  • Need reliable connections for production debugging: Use TablePlus or command line before you get fired
  • Performance analysis on production systems: Use Percona Monitoring or dedicated tools that actually work

Workbench is decent for visual schema design and casual development work. For everything else, specialized tools work better and won't make you want to throw your laptop out the window.

Advanced Performance Optimization and Configuration Fixes

After dealing with Workbench's obvious problems, you can implement some deeper fixes that actually improve performance instead of just working around the worst issues. These optimizations won't turn Workbench into a speed demon, but they'll make it usable for professional work.

MySQL Workbench Backup and Recovery

Memory Configuration That Actually Works

MySQL InnoDB Buffer Pool Configuration

The default memory settings in Workbench are designed for machines from 2010. On a system with 16GB RAM, Workbench still uses conservative memory limits that cause unnecessary disk I/O and poor caching behavior.

InnoDB Buffer Pool Optimization

If you're connecting to a MySQL server you control, the single most important performance fix is properly configuring the InnoDB buffer pool. Set innodb_buffer_pool_size to 70% of available server RAM:

-- Check current buffer pool size
SHOW VARIABLES LIKE 'innodb_buffer_pool_size';

-- Set it properly (requires server restart)
-- Add to my.cnf or my.ini:
[mysqld]
innodb_buffer_pool_size = 8G

This dramatically improves query performance in Workbench because data stays cached in memory instead of requiring disk reads for every operation. On my dev server, queries went from taking 2-3 seconds to returning in 200ms after bumping buffer pool from the default 128MB to 8GB. It's the difference between wanting to throw your laptop out the window and actually getting work done.

Connection Pooling Configuration

Workbench's default connection handling creates new connections constantly, which adds latency to every operation. Bump up the connection limits or you'll spend all day waiting for timeouts:

-- Increase connection limits if you use multiple tabs
SET GLOBAL max_connections = 500;

-- Extend timeouts for long-running operations  
SET GLOBAL wait_timeout = 28800;
SET GLOBAL interactive_timeout = 28800;

If you're switching between databases all day, set up connection pooling with ProxySQL, MaxScale, or MySQL Router or you'll hate your life. Consider connection_pool_size tuning for MySQL 8.0+ environments.

SQL Editor Performance Tweaks

The SQL editor's default settings prioritize safety over performance. For experienced users, these changes eliminate annoying delays and improve workflow efficiency:

Query Result Optimization

Go to Edit > Preferences > SQL Editor and fix these settings:

  • Safe Updates: Disable this if you know what you're doing. Safe updates prevent UPDATE and DELETE statements without WHERE clauses, but also adds query overhead
  • Query Timeout: Increase from 30 to 600 seconds for complex analytical queries
  • Buffer Size: Set to maximum (1000) to cache more query results in memory

Execution Plan Caching

Enable persistent execution plans to speed up repeated query analysis:

-- Enable performance schema if not already active
UPDATE performance_schema.setup_consumers 
SET ENABLED = 'YES' 
WHERE NAME LIKE '%statement%';

-- Enable query cache for repeated operations
SET GLOBAL query_cache_type = ON;
SET GLOBAL query_cache_size = 268435456; -- 256MB

The Visual Explain feature becomes much faster when execution plans are cached, especially for queries you're iteratively optimizing. Combine with EXPLAIN ANALYZE and Performance Schema for proper query analysis.

File I/O and Storage Optimization

Workbench's temporary file handling is inefficient by default. These changes reduce disk I/O overhead that causes interface lag during data operations:

Temporary Directory Configuration

On Windows, set the TEMP environment variable to point to an SSD location. Workbench creates temporary files for result sets, exports, and model operations. Spinning disk storage causes noticeable delays during these operations.

I found this out the hard way when running Workbench on a laptop with a 5400 RPM drive - every query that returned more than a few hundred rows would lock up the interface for 10-15 seconds while it wrote temp files. Moving the temp directory to an SSD cut that delay down to under a second.

For Linux/macOS, make sure /tmp is on fast storage:

## Check current temp directory performance
df -h /tmp

## If /tmp is on slow storage, create a faster alternative
sudo mkdir /opt/mysql-tmp
sudo chmod 777 /opt/mysql-tmp
export TMPDIR=/opt/mysql-tmp

Model File Performance

EER model files (.mwb) become sluggish when they exceed 50MB. For complex database schemas, these optimizations prevent interface freezing:

  1. Enable model compression: In Edit > Preferences > Modeling, check "Compress model files"
  2. Reduce diagram complexity: Hide relationship lines that aren't essential for documentation
  3. Split large models: Create separate models for different functional areas of your schema

Network and Connection Optimization

Network latency amplifies Workbench's performance problems. Optimizing the network stack improves responsiveness, especially for remote database connections.

SSH Tunnel Performance

Instead of using Workbench's built-in SSH tunneling, create optimized tunnels externally:

## High-performance SSH tunnel with compression
ssh -f -N -C -L 3307:localhost:3306 -o ServerAliveInterval=30 user@remote_server

## Connect Workbench to localhost:3307

The -C flag enables compression which significantly reduces bandwidth for result sets with repeated data. ServerAliveInterval prevents tunnel disconnections during idle periods.

SSL Configuration Optimization

If your MySQL server requires SSL, Workbench's default SSL settings prioritize security over performance. For trusted network environments, optimize SSL configuration:

  1. In connection settings, choose "Require SSL" instead of "Require and Verify CA"
  2. Use TLS 1.2 instead of TLS 1.3 to avoid compatibility issues with older client libraries
  3. Disable SSL certificate verification for internal development servers

Performance Monitoring Integration

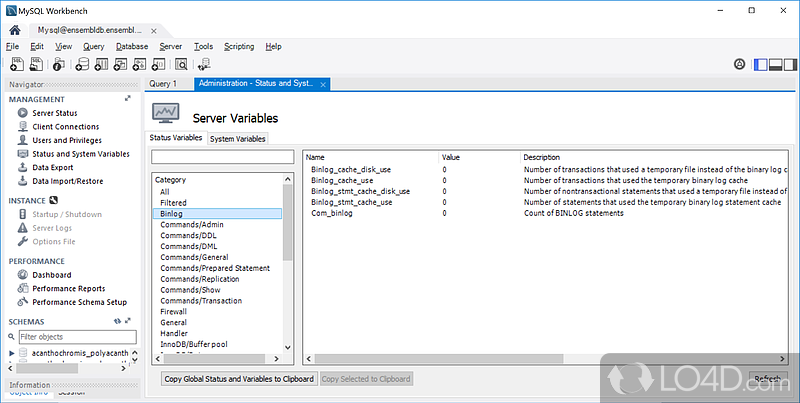
Use Workbench's Performance Schema integration to identify bottlenecks in your own usage patterns:

Slow Query Analysis

Enable slow query logging to identify which operations in Workbench are causing performance problems:

SET GLOBAL slow_query_log = 'ON';
SET GLOBAL long_query_time = 2;
SET GLOBAL log_queries_not_using_indexes = 'ON';

Review the slow query log periodically to identify queries that could benefit from indexing or rewriting.

Connection Monitoring

Track connection overhead using Performance Schema:

SELECT EVENT_NAME, COUNT_STAR, SUM_TIMER_WAIT/1000000000000 as SUM_TIMER_WAIT_SEC
FROM performance_schema.events_waits_summary_global_by_event_name
WHERE EVENT_NAME LIKE '%connect%'
ORDER BY SUM_TIMER_WAIT_SEC DESC;

High connection overhead indicates that Workbench is creating too many new connections instead of reusing existing ones.

When Optimization Isn't Enough

Despite these optimizations, Workbench has fundamental architectural limitations that can't be configured away. Recognize when you need alternative tools:

For bulk data operations: Command-line tools like `mysql`, `mysqldump`, `mysqlimport`, and `LOAD DATA INFILE` are orders of magnitude faster than Workbench's GUI operations.

For production monitoring: Specialized tools like Percona Monitoring and Management provide better performance insights than Workbench's basic dashboard.

For multi-database environments: DBeaver handles multiple database types with better resource management and connection pooling.

The goal isn't to make Workbench perfect - it's to make it good enough for the tasks it actually handles well while recognizing its limitations and using appropriate alternatives when needed.

Performance Comparison: MySQL Workbench vs Alternatives

Tool

Import Speed (1M rows)

Memory Usage

Connection Reliability

Export Performance

Best Use Case

MySQL Workbench

like 50 minutes, maybe an hour

2-4GB (memory vampire)

Dogshit (times out when you need it most)

Dies horribly on anything real-sized

Visual schema design, suffering through corporate requirements

DBeaver

around 6-7 minutes

~400MB

Excellent

Handles big datasets like a champ

Multi-database work, daily queries

TablePlus

maybe 4 minutes

~200MB

Excellent

Fast, doesn't hate you

macOS/Windows GUI work

phpMyAdmin

12-ish minutes

under 200MB

Good

Limited by PHP but tries

Web-based access

Command Line (mysql)

under a minute

~50MB

Excellent

Instant (as it should be)

Scripting, automation, bulk ops

Beekeeper Studio

2-4 minutes

200-400MB

Good

Good performance

Modern GUI alternative

Performance Troubleshooting Resources and Alternative Tools

Related Tools & Recommendations

tool
Similar content

MySQL Workbench Overview: Oracle's GUI, Features & Flaws

Free MySQL desktop app that tries to do everything and mostly succeeds at pissing you off

MySQL Workbench
/tool/mysql-workbench/overview
100%
troubleshoot
Similar content

Fix MySQL Error 1045 Access Denied: Solutions & Troubleshooting

Stop fucking around with generic fixes - these authentication solutions are tested on thousands of production systems

MySQL
/troubleshoot/mysql-error-1045-access-denied/authentication-error-solutions
98%
integration
Similar content

Laravel MySQL Performance Optimization Guide: Fix Slow Apps

Stop letting database performance kill your Laravel app - here's how to actually fix it

MySQL
/integration/mysql-laravel/overview
92%
tool
Similar content

MariaDB: The Open Source MySQL Alternative & Enterprise Guide

MySQL without Oracle's bullshit licensing

MariaDB
/tool/mariadb/overview
90%
compare
Similar content

PostgreSQL vs MySQL vs MariaDB vs SQLite vs CockroachDB

Compare PostgreSQL, MySQL, MariaDB, SQLite, and CockroachDB to pick the best database for your project. Understand performance, features, and team skill conside

/compare/postgresql-mysql-mariadb-sqlite-cockroachdb/database-decision-guide
82%
compare
Similar content

PostgreSQL vs MySQL vs MariaDB: Developer Ecosystem Analysis

PostgreSQL, MySQL, or MariaDB: Choose Your Database Nightmare Wisely

PostgreSQL
/compare/postgresql/mysql/mariadb/developer-ecosystem-analysis
80%
tool
Similar content

PostgreSQL Performance Optimization: Master Tuning & Monitoring

Optimize PostgreSQL performance with expert tips on memory configuration, query tuning, index design, and production monitoring. Prevent outages and speed up yo

PostgreSQL
/tool/postgresql/performance-optimization
65%
tool
Similar content

Apache Cassandra Performance Optimization Guide: Fix Slow Clusters

Stop Pretending Your 50 Ops/Sec Cluster is "Scalable"

Apache Cassandra
/tool/apache-cassandra/performance-optimization-guide
65%
tool
Similar content

ClickHouse Overview: Analytics Database Performance & SQL Guide

When your PostgreSQL queries take forever and you're tired of waiting

ClickHouse
/tool/clickhouse/overview
62%
tool
Similar content

PostgreSQL: Why It Excels & Production Troubleshooting Guide

Explore PostgreSQL's advantages over other databases, dive into real-world production horror stories, solutions for common issues, and expert debugging tips.

PostgreSQL
/tool/postgresql/overview
62%
tool
Similar content

Redis Cluster Production Issues: Troubleshooting & Survival Guide

When Redis clustering goes sideways at 3AM and your boss is calling. The essential troubleshooting guide for split-brain scenarios, slot migration failures, and

Redis
/tool/redis/clustering-production-issues
59%
tool
Similar content

Cassandra Vector Search for RAG: Simplify AI Apps with 5.0

Learn how Apache Cassandra 5.0's integrated vector search simplifies RAG applications. Build AI apps efficiently, overcome common issues like timeouts and slow

Apache Cassandra
/tool/apache-cassandra/vector-search-ai-guide
58%
tool
Similar content

MySQL Overview: Why It's Still the Go-To Database

Explore MySQL's enduring popularity, real-world performance, and vast ecosystem. Understand why this robust database remains a top choice for developers worldwi

MySQL
/tool/mysql/overview
56%
tool
Similar content

CDC Database Platform Guide: PostgreSQL, MySQL, MongoDB Setup

Stop wasting weeks debugging database-specific CDC setups that the vendor docs completely fuck up

Change Data Capture (CDC)
/tool/change-data-capture/database-platform-implementations
53%
tool
Similar content

pgLoader Overview: Migrate MySQL, Oracle, MSSQL to PostgreSQL

Move your MySQL, SQLite, Oracle, or MSSQL database to PostgreSQL without writing custom scripts that break in production at 2 AM

pgLoader
/tool/pgloader/overview
52%
tool
Similar content

Redis Overview: In-Memory Database, Caching & Getting Started

The world's fastest in-memory database, providing cloud and on-premises solutions for caching, vector search, and NoSQL databases that seamlessly fit into any t

Redis
/tool/redis/overview
52%
tool
Similar content

SQLite: Zero Configuration SQL Database Overview & Use Cases

Zero Configuration, Actually Works

SQLite
/tool/sqlite/overview
52%
tool
Similar content

Neon Production Troubleshooting Guide: Fix Database Errors

When your serverless PostgreSQL breaks at 2AM - fixes that actually work

Neon
/tool/neon/production-troubleshooting
50%
tool
Similar content

Prisma ORM: TypeScript Client, Setup Guide, & Troubleshooting

Database ORM that generates types from your schema so you can't accidentally query fields that don't exist

Prisma
/tool/prisma/overview
50%
howto
Similar content

Zero Downtime Database Migration: 2025 Tools That Actually Work

Stop Breaking Production - New Tools That Don't Suck

AWS Database Migration Service (DMS)
/howto/database-migration-zero-downtime/modern-tools-2025
47%

Recommendations combine user behavior, content similarity, research intelligence, and SEO optimization