Why This Stack Exists (And Why You'll Hate It)

Look, microservices networking is a nightmare. I've spent way too many weekends debugging container-to-container communication issues, watching services randomly fail to find each other, and cursing at load balancers that decide to route 100% of traffic to the one pod that's about to die.

This Docker + Kubernetes + Istio stack helps solve these problems, but it also creates entirely new ways for your infrastructure to fail spectacularly. The promise is simple: reliable networking, automatic security, and deep observability without touching your application code. The reality is a complex distributed system that requires expertise in container orchestration, proxy configuration, and certificate management.

But here's the thing - when it works, it actually delivers on those promises. The question is whether you're prepared for the operational complexity that comes with it.

The Architecture That Actually Matters

Istio Service Mesh Architecture

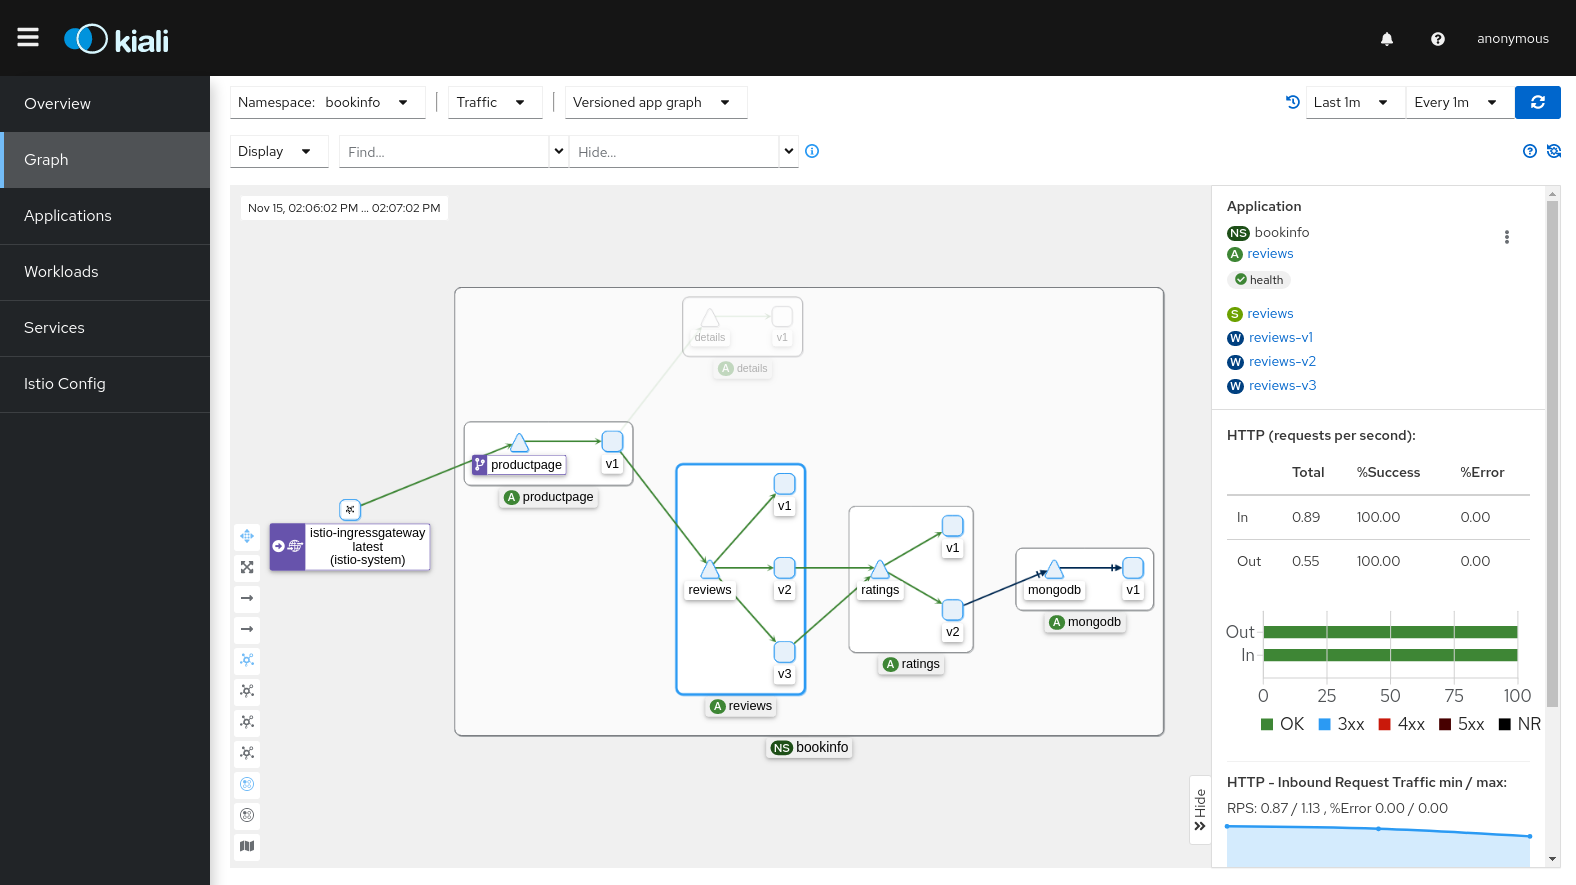
Envoy Proxies Everywhere: Istio shoves an Envoy proxy into every single pod as a sidecar container. These proxies intercept ALL network traffic - which sounds great until you realize they also eat CPU, add latency, and crash silently leaving you with zero useful logs.

Envoy Proxy Logo

Each sidecar uses about 100MB RAM and burns through CPU cycles like cryptocurrency mining. Multiply that by your pod count and watch your AWS bill explode.

The Control Plane That Controls Everything: Istiod is the brain that tells all those proxies what to do. When it works, it's magic. When it breaks (and it will break), every service in your mesh stops talking to each other simultaneously. I learned this at 2 AM during Black Friday.

What This Stack Actually Fixes

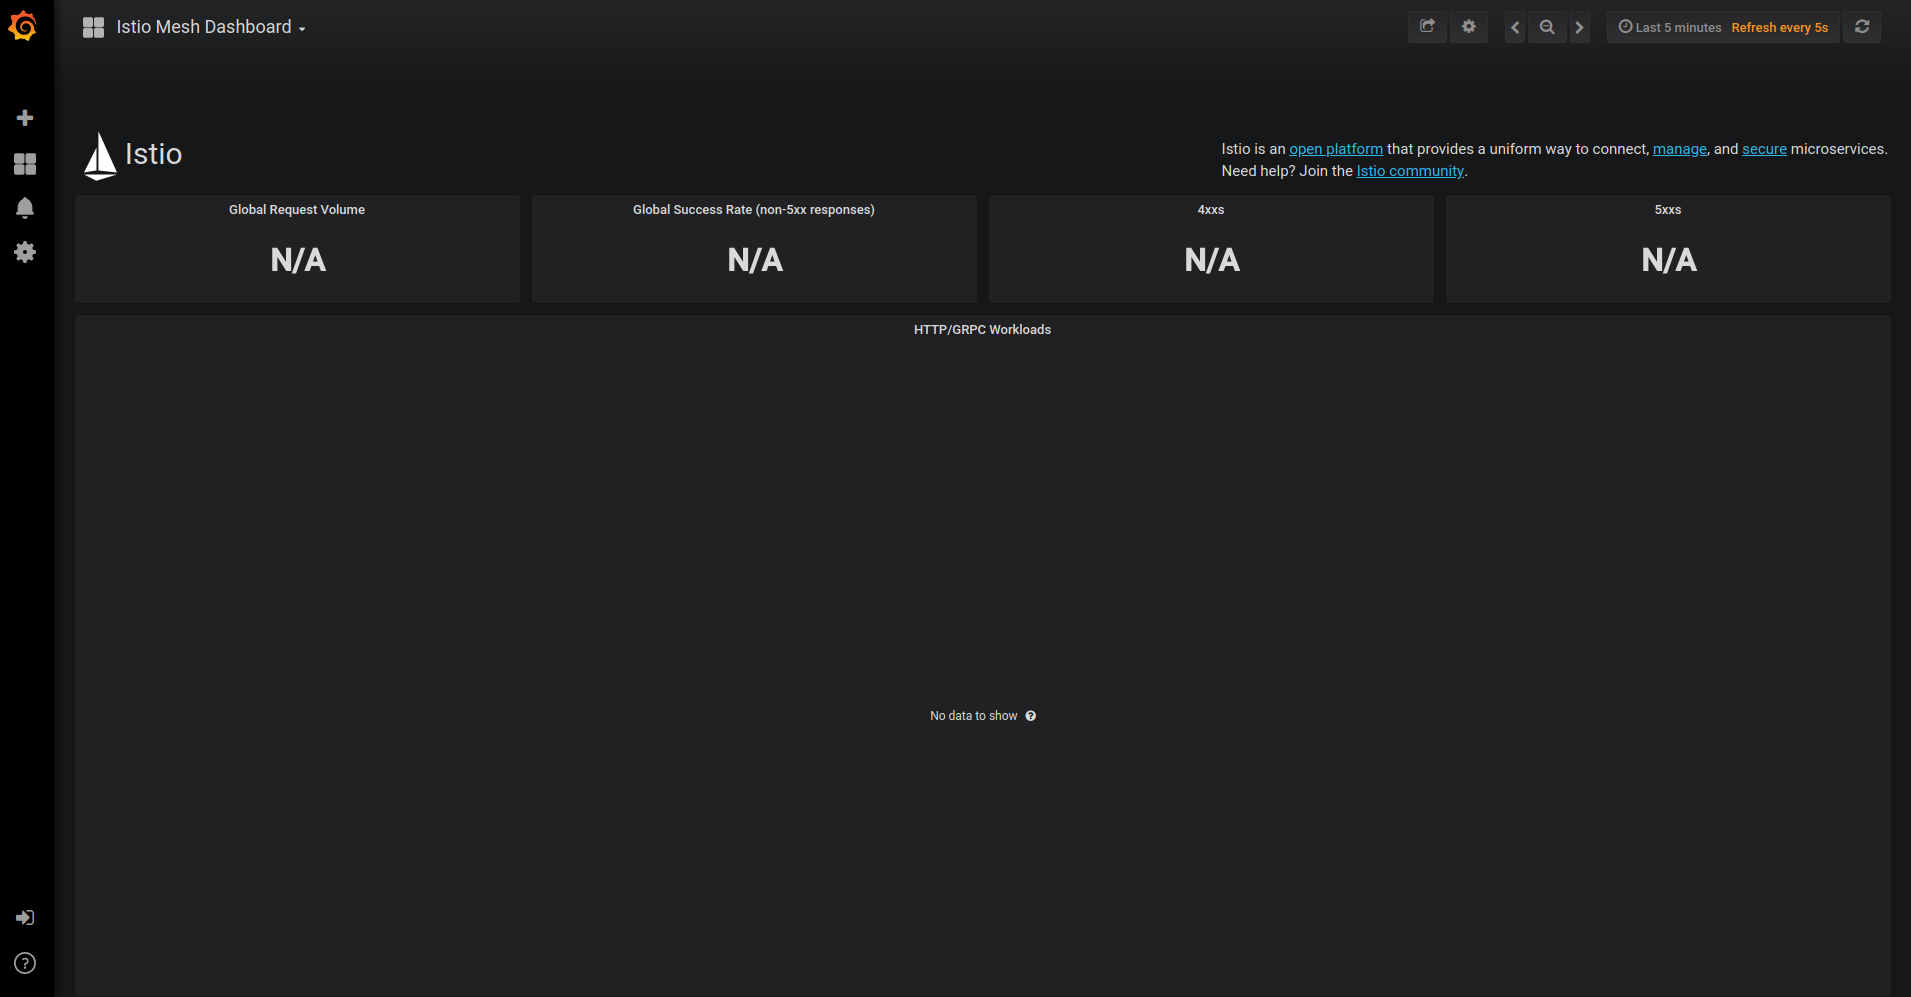
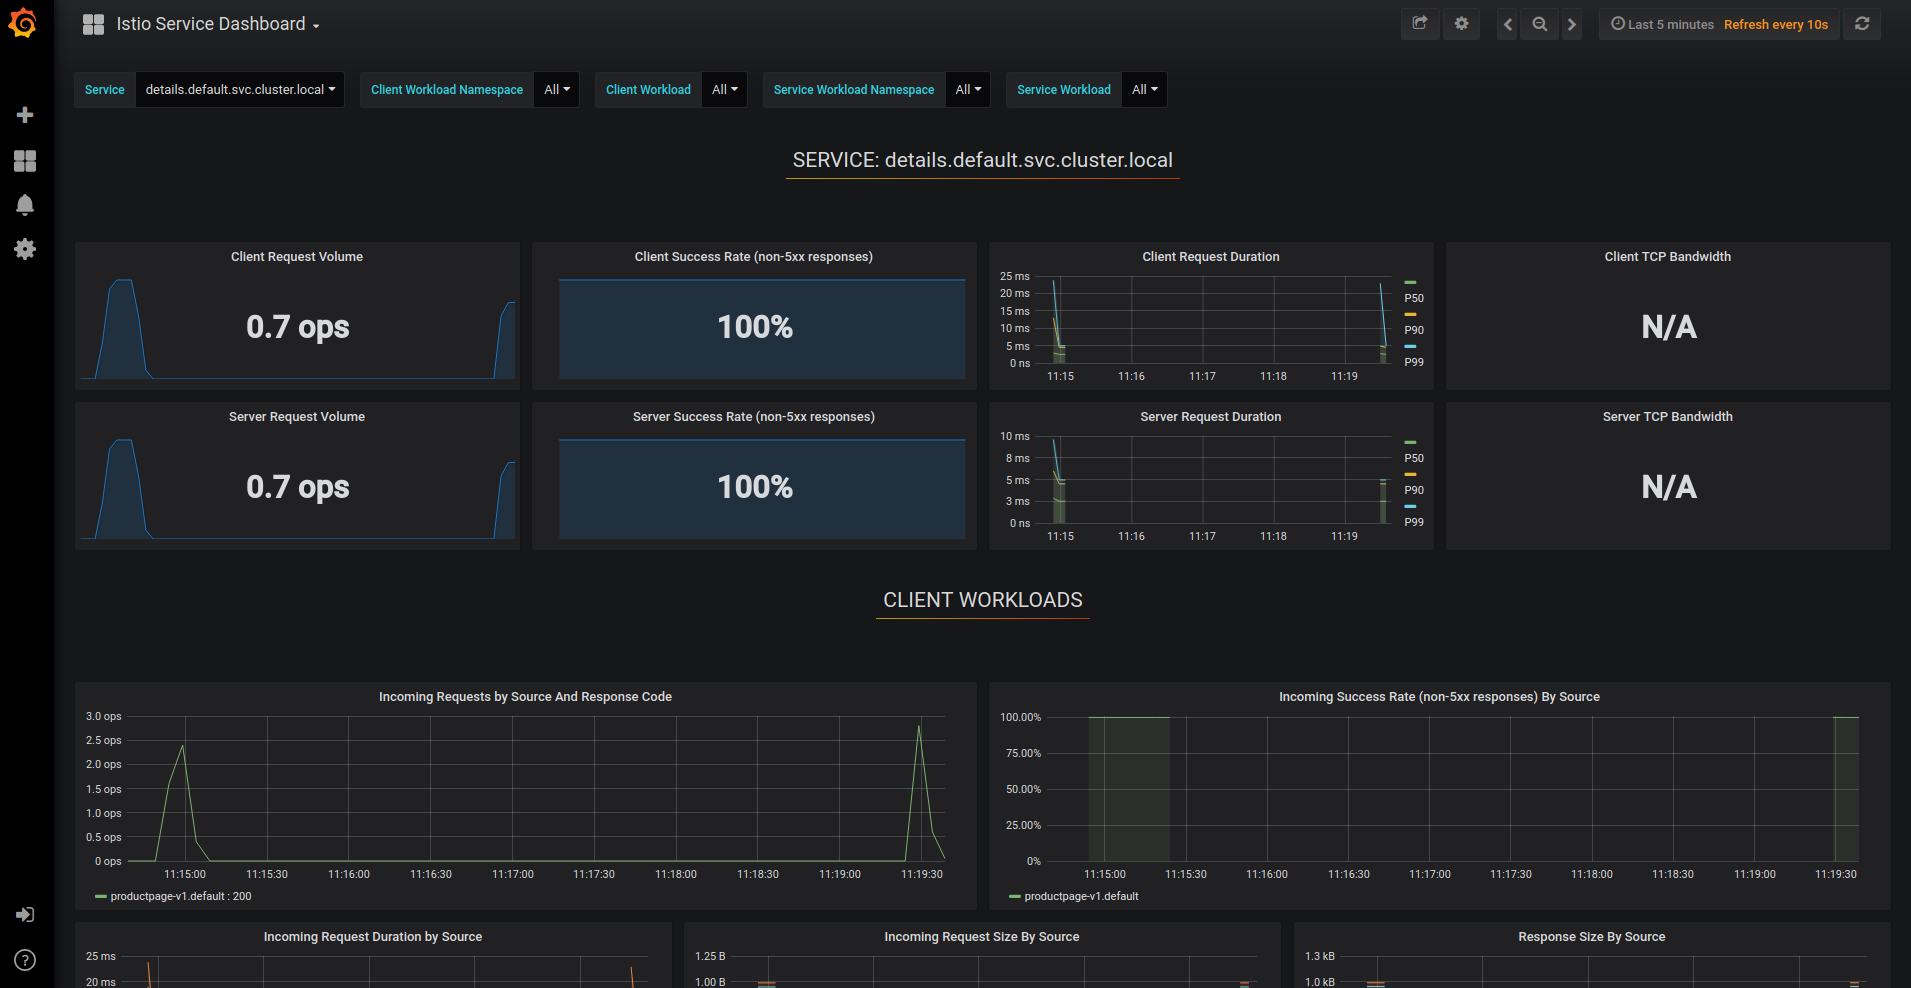
Observability Without Code Changes: This is legitimately awesome. Install Istio and suddenly you have RED metrics (request rate, error rate, duration) for every service without touching your application code. No more arguing with product managers about adding monitoring endpoints.

The catch? The metrics are only as good as your understanding of Envoy's configuration model, which is approximately as intuitive as quantum physics. You'll spend hours learning about clusters, listeners, and filter chains.

Security That Actually Works: Automatic mTLS between services is brilliant. Your services encrypt all communication without you writing a single line of TLS code. Certificate rotation happens automatically through Istio's PKI system.

Until it doesn't. Certificate rotation failures are silent killers - everything looks fine until services start rejecting each other's certificates and your entire mesh goes down. The SPIFFE specification that Istio uses is solid, but debugging certificate chain issues requires deep knowledge of X.509 certificates.

Traffic Splitting for Sane Deployments: Canary deployments with Istio actually work. You can route 5% of traffic to your new version while watching metrics, then gradually increase if everything looks good. The VirtualService and DestinationRule configurations give you fine-grained control.

This is the killer feature that makes the pain worth it. No more YOLO deployments to production. You can implement blue-green deployments, ring deployments, and feature flags at the infrastructure level.

Version Reality Check (September 2025)

Istio 1.27.1: Latest as of September 2025 and mostly stable. Supports Kubernetes 1.29-1.33. The 1.26.4 patch fixed the memory leaks that killed our staging cluster, but stick with 1.27+ anyway.

Kubernetes Compatibility: Stick with 1.30 or 1.31 if you value your sanity. The 1.29 release has some weird CNI interactions with Istio that cause random pod networking failures.

Resource Requirements: You need at least 16GB RAM and 8 CPU cores for even a tiny development cluster. The control plane alone uses more resources than most applications. Plan accordingly or watch your nodes get OOMKilled.

The Gotchas Nobody Warns You About

Ambient Mesh Reached GA: Ambient mesh officially went GA in Istio 1.24 (November 2024), but that doesn't mean it's ready for your production workload. The resource reduction is real, but debugging ambient mode failures still feels like reading tea leaves.

Sidecar Injection Breaking Existing Apps: Some legacy applications do weird networking things that break when you inject a proxy. Always test in staging first, and have a rollback plan that doesn't require DNS propagation.

Control Plane Single Point of Failure: Despite claims of "high availability," I've seen entire meshes go down when the control plane loses connection to etcd. Monitor control plane health obsessively.

The bottom line? This stack represents the current state of the art for microservices infrastructure, but it's not simple. You're trading application-level networking complexity for infrastructure-level complexity. Whether that trade-off makes sense depends on your team's expertise, operational maturity, and tolerance for debugging distributed systems at 3 AM.

If you're running 5 services, stick with basic Kubernetes networking. If you're running 50+ microservices with complex traffic patterns, security requirements, and observability needs, this pain might be worth it.

How to Actually Deploy This (Without Losing Your Mind)

I've deployed this stack enough times to know that every implementation will find new and creative ways to break.

Here's how to do it without spending months debugging YAML files and proxy configurations.

The key insight after multiple failed deployments: this isn't just about installing software.

You're fundamentally changing how your applications communicate, adding multiple layers of abstraction, and introducing new failure modes. Success requires methodical progression through each layer, validating everything works before adding the next piece.

The Three Phases of Pain

Phase 1: Get Docker Right First
Don't rush into Kubernetes until your containers actually work.

I've seen teams struggle with Istio when their real problem was Docker networking being weird.

Fix your container images first

This phase will take 3x longer than you think because Docker networking is unintuitive and every corporate firewall breaks something different. Make sure your health checks work and your image layers are optimized.

**Phase 2:

Kubernetes Without Istio**
Deploy to Kubernetes and make sure everything works WITHOUT a service mesh first. Set resource limits that actually make sense

  • not the cargo-cult "500m CPU, 1Gi RAM" that everyone copies from tutorials.

Use Vertical Pod Autoscaler to get real resource usage data.

Get readiness and liveness probes working properly.

If your app can't tell Kubernetes when it's healthy, adding Istio will just make the failures more spectacular. Configure pod disruption budgets and horizontal pod autoscaling before adding service mesh complexity.

**Phase 3:

Istio Integration Hell**
Start with namespace injection on a non-critical service.

Watch it break in ways the documentation doesn't mention. Spend a weekend figuring out why the sidecar can't talk to the control plane.

Use istioctl install with the demo profile initially, then migrate to production profiles.

Monitor the control plane metrics and watch for proxy synchronization failures.

Deployment Patterns That Actually Work

Sidecar Pattern:

This is the default and it works, but it's expensive. Each Envoy proxy eats ~100MB RAM and burns CPU. The official docs claim 10-15% overhead but in reality it's more like 20-30% if you count the control plane.

Ambient Mesh:

Don't use this in production yet. I tried it in staging and pods randomly lost connectivity when nodes got busy. Maybe in 2026 when it's not beta software.

The Configuration That Breaks Everything

Kubernetes Networking Architecture

Here's a basic gateway config that might work:

apiVersion: networking.istio.io/v1beta1
kind:

 Gateway
metadata:
  name: production-gateway
  namespace: istio-system
spec:
  selector:
    istio: ingressgateway
  servers:

- port:
      number: 443
      name: https
      protocol:

 HTTPS
    tls:
      mode:

 SIMPLE
      credentialName: tls-secret
    hosts:

- "*.yourdomain.com"

This YAML looks simple but will break if:

  • Your TLS secret is in the wrong namespace
  • The ingress gateway pods can't read the secret
  • Your DNS doesn't match the hosts exactly
  • The certificate chain is incomplete

Expect to spend hours debugging why HTTPS doesn't work even though the configuration looks correct.

Security That Might Actually Help

Automatic mTLS:

This is genuinely useful once it works. Istio handles certificates automatically, which means one less thing to screw up.

The gotcha? Certificate rotation can fail silently. Set up monitoring for cert expiration or you'll discover the problem when everything stops working at 3 AM.

Authorization Policies: Fine-grained access control is powerful but the YAML gets complex fast.

Start simple

  • allow everything first, then gradually lock it down.

Observability That Actually Helps Debug

Kiali Service Graph Overview

Metrics: RED metrics are the killer feature.

Request rate, error rate, and duration for every service without code changes. Connect it to Prometheus and Grafana for dashboards that actually show what's broken.

Grafana Istio Dashboard

Istio Service Dashboard

Distributed Tracing: Jaeger integration is useful for finding slow requests across services.

The setup is annoying but the visibility is worth it when debugging performance issues.

Logs: Envoy access logs are verbose and mostly useless, but occasionally contain the one clue you need.

Configure structured logging if you want any hope of parsing them during incidents.

Performance Tuning That Matters

Resource Limits:

Don't use the default sidecar resource limits. High-traffic services need custom limits or they'll get throttled.

Start with 200m CPU and 256Mi RAM per sidecar, then tune based on actual usage.

Connection Pooling: Destination rules let you configure circuit breakers and connection limits.

This prevents one slow service from killing everything else, but get the timeouts wrong and you'll create more problems.

The Debugging Commands That Actually Work

When things break (not if, when), these commands might help:

## Check if sidecars are getting configuration
istioctl proxy-status

## See what's actually configured in Envoy
istioctl proxy-config cluster <pod-name>

## Validate your configuration before applying
istioctl analyze

## Get sidecar logs when everything is on fire
kubectl logs <pod-name> -c istio-proxy

The most common issue?

The control plane lost connection to a sidecar and your service is routing traffic into the void. Always check proxy status first.

The Reality of Production Operations

After deployment comes the hard part: keeping it running. This stack transforms your monitoring and incident response procedures. You're no longer debugging application issues in isolation

  • every problem could be at the application layer, Kubernetes layer, or Istio layer.

Successful teams treat this as infrastructure code with the same discipline as application code. Infrastructure as code, comprehensive monitoring, automated rollback procedures, and deep operational knowledge become non-negotiable requirements.

The teams that struggle are those who treat Istio as "install and forget" infrastructure. This is active, complex software that requires dedicated operational expertise. Budget for training, monitoring tools, and the inevitable late-night debugging sessions during your first six months.

What Actually Breaks in Production

Pattern

Actual Resource Cost

What Breaks First

Hidden Gotchas

Weekend Debugbing Level

Sidecar Mesh

20-40% per pod + control plane

Envoy proxy OOMs

Certificate rotation fails silently

Very High

Ambient Mesh

Sounds great, breaks randomly

Node proxies crash under load

Beta software, no production support

Extremely High

Gateway Only

Low until traffic spikes

Gateway pods get overwhelmed

No service-to-service encryption

Medium

Questions Nobody Wants to Ask (But Should)

Q

Why does my cluster keep running out of memory after installing Istio?

A

Because every pod now has an Envoy sidecar eating 100-200MB RAM, plus the control plane using 4-8GB. The "10-15% overhead" in the docs is bullshit

  • it's more like 40% when you count everything. I learned this when our 16GB dev cluster started OOMKilling pods left and right.Check your actual resource usage with kubectl top nodes and resize accordingly. You'll need at least double your original cluster size.
Q

How do I debug when the sidecar proxy just stops working?

A

This happens more often than anyone admits. The Envoy proxy loses connection to the control plane, but your pod stays running so monitoring doesn't catch it. Traffic routes into the void and you get mysterious 503 errors.Start with istioctl proxy-status

  • any red status means that pod is broken. Then check kubectl logs pod-name -c istio-proxy for connection errors. Usually it's a network policy blocking traffic to the control plane or certificate expiration.
Q

Why does the control plane randomly lose connection to half the pods?

A

Usually happens during high CPU load or when etcd gets overwhelmed. The control plane can't push configuration updates to sidecars, so they keep using stale routing rules. I've seen this take down entire production environments.Monitor istiod memory and CPU usage. Set up alerts for proxy synchronization failures. The nuclear option is restarting the control plane, but that causes a brief service mesh outage.

Q

Can I actually run this on a 3-node cluster without going broke?

A

Not really. You need minimum 8 cores and 32GB RAM total just for the control plane and sidecars. I tried running Istio on a 3-node cluster with 4GB RAM each

  • it was unusable. Every deployment caused OOM kills.Either upgrade your cluster or stick with basic Kubernetes networking. "Lightweight" service mesh is an oxymoron.
Q

What happens when certificate rotation fails silently?

A

Everything breaks simultaneously and the logs tell you nothing useful. Services start rejecting each other's certificates, but the errors look like generic network failures. I spent 6 hours debugging this once before realizing it was cert rotation.Set up monitoring for certificate expiration dates. Watch for spikes in mTLS handshake failures. When it happens, restarting the control plane usually fixes it, but you'll have a brief outage.

Q

Why does ambient mesh randomly drop connections under load?

A

Because it's beta software that shouldn't be used in production yet. The shared node proxies get overwhelmed when traffic spikes and start dropping connections. I tested it in staging and pods randomly lost connectivity when nodes got busy.Stick with sidecar mesh until ambient is actually stable. The resource savings aren't worth the random failures.

Q

How do I troubleshoot "upstream connect error or disconnect/reset before headers"?

A

This is Envoy's way of saying "something's fucked but I won't tell you what." Usually means the destination service is unreachable, but could be DNS issues, certificate problems, or network policies blocking traffic.Check service discovery first: istioctl proxy-config cluster pod-name. If the upstream cluster is missing or has no healthy endpoints, that's your problem. Otherwise dig into network policies and DNS resolution.

Q

Why does istioctl analyze say everything is fine but traffic still doesn't work?

A

Because istioctl analyze only checks for obvious YAML errors, not actual runtime behavior. Your configuration can be syntactically correct but still route traffic to nonexistent services or apply conflicting policies.Use istioctl proxy-config commands to see what's actually configured in Envoy. Compare with your intended routing rules

  • they often don't match.
Q

How do I prevent Istio upgrades from breaking everything?

A

Test upgrades in staging first, obviously, but also read the breaking changes carefully. Minor version upgrades can change default behavior or deprecate features you're using. I've seen 1.25 to 1.26 upgrades break custom gateways because of API changes.Use canary control plane upgrades and test thoroughly before upgrading data plane proxies. Keep rollback procedures ready because you'll need them.

Q

What's the fastest way to completely remove Istio when everything goes to hell?

A

Sometimes you just need to nuke it and start over. Remove namespace labels first to stop sidecar injection:bashkubectl label namespace default istio-injection-Then uninstall the control plane:bashistioctl x uninstall --purgekubectl delete namespace istio-systemClean up leftover resources manually. You'll probably need to restart some pods to remove stale sidecars.

Q

Why do my CI/CD pipelines take forever after adding Istio?

A

Because every pod now takes 30-60 seconds to start while the sidecar proxy initializes and connects to the control plane. Your fast deployment pipeline just became painfully slow.You can configure sidecar resource limits and startup probes to speed this up, but there's no magic fix. Factor the additional startup time into your deployment windows.

Resources That Actually Help When Everything's Breaking

Related Tools & Recommendations

howto
Similar content

Set Up Microservices Observability: Prometheus & Grafana Guide

Stop flying blind - get real visibility into what's breaking your distributed services

Prometheus
/howto/setup-microservices-observability-prometheus-jaeger-grafana/complete-observability-setup
100%
tool
Similar content

containerd - The Container Runtime That Actually Just Works

The boring container runtime that Kubernetes uses instead of Docker (and you probably don't need to care about it)

containerd
/tool/containerd/overview
59%
integration
Recommended

OpenTelemetry + Jaeger + Grafana on Kubernetes - The Stack That Actually Works

Stop flying blind in production microservices

OpenTelemetry
/integration/opentelemetry-jaeger-grafana-kubernetes/complete-observability-stack
54%
integration
Recommended

Falco + Prometheus + Grafana: The Only Security Stack That Doesn't Suck

Tired of burning $50k/month on security vendors that miss everything important? This combo actually catches the shit that matters.

Falco
/integration/falco-prometheus-grafana-security-monitoring/security-monitoring-integration
46%
tool
Similar content

Rancher Desktop: The Free Docker Desktop Alternative That Works

Discover why Rancher Desktop is a powerful, free alternative to Docker Desktop. Learn its features, installation process, and solutions for common issues on mac

Rancher Desktop
/tool/rancher-desktop/overview
44%
tool
Similar content

Helm: Simplify Kubernetes Deployments & Avoid YAML Chaos

Package manager for Kubernetes that saves you from copy-pasting deployment configs like a savage. Helm charts beat maintaining separate YAML files for every dam

Helm
/tool/helm/overview
38%
tool
Similar content

CNI Debugging Guide: Resolve Kubernetes Network Issues Fast

You're paged because pods can't talk. Here's your survival guide for CNI emergencies.

Container Network Interface
/tool/cni/production-debugging
33%
integration
Similar content

GitOps Integration: Docker, Kubernetes, Argo CD, Prometheus Setup

How to Wire Together the Modern DevOps Stack Without Losing Your Sanity

/integration/docker-kubernetes-argocd-prometheus/gitops-workflow-integration
30%
tool
Similar content

Debug Kubernetes Issues: The 3AM Production Survival Guide

When your pods are crashing, services aren't accessible, and your pager won't stop buzzing - here's how to actually fix it

Kubernetes
/tool/kubernetes/debugging-kubernetes-issues
29%
tool
Recommended

Podman Desktop - Free Docker Desktop Alternative

competes with Podman Desktop

Podman Desktop
/tool/podman-desktop/overview
26%
tool
Recommended

Node Exporter Advanced Configuration - Stop It From Killing Your Server

The configuration that actually works in production (not the bullshit from the docs)

Prometheus Node Exporter
/tool/prometheus-node-exporter/advanced-configuration
26%
news
Recommended

Google Avoids $2.5 Trillion Breakup in Landmark Antitrust Victory

Federal judge rejects Chrome browser sale but bans exclusive search deals in major Big Tech ruling

OpenAI/ChatGPT
/news/2025-09-05/google-antitrust-victory
26%
integration
Recommended

Escape Istio Hell: How to Migrate to Linkerd Without Destroying Production

Stop feeding the Istio monster - here's how to escape to Linkerd without destroying everything

Istio
/integration/istio-linkerd/migration-strategy
25%
tool
Similar content

ArgoCD Production Troubleshooting: Debugging & Fixing Deployments

The real-world guide to debugging ArgoCD when your deployments are on fire and your pager won't stop buzzing

Argo CD
/tool/argocd/production-troubleshooting
24%
alternatives
Recommended

GitHub Actions Alternatives That Don't Suck

integrates with GitHub Actions

GitHub Actions
/alternatives/github-actions/use-case-driven-selection
24%
alternatives
Recommended

GitHub Actions is Fine for Open Source Projects, But Try Explaining to an Auditor Why Your CI/CD Platform Was Built for Hobby Projects

integrates with GitHub Actions

GitHub Actions
/alternatives/github-actions/enterprise-governance-alternatives
24%
alternatives
Recommended

Tired of GitHub Actions Eating Your Budget? Here's Where Teams Are Actually Going

integrates with GitHub Actions

GitHub Actions
/alternatives/github-actions/migration-ready-alternatives
24%
integration
Recommended

Temporal + Kubernetes + Redis: The Only Microservices Stack That Doesn't Hate You

Stop debugging distributed transactions at 3am like some kind of digital masochist

Temporal
/integration/temporal-kubernetes-redis-microservices/microservices-communication-architecture
22%
troubleshoot
Recommended

Fix Kubernetes ImagePullBackOff Error - The Complete Battle-Tested Guide

From "Pod stuck in ImagePullBackOff" to "Problem solved in 90 seconds"

Kubernetes
/troubleshoot/kubernetes-imagepullbackoff/comprehensive-troubleshooting-guide
22%
troubleshoot
Similar content

Debug Kubernetes AI GPU Failures: Pods Stuck Pending & OOM

Debugging workflows for when Kubernetes decides your AI workload doesn't deserve those GPUs. Based on 3am production incidents where everything was on fire.

Kubernetes
/troubleshoot/kubernetes-ai-workload-deployment-issues/ai-workload-gpu-resource-failures
22%

Recommendations combine user behavior, content similarity, research intelligence, and SEO optimization