What Actually Breaks in Production

Node.js Logo

Node.js 22 became LTS on October 29, 2024. The V8 garbage collection improvements are nice, but they won't fix your shitty event listener cleanup or that database connection pool you're not closing properly.

The Real Failures You'll Hit

Spent the last 3 years debugging production Node.js apps. Here's what actually kills your uptime:

Event listeners that stack up like dirty dishes - Every WebSocket connection, every EventEmitter, every database pool event. You forget one `removeListener()` call and after a week your process is consuming 4GB RAM. I learned this when our chat app started eating memory after users would disconnect without closing properly.

Blocking the event loop like a jackass - One `fs.readFileSync()` in a hot path and your entire API stops responding. CPU hits 100% but nothing happens. Took me 8 hours to track down a single synchronous file read that was freezing 500 concurrent users. Use the goddamn async versions.

Unhandled promise rejections - Node 15+ will crash your process when promises reject without `.catch()`. One missing error handler in a database query chain and boom, your app exits with code 1 at peak traffic. Always add .catch() or wrap in try/catch with async/await.

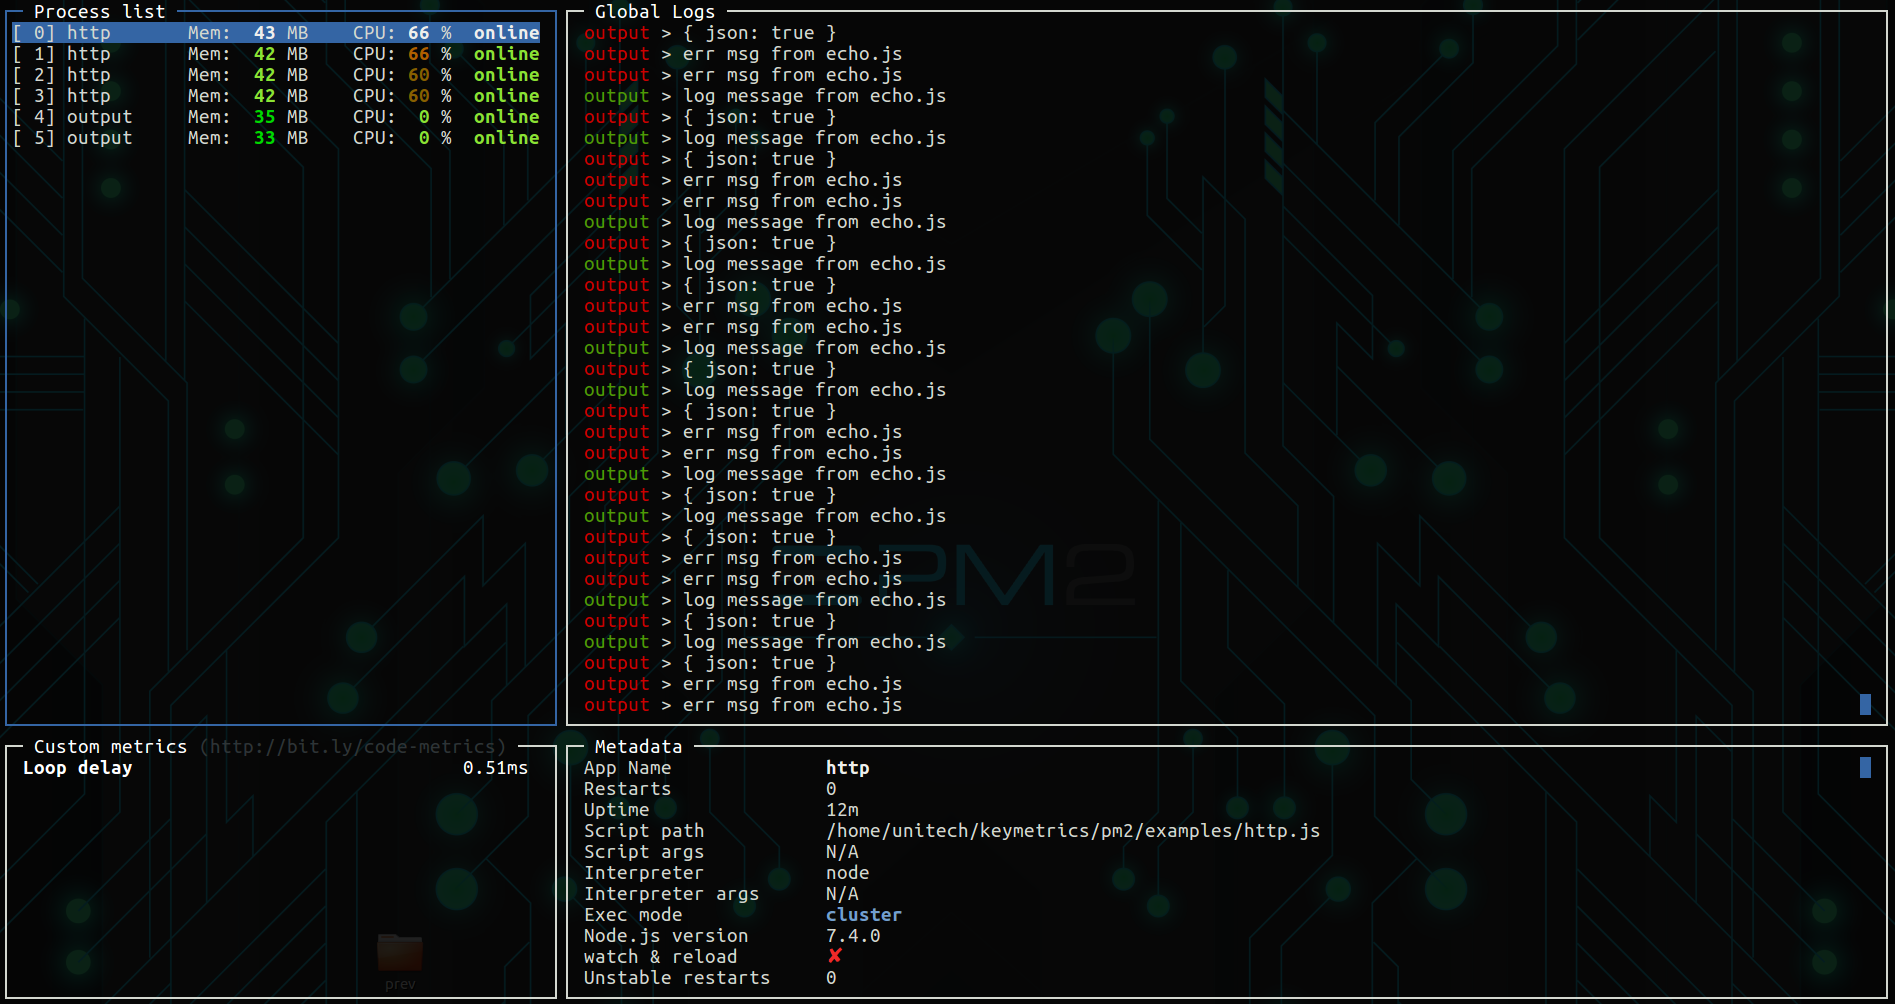
Running node app.js without a process manager - Your app will crash. Not if, when. I watched a startup lose $50k in revenue because their payment API went down for 6 hours and nobody knew. Use PM2, Forever, or Docker with restart policies to restart processes automatically.

Version-Specific Gotchas

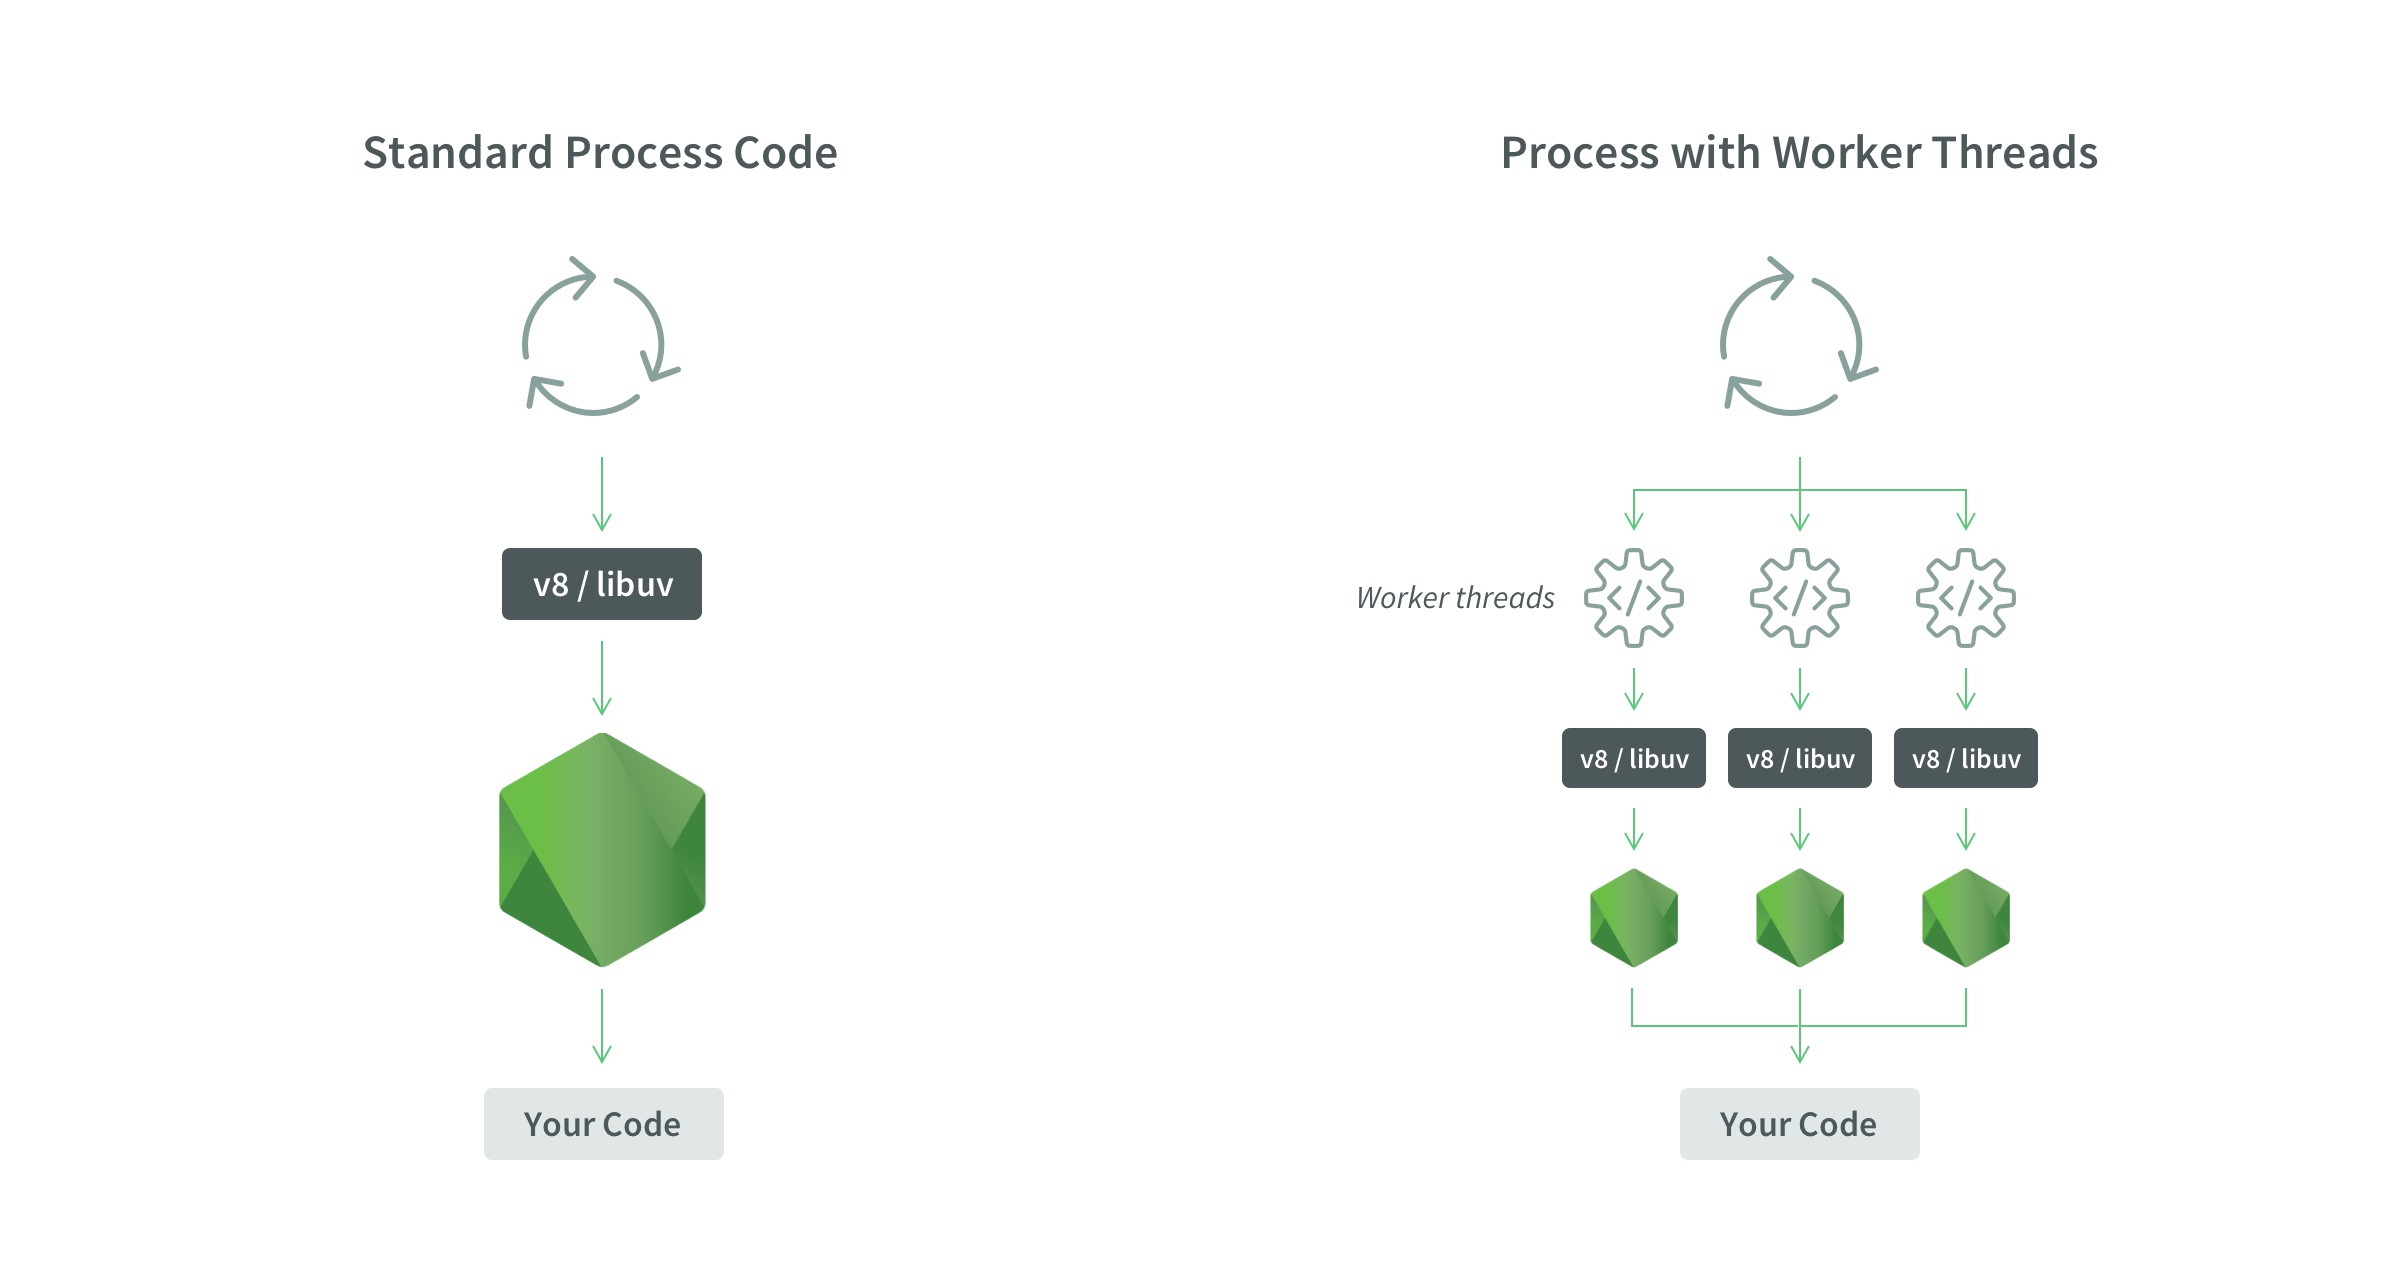
Node.js 18.0.0 had a memory leak in worker threads - Use 18.1.0 or later if you're using Workers. Found this the hard way when our background job processor started consuming 8GB RAM after 3 days.

Node.js 16.9.0 broke some crypto functions - If you're using legacy crypto code, test thoroughly before upgrading. Spent a weekend rolling back when our authentication stopped working.

The Money Reality

Look, that $301k/hour downtime number everyone quotes? Complete bullshit, but outages hurt. Our 2-hour outage in March cost us around 12 grand in lost sales plus whatever AWS charged us for the traffic backup - I think it was like 3k or something. A single memory leak ran up $800 in extra EC2 costs before we caught it.

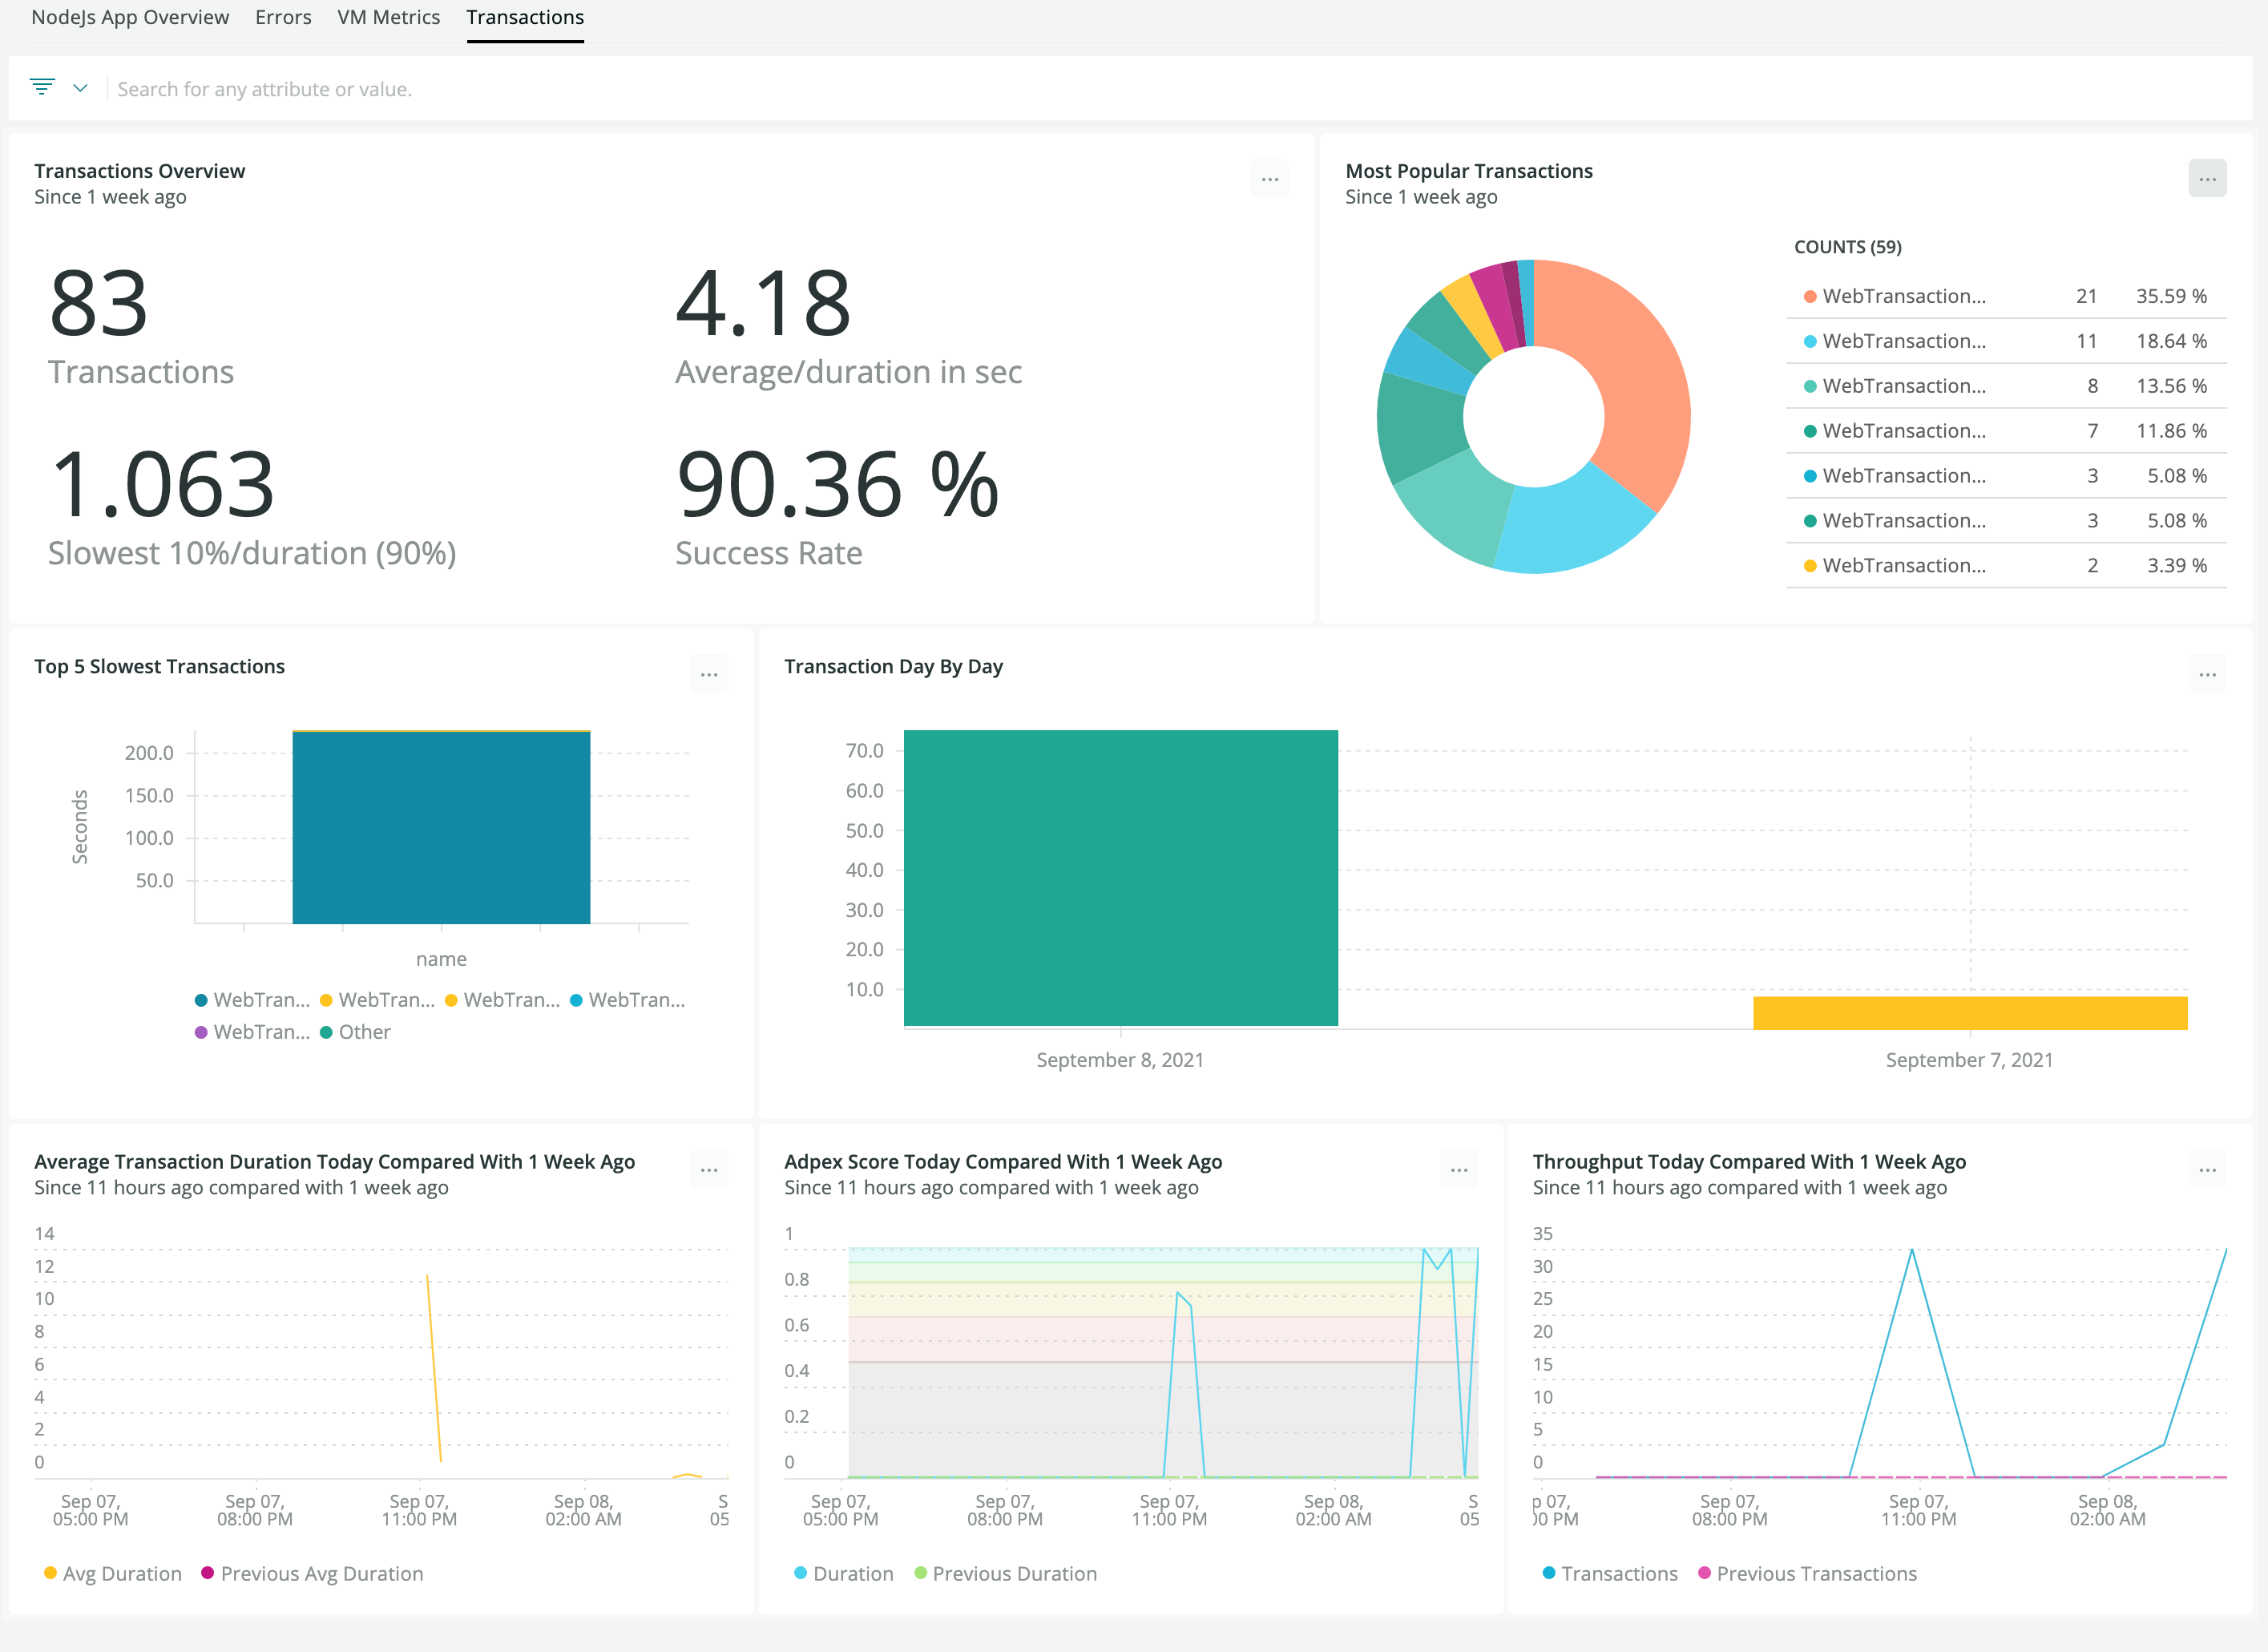
One client's Node.js app was leaking 50MB per hour. Over 6 months, that extra memory usage cost them $2,400 in unnecessary cloud resources. Fixed it by adding proper connection pool cleanup - took 10 lines of code. Tools like Clinic.js and 0x help identify these memory leaks before they kill your budget.

Process Managers That Don't Suck

Tool

Category

Key Features / Pros

Cons / Gotchas

Cost / Pricing

Best Use Case

PM2

Process Manager

Works out of the box, handles clustering, restarts when shit breaks. Memory monitoring actually works. Been using it for 4 years across dozens of deployments

  • it just works.

Clustering sometimes gets weird on Windows. Gotcha: The instances: 'max' setting sounds smart but will kill performance if your app is CPU-intensive. Start with half your cores and monitor.

Free (Open Source)

General Node.js deployments, reliable restarts, built-in monitoring.

Forever

Process Manager

Don't use this. It doesn't restart properly when processes actually die (vs exit), has no monitoring, and the maintainer abandoned it. I've seen it fail to restart crashed processes 3 times. Just use PM2.

Free (Open Source)

Avoid. Use PM2.

SystemD

Process Manager (OS-level)

Works fine once configured. Good if you're already deep in Linux ops.

If you enjoy writing service files and debugging why your Node app won't start at boot, knock yourself out. Works fine once configured but takes 3 times longer to set up than PM2.

Free (Built-in Linux)

Linux operations teams, integrating with existing system services.

Kubernetes

Container Orchestration

If you're running 20+ services and have a dedicated DevOps team, sure.

Otherwise you're adding weeks of complexity to solve problems you don't have. Kubernetes networking alone will eat your weekend. Reality check: Watched a 5-person startup waste 2 months trying to "do it right" with K8s. They finally deployed with PM2 and haven't had issues since.

High (infrastructure + operational overhead)

Large-scale deployments (20+ services), dedicated DevOps teams.

New Relic

Monitoring

Catches issues before users complain. Worth it if you're getting paged regularly.

$200+/month for a decent setup but it. The Node.js agent occasionally breaks with major version updates.

$200+/month

Teams getting paged regularly, comprehensive monitoring.

Clinic.js

Performance Debugging

Open source, actually useful for tracking down memory leaks and performance issues. No fancy dashboards but the flame graphs saved my ass when we had mysterious CPU spikes. Takes 10 minutes to learn.

No fancy dashboards.

Free (Open Source)

Tracking down memory leaks and performance issues, CPU spikes.

DataDog

Monitoring

Generic monitoring that works with everything. Node.js integration is decent.

Not as good as specialized tools. Their pricing gets insane fast

  • we hit $800/month before optimizing our metrics.

Can be very expensive ($800+/month)

Teams already paying for it, generic multi-service monitoring.

N|Solid

Node.js Monitoring

Colleagues say it's good for Node.js specific issues.

Expensive and probably overkill unless you're debugging memory leaks weekly.

Expensive

Debugging Node.js specific issues, weekly memory leak debugging.

[PM2 Clustering](https://pm2.keymetrics.io/docs/usage/cluster-mode/) and Why It Breaks

PM2 Cluster Mode Saved Our Ass

Had a Node.js API serving 2000 concurrent users on a single process. One bad request with a JSON parsing error brought down the entire service for 20 minutes. Switched to PM2 cluster mode. Now when one worker shits the bed, the others keep running.

// ecosystem.config.js - This config actually works
module.exports = {
  apps: [{
    name: 'api-server',
    script: './app.js',
    instances: 4, // Not 'max' - learned this the hard way
    exec_mode: 'cluster',
    max_memory_restart: '1G',
    kill_timeout: 5000,
    env: {
      NODE_ENV: 'production',
      PORT: 3000
    }
  }]
}

The 'max' Instances Trap

Don't use `instances: 'max'` unless your app is purely I/O bound. I set it to max on a CPU-intensive image processing API and performance went to shit. Each worker was fighting for CPU time. Reduced to 4 instances on an 8-core machine and response times improved by 60%.

Rule of thumb: Start with half your CPU cores, monitor CPU usage, adjust accordingly.

Node.js Worker Threads Diagram

When PM2 Clustering Breaks

Database connection pools get multiplied - Each worker creates its own pool. Had MySQL max out connections because 8 workers × 10 connections each = 80 connections. Set pool size per worker, not total app load.

Sticky sessions don't work with some load balancers - Spent a weekend debugging why user sessions kept getting lost. PM2's internal load balancer doesn't respect session cookies. Use nginx upstream with `ip_hash` if you need sticky sessions.

Memory restart kills all workers at once - The max_memory_restart setting triggers for each worker individually, but if they're all leaking memory, they'll all restart around the same time. Found this during a memory leak incident - our entire API went down for 30 seconds during restart.

Kubernetes Reality Check

Kubernetes is not a magic bullet - It's another layer of complexity. Unless you're running dozens of services and have dedicated DevOps engineers, PM2 is simpler and more reliable. I've seen too many teams spend months wrestling with K8s configs when PM2 would have solved their scaling needs in a day.

Docker adds overhead - Each container uses extra memory and CPU compared to native processes. For a simple Node.js API, the overhead isn't worth it unless you're already containerizing everything else.

Memory Leaks Will Happen

Found our first major leak through AWS bills - EC2 instance kept scaling up memory usage. Turned out we weren't calling `removeListener()` on a EventEmitter in our WebSocket handler. Every disconnect left listeners attached. Fixed with one line of code, saved $200/month in unnecessary RAM.

Global caches are memory leaks waiting to happen - Had a "performance optimization" that cached user data in a global Map object. Never implemented expiration. After 2 weeks, the process was using 3GB RAM to cache 50k user objects that were mostly stale.

The PM2 memory monitoring trick:

pm2 monit  # Shows real-time memory usage per worker
pm2 logs   # Check for OOM errors
pm2 restart app --update-env  # Restart with fresh memory

PM2 Monitoring Interface

Debugging Memory Issues at 3AM

Chrome DevTools for production - Use node --inspect with PM2. Connect Chrome DevTools remotely to take heap snapshots. Found a closure holding 500MB of image data this way.

Node.js Cluster Master-Worker Architecture

The nuclear option - When memory usage hits the limit and you can't figure out why, restart the worker. Better 5 seconds of downtime than 20 minutes of OOM crashes.

Set memory limits before you need them - max_memory_restart: '1G' saved us multiple times. The process restarts cleanly instead of getting killed by the OOM killer.

Shit That Actually Breaks

Q

Why does PM2 say my app is running but users can't connect?

A

Because PM2 doesn't check if your app actually works, just if the process exists. Your app could be binding to localhost instead of 0.0.0.0, stuck in an infinite loop, or crashed but the process is still there like a zombie.Quick fix:bashpm2 logs # Check what's actually happeningnetstat -tlnp | grep 3000 # Is it actually listening?curl localhost:3000/health # Does it respond?Spent 3 hours checking PM2 logs before realizing the app was binding to 127.0.0.1 instead of 0.0.0.0 in Docker. External traffic couldn't reach it.

Q

My Node.js app stops responding but CPU is at 100%

A

Event loop is blocked.

You have synchronous code in a hot path freezing everything. Common culprits:

  • fs.readFileSync() in a request handler
  • Heavy JSON parsing without streaming
  • Database queries without proper async handling
  • Crypto operations blocking the main threadFind the blocking code:bashnode --prof app.js # Run with profilingnode --prof-process isolate-*.log # Analyze where time is spent
Q

Why does my memory usage keep growing until the process crashes?

A

Memory leak.

You're not cleaning up event listeners, database connections, or timers. Every request leaves something behind.Common memory leaks I've actually fixed:

  • EventEmitter listeners not removed with removeListener()
  • Database connections not properly closed
  • setInterval() timers that never get cleared
  • Global caches that never expire
  • Closures holding references to large objectsDebug it:```bashnode --inspect app.js # Enable inspector# Open Chrome Dev

Tools, take heap snapshots over time# Look for objects growing in count```

Q

How many PM2 instances should I actually run?

A

Start with half your CPU cores.

Monitor CPU usage. Adjust up or down.I've seen people use instances: 'max' and wonder why performance is terrible.

If your app does any CPU work (image processing, crypto, JSON parsing), workers will fight for CPU time.Real numbers from production:

  • 8-core server, I/O heavy API: 8 instances works fine
  • Same server, image processing: 4 instances performs better
  • Database-heavy app: 6 instances, limited by DB connection pool
Q

Zero-downtime deployment that actually works

A

pm2 reload works most of the time, but sometimes processes don't shut down gracefully and connections get dropped.Better approach:bashpm2 reload app.js --update-env# If processes hang:pm2 restart app.js # Nuclear optionIn your app, handle SIGTERM properly:javascriptprocess.on('SIGTERM', () => { console.log('Shutting down gracefully'); server.close(() => { process.exit(0); });});Without proper shutdown handling, PM2 will kill the process after 1600ms, dropping active connections.

Q

Database connections are maxing out

A

Each PM2 worker creates its own connection pool. 8 workers × 10 connections = 80 total connections to your database.Your MySQL server defaults to 151 max connections. You're using half just for one Node app.Fix the math:javascriptconst pool = mysql.createPool({ connectionLimit: Math.ceil(10 / process.env.instances), // Divide by worker count // Or just use fewer connections per worker connectionLimit: 5});

Q

My app randomly exits with code 0

A

Unhandled promise rejection. Node.js 15+ will crash your process when promises reject without .catch() handlers.bash# Add this to find the sourcenode --unhandled-rejections=warn app.js# Or make it crash immediately for debuggingnode --unhandled-rejections=strict app.jsAlways handle promise rejections:javascript// Baddatabase.query('SELECT * FROM users');// Good database.query('SELECT * FROM users').catch(err => { console.error('Database error:', err); // Handle the error, don't crash});

Q

Should I use Node.js 22 in production?

A

Use Node.js 22 LTS (available since October 29, 2024).

Don't use non-LTS versions in production

  • you'll get weird bugs that are already fixed in newer versions but you can't upgrade without going to a non-LTS version.Version gotchas I've hit:

  • Node.js 18.0.0:

Memory leak in worker threads

  • Node.js 16.9.0: Crypto functions broke for legacy code
  • Node.js 20.0.0:

Changed default DNS resolution, broke our internal servicesAlways test in staging first. Use specific versions in Docker: FROM node: 22.8.0-alpine, not FROM node:22-alpine.

Monitoring That Actually Works

Node.js Monitoring Dashboard

Your Monitoring Sucks If It Only Tells You About Problems After They Happen

Basic uptime monitoring is useless. It tells you the site is down 5 minutes after your users already started complaining on Twitter.

Metrics that actually matter:

Don't fall for the "AI-powered" marketing bullshit

Every monitoring vendor claims "AI insights" now. Most just set automatic thresholds and call it AI. Real debugging still requires looking at the data yourself.

What actually helps:

  • Flame graphs showing where CPU time goes
  • Heap snapshots comparing memory usage over time
  • Stack traces from actual errors, not generic alerts
  • Query performance data with actual SQL statements

Tools that work without the hype:

Security Monitoring That Isn't Theater

Most "security monitoring" is checking boxes for compliance. Here's what actually protects your Node.js app:

`npm audit` every time you deploy - New vulnerabilities get discovered weekly. That lodash version from 6 months ago probably has CVEs now.

Rate limiting that actually works:

const rateLimit = require('express-rate-limit');
const limiter = rateLimit({
  windowMs: 15 * 60 * 1000, // 15 minutes
  max: 100, // limit each IP to 100 requests per windowMs
  message: 'Too many requests'
});

Monitor for obvious attack patterns:

  • Requests with SQL in query parameters
  • Repeated 401/403 responses from same IP
  • Unusual spikes in POST requests
  • File upload attempts to weird paths

Node.js 22's permission model is experimental and breaks half your dependencies. Don't use it in production yet.

Performance Optimization Based on Reality, Not Blog Posts

Start with the obvious stuff:

  • Enable gzip compression (saves 70% bandwidth)
  • Use connection pooling for databases
  • Cache frequently accessed data in Redis
  • Don't parse JSON payloads larger than 10MB

Find your actual bottlenecks:

clinic doctor -- node app.js  # Generates performance report
clinic flame -- node app.js   # CPU flame graphs

Database query performance matters more than Node.js optimization - Spent weeks optimizing Node code that improved response times by 50ms. One database index reduced response times by 500ms.

Distributed Tracing Is Overkill Until It Isn't

If you have 3 services, skip distributed tracing. Use correlation IDs in logs and grep for request flows.

If you have 15+ services and can't figure out why requests are slow, then distributed tracing becomes worth the complexity.

Simple correlation ID pattern:

app.use((req, res, next) => {
  req.id = require('crypto').randomBytes(16).toString('hex');
  console.log(`${req.id}: ${req.method} ${req.path}`);
  next();
});

Now you can grep logs across services to follow request paths.

Grafana Monitoring Dashboard Example

The Reality of Production Monitoring

Most monitoring alerts are noise - You'll get paged for memory usage spikes during log rotation, CPU alerts during scheduled backups, and disk space warnings from log files.

Good monitoring setup takes weeks to tune - You'll spend the first month adjusting thresholds so you're not getting false alarms every night.

Monitor what you can actually fix - Getting alerted that AWS Lambda cold starts are slow doesn't help if you can't do anything about it.

Cost monitoring is as important as performance monitoring - Set up billing alerts. Cloud costs can spiral fast when your app starts misbehaving.

Resources That Don't Suck

Related Tools & Recommendations

tool
Similar content

Node.js Microservices: Avoid Pitfalls & Build Robust Systems

Learn why Node.js microservices projects often fail and discover practical strategies to build robust, scalable distributed systems. Avoid common pitfalls and e

Node.js
/tool/node.js/microservices-architecture
100%
tool
Similar content

Fix Astro Production Deployment Nightmares: Troubleshooting Guide

Troubleshoot Astro production deployment issues: fix 'JavaScript heap out of memory' build crashes, Vercel 404s, and server-side problems. Get platform-specific

Astro
/tool/astro/production-deployment-troubleshooting
90%
tool
Similar content

Node.js Security Hardening Guide: Protect Your Apps

Master Node.js security hardening. Learn to manage npm dependencies, fix vulnerabilities, implement secure authentication, HTTPS, and input validation.

Node.js
/tool/node.js/security-hardening
88%
tool
Similar content

Node.js Docker Containerization: Setup, Optimization & Production Guide

Master Node.js Docker containerization with this comprehensive guide. Learn why Docker matters, optimize your builds, and implement advanced patterns for robust

Node.js
/tool/node.js/docker-containerization
88%
tool
Similar content

SvelteKit Deployment Troubleshooting: Fix Build & 500 Errors

When your perfectly working local app turns into a production disaster

SvelteKit
/tool/sveltekit/deployment-troubleshooting
85%
integration
Similar content

MongoDB Express Mongoose Production: Deployment & Troubleshooting

Deploy Without Breaking Everything (Again)

MongoDB
/integration/mongodb-express-mongoose/production-deployment-guide
81%
tool
Similar content

Node.js Overview: JavaScript Runtime, Production Tips & FAQs

Explore Node.js: understand this powerful JavaScript runtime, learn essential production best practices, and get answers to common questions about its performan

Node.js
/tool/node.js/overview
81%
tool
Similar content

Node.js Memory Leaks & Debugging: Stop App Crashes

Learn to identify and debug Node.js memory leaks, prevent 'heap out of memory' errors, and keep your applications stable. Explore common patterns, tools, and re

Node.js
/tool/node.js/debugging-memory-leaks
81%
tool
Similar content

Bolt.new Production Deployment Troubleshooting Guide

Beyond the demo: Real deployment issues, broken builds, and the fixes that actually work

Bolt.new
/tool/bolt-new/production-deployment-troubleshooting
81%
tool
Similar content

Supabase Production Deployment: Best Practices & Scaling Guide

Master Supabase production deployment. Learn best practices for connection pooling, RLS, scaling your app, and a launch day survival guide to prevent crashes an

Supabase
/tool/supabase/production-deployment
81%
tool
Similar content

Cursor Security & Enterprise Deployment: Best Practices & Fixes

Learn about Cursor's enterprise security, recent critical fixes, and real-world deployment patterns. Discover strategies for secure on-premises and air-gapped n

Cursor
/tool/cursor/security-enterprise-deployment
81%
tool
Similar content

Node.js Performance Optimization: Boost App Speed & Scale

Master Node.js performance optimization techniques. Learn to speed up your V8 engine, effectively use clustering & worker threads, and scale your applications e

Node.js
/tool/node.js/performance-optimization
78%
tool
Similar content

Express.js - The Web Framework Nobody Wants to Replace

It's ugly, old, and everyone still uses it

Express.js
/tool/express/overview
78%
tool
Similar content

Docker: Package Code, Run Anywhere - Fix 'Works on My Machine'

No more "works on my machine" excuses. Docker packages your app with everything it needs so it runs the same on your laptop, staging, and prod.

Docker Engine
/tool/docker/overview
73%
troubleshoot
Similar content

Fix MongoDB "Topology Was Destroyed" Connection Pool Errors

Production-tested solutions for MongoDB topology errors that break Node.js apps and kill database connections

MongoDB
/troubleshoot/mongodb-topology-closed/connection-pool-exhaustion-solutions
73%
howto
Similar content

Install Node.js & NVM on Mac M1/M2/M3: A Complete Guide

My M1 Mac setup broke at 2am before a deployment. Here's how I fixed it so you don't have to suffer.

Node Version Manager (NVM)
/howto/install-nodejs-nvm-mac-m1/complete-installation-guide
69%
tool
Similar content

Fix Pulumi Deployment Failures - Complete Troubleshooting Guide

Master Pulumi deployment troubleshooting with this comprehensive guide. Learn systematic debugging, resolve common "resource creation failed" errors, and handle

Pulumi
/tool/pulumi/troubleshooting-guide
69%
tool
Similar content

Claude AI: Anthropic's Costly but Effective Production Use

Explore Claude AI's real-world implementation, costs, and common issues. Learn from 18 months of deploying Anthropic's powerful AI in production systems.

Claude
/tool/claude/overview
69%
tool
Similar content

BentoML Production Deployment: Secure & Reliable ML Model Serving

Deploy BentoML models to production reliably and securely. This guide addresses common ML deployment challenges, robust architecture, security best practices, a

BentoML
/tool/bentoml/production-deployment-guide
69%
howto
Similar content

Deploy Django with Docker Compose - Complete Production Guide

End the deployment nightmare: From broken containers to bulletproof production deployments that actually work

Django
/howto/deploy-django-docker-compose/complete-production-deployment-guide
69%

Recommendations combine user behavior, content similarity, research intelligence, and SEO optimization